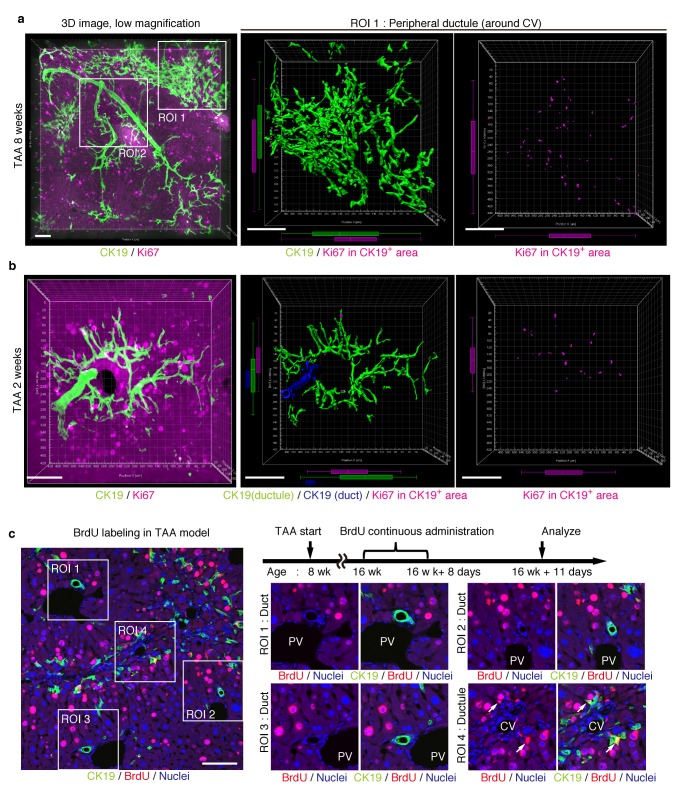
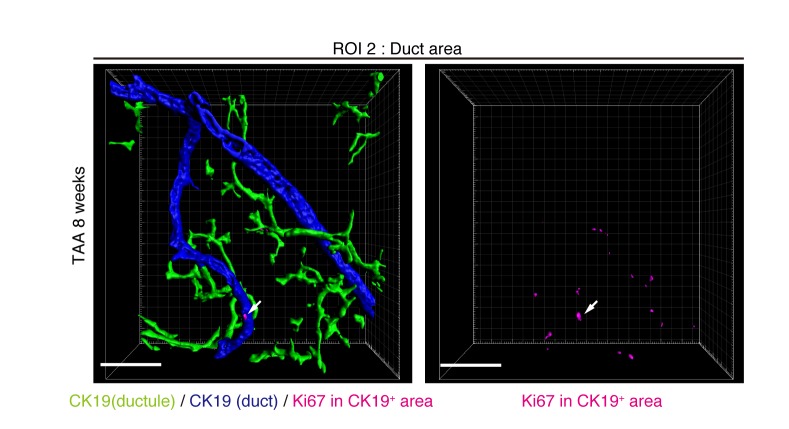
Figure 5. Proliferating BECs are scattered in the peripheral branching architectures in the biliary tree.
(a) 3D images of the biliary tree (CK19 immunostaining; green) and the cell cycle marker Ki67 (magenta) in TAA-injured liver samples. Middle and right panels show magnified views of the region of interest (ROI) 1 shown in the left panel, where CK19+ area and Ki67+ BECs therein were extracted using the IMARIS surface protocol. Distribution patterns of the CK19+ area and the Ki67+ CK19+ cells were calculated using the IMARIS vantage protocol after the signals were projected onto the background, and depicted in 2D box-and-whisker plots. (b) Liver samples at TAA 2 weeks were analyzed as in (a). Biliary structure is classified into duct compartment (shown in blue in the center image) and ductule (green). (c) Proliferating cells were labeled by continuous administration of BrdU for 8 days in the course of the TAA injury and were analyzed by anti-BrdU immunostaining (magenta). BrdU incorporation was observed in BECs residing in the peripheral ductule compartment (white arrows), but rarely in those in the duct compartment. All experiments were performed with at least 3 biological replicates.


