
Figure 4. Point spread functions.
Point spread functions were measured at 13 different positions in the field at the middle depth of the imaging volume. The sample consisted of fluorescent microbeads (diameter, 0.5 µm, embedded in 1 mm thick 1.5% agar, under 450 µm of coverglass) imaged at 970 nm. The excitation intensity was 8.75 mW, below excitation saturation of the beads. At each position, a 61 µm x 61 µm x 35 µm volume (average of 30 acquisitions) was acquired with 8.4 x 8.4 x 2 pixels per µm. Bead that were separated by at least 2 µm x 2 µm x 12 µm from the edges of the volume and other beads were analyzed. 2–13 PSFs per volume were measured. (A) Example measurement at the center of the FOV. (B) Mean intensity projections through the XY, XZ, and YZ slices of the bead. (C) Gaussian fit through the lateral slice through the bead image. (D) Same as (C), axial slice. (E–H) Same as (A–D) for a bead at the edge of the FOV (2.4 mm from the center on the top). (I) Average lateral full-width-at-half-max (FWHM) of the central XY slice of a bead, averaged across the X and Y directions. (J) Average axial FWHM. (K) Average normalized brightness of the beads. Error bars, standard deviation.

Figure 4—figure supplement 1. Point spread functions across imaging depth Point spread functions were measured at five different depths at the center of the FOV.

Figure 4—figure supplement 2. Point spread functions across the imaging volume Point spread functions were measured at 15 different locations across the imaging volume.

Figure 4—figure supplement 3. Point spread functions at different excitation wavelengths.
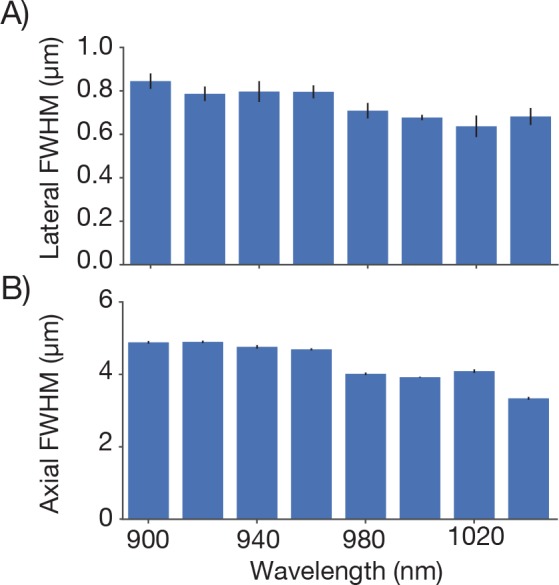
Figure 4—figure supplement 4. Point spread functions as a function of coverglass angle.
