

Abstract
Purpose
The balance of benefits and harms in prostate cancer screening has not been sufficiently characterized. We related indicators of mortality reduction and overdetection by center within the European Randomized Study of Prostate Cancer Screening.
Experimental Design
We analyzed the absolute mortality reduction expressed as number needed to invite (NNI=1/absolute risk reduction; indicating how many men had to be randomized to screening arm to avert a prostate cancer death) for screening and the absolute excess of prostate cancer detection as number needed for overdetection (NNO=1/absolute excess incidence; indicating the number of men invited per additional prostate cancer case), and compared their relationship across the seven ERSPC centers.
Results
Both absolute mortality reduction (NNI) and absolute overdetection (NNO) varied widely between the centers: NNI 200-7000 and NNO 16-69. Extent of overdiagnosis and mortality reduction were closely associated (correlation coefficient r=0.76, weighted linear regression coefficient β=33, 95% 5-62, R2=0.72). For an averted prostate cancer death at 13 years of follow-up, 12-36 excess cases had to be detected in various centers.
Conclusions
The differences between the ERSPC centers likely reflect variations in prostate cancer incidence and mortality, as well as in screening protocol and performance. The strong interrelation between the benefits and harms suggests that efforts to maximize the mortality effect are bound to increase overdiagnosis, and might be improved by focusing on high-risk populations. The optimal balance between screening intensity and risk of overdiagnosis remains unclear.
Keywords: Screening, Prostate neoplasms, Number needed to screen, Randomized trials, Prostate-specific antigen
Introduction
Prostate cancer screening remains controversial despite evidence from the European Randomized Study of Screening for Prostate Cancer (ERSPC) showing a 20% reduction in prostate cancer mortality (1).
The major adverse effect of prostate cancer screening is overdiagnosis, i.e. detection of cases that would not have been diagnosed during a man's lifetime in the absence of screening. The extent of overdiagnosis has been estimated as 25-50% of the screen-detected cases (2,3). Overdiagnosis is due to both substantial lead-time gained by screening and increased detection of slow-growing or even non-progressive disease. Overdiagnosis can rarely be recognized at individual level at the time of diagnosis based on pathological and clinical presentation alone, as it also depends on a man's remaining life span. Therefore, the full extent of overdiagnosis can generally be shown only through comparison of screened and unscreened populations. However, modelling studies have suggested that if the long-term benefits of screening are predicted based on ERSPC, they would eventually outweigh the adverse effects in terms of quality-adjusted life-years (4).
Absolute measures of effect (such as risk or rate difference) provide more concrete indication of intervention effect, as they reflect the probability of the benefit or adverse effect, i.e. the increase or decrease in frequency of occurrence (and hence usually also on the level of background risk). In contrast, relative measures (for instance rate ratio or risk ratio) do not capture this aspect and cannot be interpreted as probabilities of benefit and harm (unless combined with the underlying risk, as they express the effect as a multiple of the baseline risk). Due to the more tangible information provided by absolute effect measures, reporting guidelines for randomized trials recommend showing both types of results (5,6). Number needed to treat is the absolute measure used for treatment trials, and number needed to screen the equivalent metric for screening trials (7,8). To factor in incomplete compliance in screening trials (particularly population-based effectiveness trials), number needed to invite has been developed as a further indicator of absolute screening effect (9). Absolute measures of effect depend, however, not only on screening procedures, but also on the duration of follow-up, background risk in study population (e.g. age distribution) and different studies are therefore not directly comparable.
Within the ERSPC, there are differences in both study populations (e.g. underlying prostate cancer incidence and mortality), as well as screening procedures (despite common core protocol, e.g. in number of screening rounds). Here, we describe the differences in the absolute effect of screening, with number of men needed to invite to avoid one prostate cancer death (number needed to invite, NNI) as an indicator of the screening benefit and for harms, absolute risk of overdiagnosis expressed as number needed for overdiagnosis (NNO), calculated as the inverse of the excess risk (cumulative incidence) of prostate cancers in the screening versus control arm. The balance of the benefits and harms (NNI/NNO ratio) is expressed as the number of excess cases needed to detect for averting one prostate cancer death (number needed to detect, NND). The pooled ERSPC results based on the same data were published recently (1), and the present paper constitutes a secondary analysis.
Materials and Methods
ERSPC is a randomized multi-center trial, with the primary aim to assess the effect of prostate-specific antigen (PSA) –based screening on prostate cancer mortality. The trial was initiated in the mid-1990's (from 1991-1998) in seven centers (the Netherlands, Belgium, Sweden, Finland, Italy, Spain and Switzerland). France joined later, but was excluded from this analysis due to short follow-up.
Men in the intervention arm were invited to PSA-based screening and those in the control arm received no intervention (usual care, Figure 1). Eligible subjects were identified from population registers and individually randomized based on random numbers (with 1:1 allocation, except in Finland with a fixed size of the screening arm leading to an intervention/control ratio of approximately 1:1.5). Consent was obtained prior to randomization in most countries (volunteer-based efficacy trial), but randomization before consent was used in Sweden, Finland and Italy (population-based effectiveness trial). Recruitment was completed in all centers by the end of 2003. The screen interval was four years, except in Sweden a two-year interval was used. PSA determination with a cut-off of ≥3.0 ng/ml was the principal screening test (an ancillary test was used at 3.0-3.9 ng/ml in Finland). Screen-positive men were referred to prostatic biopsies. Screening was discontinued after three screening rounds in most centers, but continued up to five times in the Netherlands and ten rounds in Sweden. Institutional review board approvals were obtained in each center. The ERSPC trial is registered in Current Controlled Trials as ISRCTN49127736.
Figure 1.

Flow chart of the ERSPC trial
Data on deaths and emigrations were obtained from national or regional population registries. Prostate cancer cases detected outside screening (interval cases, cancers in non-participants and in the control arm) were identified through cancer registries. Prostate cancer deaths were ascertained in each center by causes of death committees that evaluated all deaths in men diagnosed with prostate cancer and/or prostate as a cause of death in the death certificate, with blinding to the arm of the trial and following a uniform algorithm developed for the trial (10). In Finland, death certificates were used after the initial period, based on very high concordance between the committee assignments and the official causes of death (κ>0.9)(11).
The present analysis is limited to the core age group, 55-69 years, to improve comparability between the centers. For the same reason, follow-up was truncated at 13 years, even if data were available through 2010, potentially allowing longer follow-up in some centers. A mean length of follow-up of at least 13 years was available in all included centers, except only 10 years in Switzerland. The intention-to-screen principle was used in the analysis, with groups compared formed by random allocation (regardless of compliance).
Number needed to invite (NNI) to avert one prostate cancer death was calculated as the inverse of the absolute risk difference in prostate cancer mortality between the arms (NNI=1/[Mc-Ms]) to indicate the mortality reduction by screening. As an indicator of overdiagnosis, number needed for overdetection (NNO) was calculated as the inverse of the risk difference in cumulative incidence of prostate cancer between the trial arms (NNO=1/[Is-Ic]), which represents the absolute risk of overdiagnosis (12). Finally, number needed to detect (NND) as a measure of the overall impact (benefits and harms) is shown as the ratio of the reduction in prostate cancer mortality to the excess prostate cancer incidence (NNI/NNO). In the calculation of number needed –indicators, the values are always rounded upward (to the next integer). For their interpretation, it is essential to appreciate that a smaller value indicates a larger effect.
Linear regression with weighting by number of prostate cancer deaths was used to assess the relationship between NNI and NNO between the centers, as well as in the analysis of the relation between the characteristics of the ERSPC centers (baseline risk, number of screens, proportion of positive screening tests and proportion of screen-positive men biopsied) and the impact measures (NNI, NNO and NND). The assumption of normal distribution was assessed using Shapiro-Wilks test. Poisson regression analysis was conducted with the numbers of cases as the outcome and number of men as the offset.
Results
A summary of the screening performance by center is shown in Table 1.
Table 1.
Description of some key characteristics of the centers in the European randomized Study of Screening for Prostate Cancer (ERSPC).
| Feature | Netherlands | Belgium | Sweden | Finland | Italy | Spain | Switzerland |
|---|---|---|---|---|---|---|---|
| Recruitment period | 1993-2000 | 1991-2003 | 1994 | 1996-1999 | 1996-2000 | 1996-1999 | 1998-2003 |
| Median age* | 62 | 63 | 60 | 59 | 62 | 60 | 61 |
| Screened ≥once (%) | 95 | 91 | 76 | 74 | 79 | 100 | 97 |
| Screening rounds attended (mean) | 2.4 | 1.6 | 3.5 | 2.2 | 2.2 | 1.7 | 2.5 |
| Screening positive (%) | 24 | 16 | 19 | 11 | 11 | 19 | 22 |
| # | 23 | 14 | 11 | 10 | 22 | 8 | 23 |
| Screen-positives biopsied (%) | 90 | 71 | 87 | 91 | 63 | 74 | 78 |
| # | 90 | 67 | 90 | 94 | 44 | 85 | 87 |
At entry, within the core age group, 55-69 years
At 1st screening round
The size of the study population (within the core age group) ranged from in 2197 in Spain to 80,379 in Finland (Table 2). The proportion of men in the screening arm attending at least once was more than 90% in the volunteer-based centers and approximately 75% in the population-based centers. The proportion of positive tests was lowest (approximately 11%) in Italy with a low prostate cancer incidence and in Finland, where an ancillary test (free/total PSA ratio with a cut-off 0.16) was used at PSA range 3.0-3.9. The proportion of positive tests was highest (>20%) in the Netherlands and Switzerland with various side studies involving additional tests.
Table 2. Numbers of men, prostate cancers and prostate cancer deaths by trial arm and centre in the European Randomised Study of Prostate Cancer Screening (ERSPC).
| Control arm | Screening arm | |||||
|---|---|---|---|---|---|---|
| CENTRE | Men | PC cases | PC deaths | Men | PC cases | PC deaths |
| The Netherlands | 17,390 | 1070 | 126 | 17,443 | 2180 | 85 |
| Belgium | 4255 | 321 | 23 | 4307 | 417 | 18 |
| Sweden | 5951 | 469 | 62 | 5901 | 738 | 38 |
| Finland | 48,409 | 3609 | 284 | 31,970 | 3018 | 170 |
| Italy | 7251 | 289 | 32 | 7266 | 396 | 18 |
| Spain | 1141 | 52 | 4 | 1056 | 87 | 2 |
| Switzerland | 4955 | 297 | 14 | 4948 | 572 | 16 |
The highest cumulative incidence at 13 years in the screening arm was seen in Sweden and the Netherlands (12.5%), followed by Switzerland (11.6%) (Table 3). The cumulative incidence in the control arm was highest in Sweden (7.9%), followed by Finland and Belgium (7.5%). The excess incidence (difference in cumulative incidence between the arms) ranged from 1.5% in Italy to 6.3% in the Netherlands. The number needed for overdetection (NNO) ranged from 16-22 in the Netherlands, Switzerland and Sweden (indicating one excess case detected per approximately 20 screened men) to 47-69 in Finland, Belgium and Italy.
Table 3. Cumulative incidence of prostate cancer by arm, with excess incidence and number needed for overdetection by ERSPC centre.
| CENTRE | Cumulative PC incidence, % | Excess incidence | Number needed for overdiagnosis | |
|---|---|---|---|---|
| Screening, IS | Control, IC | (IS-IC), % | (1/excess incidence)* | |
| The Netherlands | 12.5 | 6.2 | 6.3 | 16 |
| Belgium | 9.7 | 7.5 | 2.1 | 47 |
| Sweden | 12.5 | 7.9 | 4.6 | 22 |
| Finland | 9.4 | 7.5 | 2.0 | 51 |
| Italy | 5.5 | 4.0 | 1.5 | 69 |
| Spain | 8.2 | 4.6 | 3.7 | 28 |
| Switzerland | 11.6 | 6.0 | 5.6 | 18 |
Expressed as an integer, with rounding upward
When patients treated with active surveillance were excluded, the extent of overdetection was strongly reduced in Sweden (NNO increased from 22 to 41), Finland (from 51 to 137) and Switzerland (from 18 to 34), where active surveillance was commonly used, and also to some extent in Belgium (from 47 to 62), but the difference was not substantial in the other centers (in the Netherlands from 16 to 19, Italian and Spanish results almost unaltered due to infrequent use of active surveillance).
Prostate cancer mortality within the control arm was highest in Sweden (10 per 1000 men) followed by the Netherlands, Finland and Belgium, (approximately 5-7 per 1000) (Table 4). Also in the screening arm, prostate cancer mortality was highest in Sweden, Finland and the Netherlands (5-6 per 1000). A reduction in prostate cancer mortality was achieved in all centers except Switzerland. The absolute reduction was largest in Sweden (4 per 1000), followed by the Netherlands and Belgium (1-2 per 1000). The mortality reduction relative to population size (number needed to invite, NNI) ranged from 252 in Sweden to 1821 in Finland (not defined for Switzerland).
Table 4. Prostate cancer mortality by arm, with mortality reduction and number needed to invite by ERSPC center.
| CENTER | Cumulative PC mortality, % | Mortality reduction | Number needed to invite | Number needed to detect | |
|---|---|---|---|---|---|
| Screening, Ms | Control, Mc | (Mc-Ms), % | (1/mortality reduction)* | (NNI/NNO)# | |
| The Netherlands | 0.49 | 0.72 | 0.24 | 422 (253-1381) | 27 |
| Belgium | 0.42 | 0.54 | 0.12 | 816 (243 – ND) | 18 |
| Sweden | 0.64 | 1.04 | 0.40 | 252 (140-1534) | 12 |
| Finland | 0.53 | 0.59 | 0.05 | 1821 (631 – ND) | 37 |
| Italy | 0.36 | 0.44 | 0.08 | 1198 (349 – ND) | 29 |
| Spain | 0.19 | 0.35 | 0.16 | 621 (419 – ND) | 23 |
| Switzerland | 0.32 | 0.28 | -0.04 | ND§ | ND§ |
Expressed as an integer, with rounding upward
No mortality reduction, NNI not meaningful
1Number needed to detect/number needed for overdiagnosis (1/mortality reduction : 1/excess incidence = excess incidence/mortality reduction)
The amount of mortality reduction per number of invited men (mean NNI) pooled across the centers was 855 (SD 576, excluding Switzerland) and the excess incidence relative to population size (mean NNO) was 36 (SD 20, including Switzerland). The variability between centers was larger in mortality impact than excess detection (ratio of smallest to largest value 7 for NNI versus 4 NNO, SD 67% of the mean for NNI vs. 55% for NNO). When the probability of benefit (absolute reduction in prostate cancer mortality, NNI) was related to the probability of harm (excess incidence, NNO), Sweden and the Netherlands showed both the largest absolute mortality reduction and the highest absolute excess incidence (Figure 2). The other centers (Finland, Italy, Belgium and Spain) showed both lower mortality reduction (higher NNI) and less excess incidence (larger NNO). In Switzerland, however, a high excess incidence was not balanced by mortality reduction. The proportion of screen-positive results was significantly associated with both mortality reduction (NNI) and excess detection (NNO) (p=0.001 and r2>0.8 for both), but other center characteristics such as median age, number of screening rounds and baseline risk (prostate cancer incidence or mortality in the control arm) were not.
Figure 2.
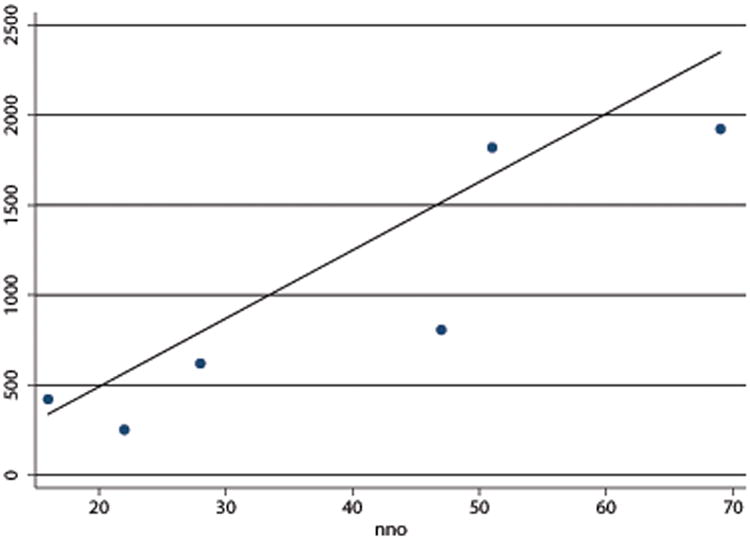
Number needed for overdetection
The relationship between absolute prostate cancer mortality reduction, expressed as number needed to invite (NNI = 1/risk difference) and absolute excess of cumulative prostate cancer incidence, expressed as number needed for overdetection (NNO = 1/risk difference) by center in the ERSPC.
The correlation coefficient for absolute mortality impact and absolute excess incidence (NNI and NNO) was 0.76 (excluding Switzerland) and linear regression coefficient (with weighting of centers by number of prostate cancer deaths) was 33 (95% CI 5-62, p=0.03 with R2=0.65), larger mortality reduction associated with larger overdetection, indicating intensive screening resulting in both large benefits and adverse effects. Adjustment for age in linear regression analysis did not weaken the association between mortality reduction and excess incidence (NNI and NNO). If Finland was excluded, the association was stronger (r=0.95, linear regression r2=0.84, p=0.02), while exclusion of the other major centers (Sweden or the Netherlands) did not substantially affect the result.
A confirmatory Poisson regression analysis also showed a significant association between excess incidence of prostate cancer and reduction in prostate cancer mortality by center (p<0.001).
The ratio of mortality reduction to excess incidence (mean number need to detect, NND, calculated as NNI/NNO) for the six centers was 22, with a range 12-36. It was smallest for Sweden (NND=12), indicating that the number of excess cases per averted prostate cancer death was less than in other centers, and largest for Finland (NND=36), with both smaller mortality reduction and excess incidence. Baseline risk (prostate cancer mortality in the control arm) showed little association with the excess incidence (NND), nor did number of screening rounds attended, proportion of positive screening tests, or proportion of screening-positive men biopsied (for all p>0.2, r2<0.2 in linear regression).
Discussion
Our analysis of absolute measures of screening benefits (prostate cancer mortality reduction, NNI) and harms (excess prostate cancer incidence, NNO) shows that at 13 years of follow-up on average 12-36 excess prostate cancer have to be detected in order to avert one death from the disease. In comparison between the ERSPC centers, a direct correlation was observed between screening benefit and harm. This suggests that with the current screening regimens, any efforts to increase the effectiveness of screening are likely accompanied by unavoidable increase in the harmful effects. This was further supported by the association of the proportion of positive screening tests with both mortality reduction (NNI) and excess incidence (NNO). A likely explanation is the largely overlapping PSA distribution among fatal and overdiagnosed prostate cancer cases, i.e. PSA does not allow a sharp distinction of lethal and inconsequential prostate cancer in the early preclinical phase of the disease due to a long lead-time (detection several years earlier – and at a younger age – compared with clinical diagnosis) and length bias (increased detection of slowly growing cancers with a long detectable pre-clinical phase by screening).
Our results can be interpreted as suggesting a substantial overlap between cases that contribute to mortality reduction achievable by screening and those that would remain undetected in the absence of screening. This notion is supported by the fact that prediction of disease outcome in patients with low-risk features is highly uncertain and therefore distinguishing patients that would substantially benefit from treatment is challenging. This means that screen-detected cases include both tumors with indolent and progressive behavior, but we are currently unable to clearly discern the two. It is also consistent with trials showing only modest benefit from prostatectomy compared with expectant management in low-risk prostate cancer (13,14) and very high cause-specific survival in patients treated with active surveillance (15), both indicating small advantage attainable by active treatment in men with a low-risk prostate cancer.
The wide variation between the ERSPC centers in the outcomes appears to reflect mainly differences in screening protocols, as risks and benefits were not clearly associated with the underlying risks between the populations. Yield of screening depends on the cut-off value for the screening test, number of screening rounds and participation. These features are very likely to account for the differences in excess incidence, and hence the extent of overdetection.
Of the various features, proportion of positive tests (reflecting PSA threshold and additional tests) was most closely associated with the absolute benefit and harm (NNI and NNO). There was less variation between the centers in the ratio of benefits and harms (NND=NNI/NNO) than in the mortality effect (three-fold versus seven-fold). This also supports the interpretation that increased mortality reduction is linked to a higher rate of overdiagnosis. Sweden showed the most favorable overall impact (in terms of balance of mortality reduction to excess incidence, NND) and Finland the smallest, despite the fact that the two centers share similar population-based approaches, with comparable participation and the highest prostate cancer mortality (both nationally and in the control arm). Possible explanations include differences in screening intensity or contamination. The three-fold benefit/harm ratio (NND) in Finland compared with Sweden may indicate that it is more strongly affected by mortality reduction (NNI) than excess incidence (NNO), as NNI showed a larger (seven-fold difference) between the two countries. Likewise, substantial differences emerged between the volunteer-based efficacy trials, with both mortality impact (NNI) and excess incidence (NNO) at least twice as high for Belgium than the Netherlands. This could be attributable to the very long screening interval in Belgium (seven years).
Finding an optimal balance is probably not possible simply by maximizing only detection or minimizing overdiagnosis, but it requires consideration of several aspects of the screening program. The findings indicate that an aggressive screening protocol with a large proportion of screen-positive results is likely to increase both harms and benefits. However, the favorable overall balance of effects shown for Sweden (with an NND of 12) seem to depend mainly on the large absolute mortality reduction. One explanation could be that only an intensive or continuous screening can detect potentially lethal cancers at a curable stage. This likely leads also to increased diagnosis of indolent cases, while a less intense program yields fewer such cases, but also a small mortality reduction.
The largest mortality reduction (smallest NNI) was seen in Sweden and the Netherlands. As they had the largest number of screening rounds, as well as the longest duration of screening (up to 20 years), this finding suggests that three screening rounds employed in the other centers may not be sufficient to provide a similar mortality benefit. The lack of a mortality reduction in Switzerland may reflect shorter follow-up, as the screening effect emerges only after 7-9 years of follow-up (16), but may also be chance fluctuation (the difference being due to only two additional deaths). The absolute mortality impact is likely to increase with additional follow-up especially in centers continuing screening, owing to the slow progression of the disease and substantial proportion of deaths occurring only 10-15 years or more after diagnosis. The extent of overdetection may on the hand decrease, as the catch-up in the control arm is likely to continue for the duration of the lead-time gained in the screening arm (after cessation of screening).
The results do not necessarily indicate which screening protocol is superior, because the harms and benefits are not commensurate. Most would agree that an averted prostate cancer death carries a higher impact than an overdiagnosed case. However, assessment of their relative weight is not straight forward, as it reflects value judgment (and various preferences would likely yield contrasting evaluations of the optimal balance). One approach to improving the comparability between the different end-points is use of quality-adjusted or disability-adjusted life-years (QALYs and DALYs). We have previously modelled the long-term impact of screening and performed a cost-effectiveness analysis using QALYs as indicator of the overall effects of screening (4,17).
For reduction of overdiagnosis, multiparametric magnetic resonance imaging in guiding prostate biopsies has shown promise in detecting primarily clinically significant prostate cancer and reducing the yield of insignificant cancers (18). Novel, powerful prognostic markers would also allow identification of cases that would not require treatment and hence reduce overtreatment. Screening is likely to provide largest absolute benefit in the sub-groups with the highest risk, and correspondingly, the balance of benefit and harm is likely disadvantageous for low-risk men. Multifactorial risk stratification may allow identifying a target population with a superior screening effect.
There are some caveats in the interpretation of the results. First, the number of observations is small, as each center as a unit of observation results in a material of only six or seven data points (depending on inclusion or exclusion of Switzerland and Spain). Second, all excess incidence does not necessarily constitute overdiagnosis, but may also reflect lead-time (earlier diagnosis due to screening) with subsequent catch-up by the control arm, as both absolute and relative excess incidence have decreased with the duration of follow-up (1). Further, a high prostate cancer incidence in the control arm may reflect contamination (opportunistic screening), and the low excess incidence in such context may be regarded as spurious. This is also one possible explanation for the small mortality benefit and modest excess incidence in Finland. In addition, cause of death attribution is prone to errors, which may affect the outcomes (11,19). Overall mortality is less prone to bias, but prostate cancer is an uncommon cause of death, which precludes a reduction in overall mortality and limits the gain in life-years, as for most other screening programs (20,21). This does not, however, preclude any impact on life-years, as modelling studies have shown up to 100 life-years saved per 1000 screened men (17).
In conclusion, the results indicate a strong interrelation between benefits and harms of prostate cancer screening. Decision-making about prostate cancer screening needs to involve judgment of the importance of averted prostate cancer death relative to unnecessary diagnosis and harms of treatment, to gauge the trade-offs between benefits and harms. With intensive screening, mortality reduction achievable may be larger, but the optimal balance between benefits and harms depends on weighting and valuation of the gains versus adverse effects of screening.
Translational Relevance.
Our findings indicate that in a population-based screening program, 700-2000 men need to be invited for screening to avert one prostate cancer death during 13 years, depending on the screening algorithm and background risk in the population. The excess numbers of cases detected by screening are considerably larger, with one additional diagnosis per each 16-69 invited men. If the ratio of averted prostate cancer deaths and overdiagnosed cases (the pros and cons) is largely constant, more aggressive screening is justified mainly for high-risk groups that are likely to obtain the largest benefits (very likely men with little co-morbidity, those with family history) and those who do not emphasize the potential adverse effects of overdiagnosis (men who can cope with treatment-related side effects or active surveillance as treatment strategy).
Acknowledgments
Grant Support: The coordination of the ERSPC trial has been financially supported in part by the 6th Framework programme of the EU; European Commission Europe Against Cancer programme; and an unconditional grant from Beckmann-Coulter-Hybritech. The Finnish center has been financially supported by grants from the Academy of Finland (Grant #260 931); Cancer Society of Finland; Pirkanmaa Hospital District Competitive Research Funding, and Nordic Cancer Union; the Dutch Center by the Dutch Cancer Society, and the Netherlands Organisation for Health Research and Development (ZonMW); Sweden by Abbott Pharmaceuticals; Af Jochnick's foundation; Catarina and Sven Hagstroms family foundation, Gunvor and Ivan Svensson's foundation; Johanniterorden; King Gustav V Jubilée Clinic Cancer Research Foundation; Sahlgrenska University Hospital; Schering Plough; Swedish Cancer Society; and Wallac Oy; Belgium by Flemish Ministry of Welfare, Public Health and Family; Province and City of Antwerp; Public Centre for Social Welfare Antwerp; Italy by Italian League for the Fight against Cancer (LILT); Italian Association for Cancer Research (AIRC); and National Research Council (CNR), Tuscany Region; Switzerland by The Horten Foundation; Aargau Cancer League; Swiss Cancer League; Health Department of Canton Aargau; Prostate Cancer Research Foundation; Baugarten Foundation; and the Messerli Foundation; and Spain by The Spanish “Fondo de Investigación Sanitaria”.
Footnotes
Disclosure of Potential Conflicts of Interest: Dr Auvinen reports serving as paid consultant for Epid Research. Dr. Tammela reports serving as a board member for Astellas, Amgen, Pfizer, and GlaxoSmith-Kline, receiving consulting fees from Orion Pharma, receiving lecture fees from Astellas and Amgen, receiving payment for developing educational presentations from GlaxoSmithKline, and receiving travel support from Amgen; Dr. Taari, receiving consulting fees from Astellas, GlaxoSmithKline, Ferring, and Amgen, receiving grant support from Amgen, receiving lecture fees from GlaxoSmithKline, being an employee of Medivation, and receiving travel support from Sanofi-Aventis, Pfizer, and Astellas; Dr. Schröder receiving consulting fees from GlaxoSmithKline and Ferring, and receiving lecture fees and travel support from GlaxoSmithKline, Ferring, Société International d'Urologie, and the European Association of Urology; Dr. Aus receiving lecture fees from AstraZeneca; and Dr. Kwiatkowski receiving consulting fees from GlaxoSmithKline. All other authors declare no competing interests. The authors are solely responsible for the study design, collection, analysis, and interpretation of the data, writing the report and decision to submit for publication.
Authors' Contributions: Conception and design: A. Auvinen, T.L.J. Tammela, F.H. Schroder, J. Hugosson
Development of methodology: A. Auvinen
Acquisition of data: All authors
Analysis and interpretation of data: A. Auvinen, S.M. Moss, M.J. Roobol, C.H. Bangma, S. Carlsson, M. Kwiatkowski, J. Hugosson
Writing, review, and/or revision of the manuscript: All authors
Administrative, technical, or material support: T.L.J. Tammela, M.J. Roobol, D. Puliti, J. Hugosson
Study supervision: A. Auvinen, T.L.J. Tammela, K. Taari, L.J. Denis, M. Kwiatkowski, A. Paez, J. Hugosson
Other (functioned as international ERSPC co-coordinator): F.H. Schroder
References
- 1.Schröder FH, Hugosson J, Roobol MJ, Tammela T, Zappa M, Nelen V, et al. The European Randomized Study of Screening for Prostate Cancer - Mortality at 13 years of follow-up. Lancet. 2014;384:2027–35. doi: 10.1016/S0140-6736(14)60525-0. [DOI] [PMC free article] [PubMed] [Google Scholar]
- 2.Draisma G, Etzioni R, Tsodikov A, Mariotto A, Wever E, Gulati R, et al. Lead time and overdiagnosis in prostate-specific antigen screening. J Natl Cancer Inst. 2009;101:374–83. doi: 10.1093/jnci/djp001. [DOI] [PMC free article] [PubMed] [Google Scholar]
- 3.Etzioni R, Gulati R, Mallinger L, Mandelblatt J. Influence of study features and methods on overdiagnosis estimates in breast and prostate cancer screening. Ann Int Med. 2013;58:831–8. doi: 10.7326/0003-4819-158-11-201306040-00008. [DOI] [PMC free article] [PubMed] [Google Scholar]
- 4.Heijnsdijk E, Wever E, Auvinen A, Hugoson J, Ciatto S, Nelen V, et al. Quality of life effects of prostate specific antigen screening. N Engl J Med. 2012;367:595–605. doi: 10.1056/NEJMoa1201637. [DOI] [PMC free article] [PubMed] [Google Scholar]
- 5.Nuovo J, Melnikow J, Chang D. Reporting number needed to treat and absolute risk reduction in randomized controlled trials. JAMA. 2002;287:2813–4. doi: 10.1001/jama.287.21.2813. [DOI] [PubMed] [Google Scholar]
- 6.CONSORT 2010 statement. Updated guidelines for reporting parallel group randomized trials. www.consort-statement.org/consort-201.
- 7.Rembold CM. Number need to screen. BMJ. 1998;317:307–12. doi: 10.1136/bmj.317.7154.307. [DOI] [PMC free article] [PubMed] [Google Scholar]
- 8.Richardson A. Screening and number needed to treat. J Med Screen. 2001;8:125–7. doi: 10.1136/jms.8.3.125. [DOI] [PubMed] [Google Scholar]
- 9.Humphrey LL, Helfand M, Chan BK, Woolf SH. Breast cancer screening. Ann Intern Med. 2002;137:347–60. doi: 10.7326/0003-4819-137-5_part_1-200209030-00012. [DOI] [PubMed] [Google Scholar]
- 10.de Koning HJ, Blom J, Merkelbach JW, Raaijmakers R, Verhaegen H, van Vliet P, et al. Determining the cause of death in randomised screening trial for prostate cancer. BJU Int. 2003;92(Suppl 2):71–8. doi: 10.1111/j.1465-5101.2003.04402.x. [DOI] [PubMed] [Google Scholar]
- 11.Mäkinen T, Karhunen P, Aro J, Lahtela J, Määttänen L, Auvinen A. Cause of death attribution in a prostate cancer screening trial. Int J Cancer. 2008;122:413–7. doi: 10.1002/ijc.23126. [DOI] [PubMed] [Google Scholar]
- 12.Wu GH, Auvinen A, Määttänen L, Tammela T, Stenman UH, Hakama M, et al. Number of screens for overdetection as an indicator of absolute risk of overdiagnosis in prostate cancer screening. Int J Cancer. 2012;131:1367–75. doi: 10.1002/ijc.27340. [DOI] [PubMed] [Google Scholar]
- 13.Wilt TJ, Brawer MK, Jones KM, Barry MJ, Aronson WJ, Fox S, et al. Radical prostatectomy versus observation for localized prostate cancer. N Engl J Med. 2012;367:203–13. doi: 10.1056/NEJMoa1113162. [DOI] [PMC free article] [PubMed] [Google Scholar]
- 14.Bill-Axelson A, Holmberg L, Garmo H, Rider JR, Taari K, Busch C, et al. Radical prostatectomy or watchful waiting in early prostate cancer. N Engl J Med. 2014;370:932–42. doi: 10.1056/NEJMoa1311593. [DOI] [PMC free article] [PubMed] [Google Scholar]
- 15.Bul M, Zhu X, Valdagnani R, Pickles T, Kakeni Y, Rannikko A, et al. Active surveillance for low-risk prostate cancer world-wide: the PRIAS study. Eur Urol. 2013;63:597–603. doi: 10.1016/j.eururo.2012.11.005. [DOI] [PubMed] [Google Scholar]
- 16.Schröder FH, Hugosson J, Roobol MJ, Tammela T, Ciatto S, Nelen V, et al. Prostate cancer mortality at 11 years of follow-up in the European Randomized study of Screening for Prostate Cancer (ERSPC) N Engl J Med. 2012;366:981–90. doi: 10.1056/NEJMoa1113135. [DOI] [PMC free article] [PubMed] [Google Scholar]
- 17.Heijnsdijk EAM, de Carvalho TM, Auvinen A, Zappa M, Nelen V, Kwiatkowski M, et al. Cost-effectiveness of prostate cancer screening: a simulation study based on ERSPC data. J Natl Cancer Inst. 2014;107:366. doi: 10.1093/jnci/dju366. [DOI] [PMC free article] [PubMed] [Google Scholar]
- 18.Stephenson SK, Chang EK, Marks LS. Screening and detection advances of magnetic resonance image-guided prostate biopsy. Urol Clin North Am. 2014;41:315–26. doi: 10.1016/j.ucl.2014.01.007. [DOI] [PMC free article] [PubMed] [Google Scholar]
- 19.Otto SJ, van Leeuwen PJ, Hoekstra JW, Merkelbach JW, Blom JHM, et al. Blinded and uniform causes of death verification in cancer screening. Eur J Cancer. 2010;46:3061–67. doi: 10.1016/j.ejca.2010.09.026. [DOI] [PubMed] [Google Scholar]
- 20.Black WC, Haggstrom DA, Welch HG. All-cause mortality in randomized trials of cancer screening. J Natl Cancer Inst. 2002;94:167–73. doi: 10.1093/jnci/94.3.167. [DOI] [PubMed] [Google Scholar]
- 21.Saquib N, Saquib J, Ioannidis JP. Does screening for disease save lives in asymptomatic adults? Int J Epidemiol. 2015;44:264–77. doi: 10.1093/ije/dyu140. [DOI] [PubMed] [Google Scholar]