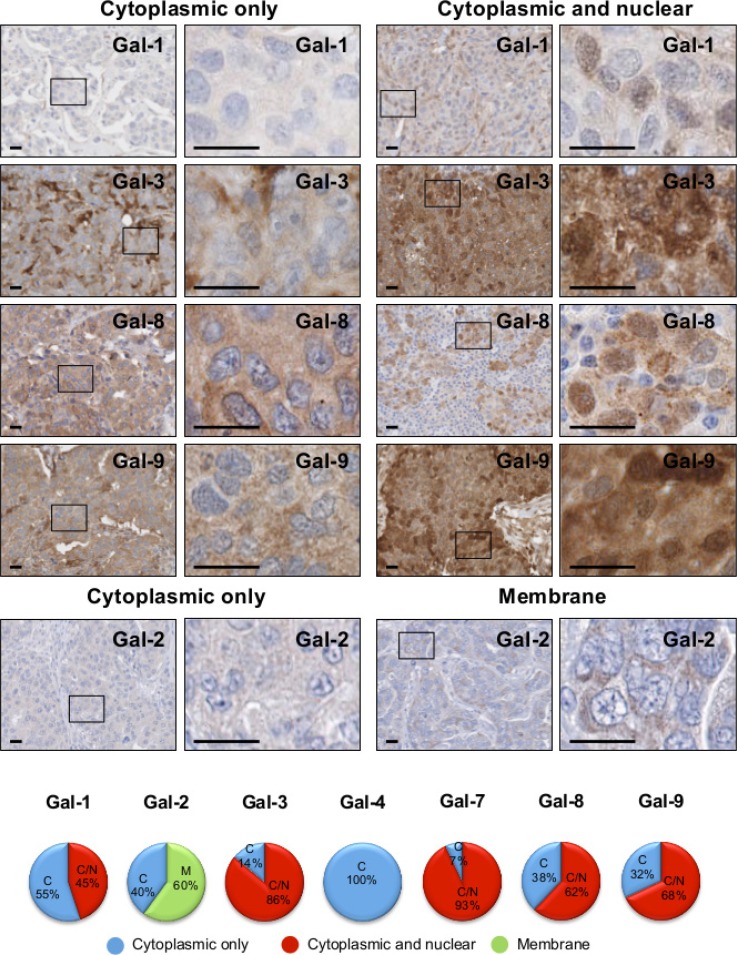
Figure 6. Subcellular localization of galectins in breast cancer tissues.
Representative IHC stainings of galectin expression in breast cancer tissues. All scale bars, 25 μm. The lower circle graphs show the percentage of galectin-positive staining in the cytosol only (C), at the membrane (M) and in the cytosol and nuclei (C/N).

