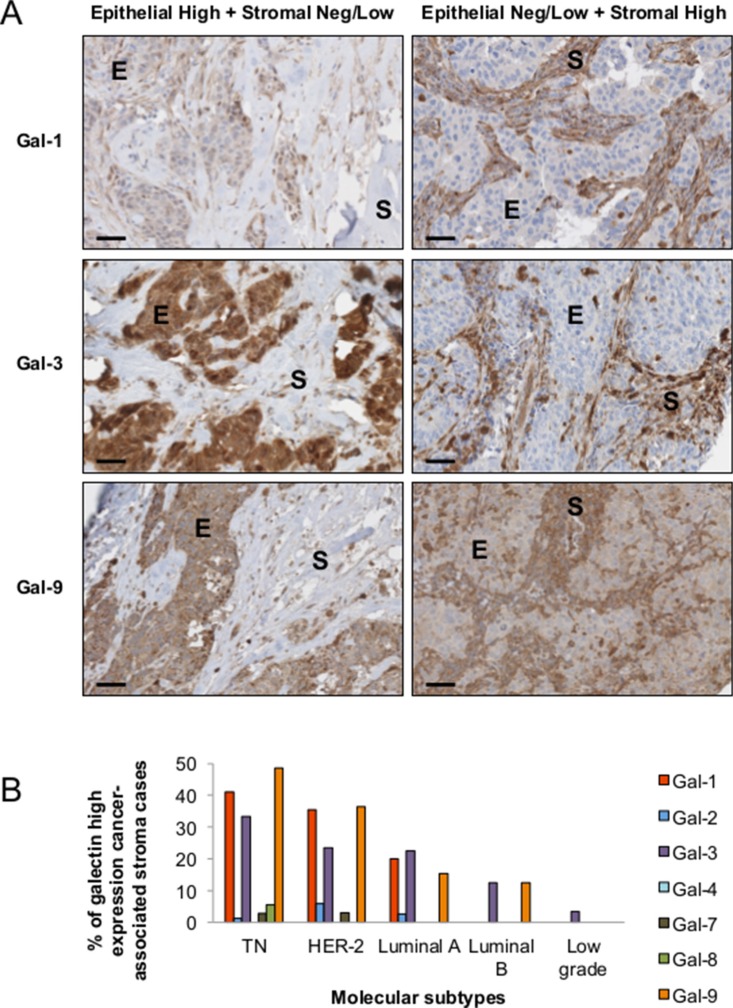
Figure 9. Stromal expression of galectins.
(A) Representative IHC staining of galectin-1, -3, and -9 expression in epithelial (E) and stromal (S) cells in breast cancer tissues. All scale bars, 50 μm. (B) Bar histograms showing the percentage of cases with high levels of expression of stromal galectin-1, -3, and 9 in molecular subtypes. (C) Correlation between galectin-1, -3, and -9 expression in breast cancer tissues measured across the molecular subtypes.

