

Abstract
We investigated the possibility of counting tumor deposits (TDs) as positive lymph nodes (pLNs) in the pN category and evaluated its prognostic value for colorectal cancer (CRC) patients. A new pN category (npN category) was calculated using the numbers of pLNs plus TDs. The npN category included 4 tiers: npN1a (1 tumor node), npN1b (2-3 tumor nodes), npN2a (4-6 tumor nodes), and npN2b (≥7 tumor nodes). We identified 4,121 locally advanced CRC patients, including 717 (11.02%) cases with TDs. Univariate and multivariate analyses were performed to evaluate the disease-free and overall survival (DFS and OS) for npN and pN categories. Multivariate analysis showed that the npN and pN categories were both independent prognostic factors for DFS (HR 1.614, 95% CI 1.541 to 1.673; HR 1.604, 95% CI 1.533 to 1.679) and OS (HR 1.633, 95% CI 1.550 to 1.720; HR 1.470, 95% CI 1.410 to 1.532). However, the npN category was superior to the pN category by Harrell's C statistic. We conclude that it is thus feasible to consider TDs as positive lymph nodes in the pN category when evaluating the prognoses of CRC patients, and the npN category is potentially superior to the TNM (7th edition) pN category for predicting DFS and OS among advanced CRC patients.
Keywords: colorectal cancer, tumor deposits, lymph nodes
INTRODUCTION
The TNM staging system for colorectal cancer (CRC) has been changed several times on the basis of a small expert panel consensus. The 5th edition TNM (TNM5) classification was the first to evaluate tumor deposits (TDs) and proposed the 3-mm rule in 1997 [1, 2]. The next edition (TNM6) concerned the presence of TDs in mesorectal and pericolic fat with the primary tumor, and defined TDs as positive lymph nodes (pLNs) when they had the form and smooth contour of lymph nodes (LNs) while irregular TDs with venous invasion remained in the T category [3, 4]. Recently, the presence of TDs has been reported as an important prognostic factor [5-9].
TDs were again taken into account in the American Joint Committee on Cancer (AJCC) 7th edition TNM classification (TNM7) for CRC, and a new pN1c category was proposed which states that T1 and T2 lesions that lack regional positive lymph node(s) but have tumor deposit(s) will be classified in addition as pN1c. However, it is not consistent in that in pN1c is also an option for pT3/4a tumors in the CRC staging table [10]. Despite the fact that TNM7 states that the number of TDs should be counted according to this categorization strategy, it does not point out the association of the number of TDs with stage III. There are also no clear guidelines on how to classify TDs in patients with pLNs and TDs simultaneously. This potentially impacts the accuracy of the classification and evaluation of the prognosis of CRC patients.
Recently, there has been discussion of the feasibility of TDs being counted as positive lymph nodes in the TNM staging system for CRC. Belt EJ et al. [11] declared lymph node negative CRC (stage II) with TDs should be classified and treated as stage III. Song YX et al. [5] reported that the counting of TDs as pLNs in the TNM staging system is potentially superior to the classification in the TNM7 to assess prognosis and survival for CRC patients. However, both of these studies included small numbers of patients (870 and 513 cases, respectively). In addition, in TNM7 gastric cancer staging, pathologic assessment of the regional pLNs entails their removal and histologic examination to evaluate the total number of nodes and TDs without evidence of residual LN tissue that were considered as pLN [12]. Thus, it is necessary to provide more effective data to validate the feasibility of counting the number of TDs as pLNs in the TNM classification criteria.
Here, we collected large-scale and multicenter data consisting of 4,121 stage II and III CRC patients who received initial radical surgery in order to investigate whether TDs can be counted as metastatic LNs using the AJCC TNM7 staging system for stage III CRC by calculating and comparing the 5-year disease-free survival (DFS) and overall survival (OS).
RESULTS
A total of 4,456 patients with CRC experienced initial radical surgery. According to the exclusion criteria, 180 cases with pTis/T1 stage, 45 with simultaneous distant metastasis, and 110 with other reasons were excluded. Finally, 4,121 cases were included in this retrospective study.
Clinicopathological characteristics of patients
In total, we identified 17.4% (717/4,121) of patients with TDs. The male: female ratio was 1.33:1 (2,352/1,769). The median age was 58.0 ± 12.1 years (range: 14-87). Clinicopathological features are listed in Table 1. In pN category (7th), the percentages of pN0-2b were 50.2%, 12.9%, 13.1%, 6.8%, 9.1% and 7.8%, respectively (P < 0.0001). By contrast, the percentages of npN0-2b were 50.2%, 12.8%, 15.3%, 12.0% and 9.7%, respectively (P < 0.0001). TDs were associated with preoperative carcinoembryonic antigen (CEA) or carbohydrate antigen 19-9 (CA19-9) levels, pT or pN category, npN category, differentiation grade, pathological category, and histological type (all P < 0.05). Patients with and without TDs were similar with respect to gender, age, tumor location (colon vs. rectum), and tumor size (diameter) (all P > 0.05). Additionally, the rates of patients with or without TDs who received adjuvant therapy were 17.0% and 18.2% (P = 0.343).
Table 1. Association of TDs with clinical and pathological characteristics.
| Variable | All Patients (n = 4121) | Patients with TDs (n = 717) | X2 | P | ||
|---|---|---|---|---|---|---|
| No. | % | No. | % | |||
| Gender | ||||||
| Male | 2352 | 57.1 | 411 | 17.5 | 0.022 | 0.882 |
| Female | 1769 | 42.9 | 306 | 17.3 | ||
| Age, year | ||||||
| ≤60 | 2312 | 56.1 | 407 | 17.6 | 0.154 | 0.695 |
| >60 | 1809 | 43.9 | 310 | 17.1 | ||
| Tumor location | ||||||
| Colon | 1449 | 35.2 | 278 | 19.2 | 0.51 | 0.475 |
| Rectum | 2671 | 64.8 | 439 | 16.4 | ||
| Tumor size, diameter | ||||||
| ≤5.0 cm | 2866 | 69.5 | 508 | 17.7 | 0.68 | 0.410 |
| >5.0 cm | 1254 | 30.4 | 209 | 16.7 | ||
| Preoperative CEA levels | ||||||
| <5.0 ng/ml | 2479 | 60.2 | 360 | 14.5 | 39.429 | <0.0001 |
| ≥5.0 ng/ml | 1161 | 28.2 | 238 | 20.5 | ||
| Unknown | 481 | 11.7 | 119 | 24.7 | ||
| Preoperative CA199 levels | ||||||
| <29.0 u/ml | 2820 | 68.4 | 465 | 16.5 | 8.565 | 0.014 |
| ≥29.0 u/ml | 459 | 11.1 | 101 | 22 | ||
| Unknown | 842 | 20.4 | 151 | 17.9 | ||
| pT category (7th) | ||||||
| pT 2 | 128 | 3.1 | 4 | 3.1 | 66.154 | <0.0001 |
| pT 3 | 2851 | 69.2 | 323 | 11.3 | ||
| pT 4 | 2242 | 54.4 | 390 | 17.4 | ||
| pN category (7th) | ||||||
| pN 0 | 2070 | 50.2 | 0 | 0 | 61.773 | <0.0001 |
| pN 1a | 533 | 12.9 | 100 | 18.8 | ||
| pN 1b | 539 | 13.1 | 124 | 23 | ||
| pN 1c | 282 | 6.8 | 282 | 100 | ||
| pN 2a | 374 | 9.1 | 80 | 21.4 | ||
| pN 2b | 323 | 7.8 | 131 | 40.6 | ||
| npN category | ||||||
| npN 0 | 2070 | 50.2 | 0 | 0 | 128.185 | <0.0001 |
| npN 1a | 526 | 12.8 | 93 | 17.7 | ||
| npN 1b | 629 | 15.3 | 214 | 34 | ||
| npN 2a | 495 | 12 | 201 | 40.6 | ||
| npN 2b | 401 | 9.7 | 209 | 52.1 | ||
| Venous invasion | ||||||
| Yes | 268 | 6.5 | 87 | 32.5 | 70.306 | <0.0001 |
| No | 3853 | 93.5 | 630 | 16.4 | ||
| Lymphatic invasion | ||||||
| Yes | 26 | 0.6 | 12 | 46.2 | 11.528 | 0.001 |
| No | 4095 | 99.4 | 705 | 17.2 | ||
| Differentiation grade | ||||||
| Well | 452 | 11 | 43 | 9.5 | 90.633 | <0.0001 |
| Moderately | 3213 | 78 | 523 | 16.3 | ||
| Poorly | 456 | 11.1 | 146 | 32 | ||
| Pathological category | ||||||
| Papillary or tubular adenocarcinoma | 3856 | 93.6 | 660 | 17.1 | 8.991 | 0.003 |
| Mucinous adenocarcinoma | 220 | 5.3 | 38 | 17.3 | ||
| Signet ring cell cancer | 45 | 1.1 | 19 | 42.2 | ||
| Histological type | ||||||
| Protrude | 2733 | 66.3 | 477 | 17.5 | 17.184 | <0.0001 |
| Ulcer | 1151 | 27.9 | 177 | 15.4 | ||
| Infiltrative | 237 | 5.8 | 63 | 26.6 | ||
| Adjuvant therapy | ||||||
| Yes | 2796 | 67.8 | 476 | 17 | 0.899 | 0.343 |
| No | 1325 | 32.2 | 241 | 18.2 | ||
TDs resulted in stage migration
A total of 1,798 TDs were detected in 717 (17.4%) patients according to the 3-mm (TNM5) and contour (TNM6) rules. The mean TD diameter was 8.5 ± 3.2 mm (range: 3-24 mm). By changing the definition of TDs to being counted as positive LNs, stage migration was likely to happen. Not surprisingly, the presence of TDs was associated with advanced npN category as compared to pN category (Table 2). TDs also more often presented with higher pT category (Table 1). In Table 2, we list stage migrations resulting from changes in the definition of TDs. Upstaging occurred in 330 of 717 patients (46.0%) with TDs that were in the pN category.
Table 2. pN stage migration according to TDs counted as pLNs.
| pN Category | npN Category | Sum | |||
|---|---|---|---|---|---|
| npN1a | npN1b | npN2a | npN2b | ||
| pN1a | 433 | 74 | 18 | 8 | 533 |
| pN1b | 458 | 63 | 18 | 539 | |
| pN1c | 93 | 97 | 85 | 7 | 282 |
| pN2a | 329 | 45 | 374 | ||
| pN2b | 323 | 323 | |||
| Sum | 526 | 629 | 495 | 401 | 2051 |
npN as a prognostic factor for DFS and OS
During follow-up, a total of 1215 patients (29.5%) suffered failure including 351 (8.5%) with local recurrence (LR), 973 (23.6%) with distant metastasis (DM) and 109 (2.6%) with both LR and DM. The 5-year DFS and OS rates for all 4,121 patients were 69.5% and 75.2%. The clinical and pathological data including the number of LR, DM, and all failures are listed in Table 2. The 5-year DFS rates for npN0-2b were 83.6%, 72.4%, 65.6%, 45.7% and 26.0%, respectively (P < 0.0001). By contrast, the 5-year DFS rates for pN0-2b were 83.6%, 71.4%, 57.8%, 69.9%, 39.5%, and 25.8%, respectively (P < 0.0001). The 5-year OS for npN0-2b were 87.9%, 76.2%, 69.1%, 57.9% and 37.1%, respectively (P < 0.0001). Compared to the npN category, the 5-year OS for pN0-2b were 87.9%, 74.3%%, 64.8%, 75.2%,50.1%, and 32.9%, respectively (P < 0.0001).
Univariate analysis showed that the preoperative CEA or CA199 levels, pT, pN, npN, TDs, venous or lymphatic invasion, differentiation grade, pathological category and histological type were all correlated with DFS and OS (all P < 0.0001). Additionally, age and adjuvant chemotherapy were prognostic factors for OS but not DFS. The DFS and OS curves for both npN and pN are shown in Figure 1. Considering the fact that the npN category can be considered as an adjusted classification of the pN category, making the pN and npN categories highly correlated, multivariate models for all patients were calculated separately for each variable to avoid potential bias (Tables 4, 5). As the result, both the npN and pN categories were identified as independent prognostic factors for DFS (HR 1.614, 95% CI 1.541 to 1.673; HR 1.604, 95% CI 1.533 to 1.679) and OS (HR 1.633, 95% CI 1.550 to 1.720; HR 1.470, 95% CI 1.410 to 1.532) by multivariate analyses (all P < 0.0001).
Figure 1. The DFS and OS curves for npN and pN categories.
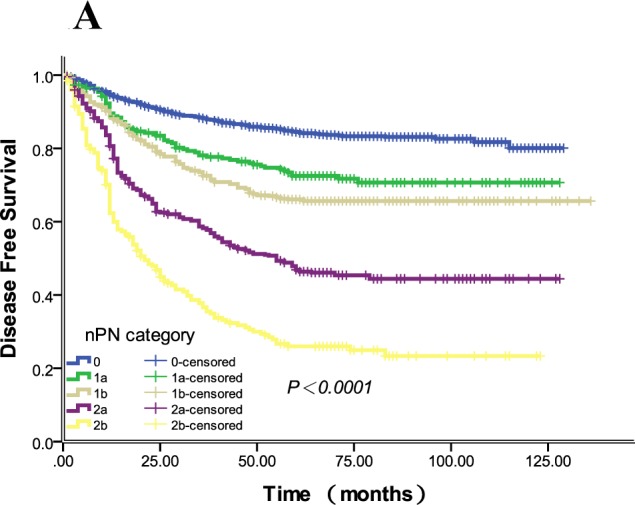
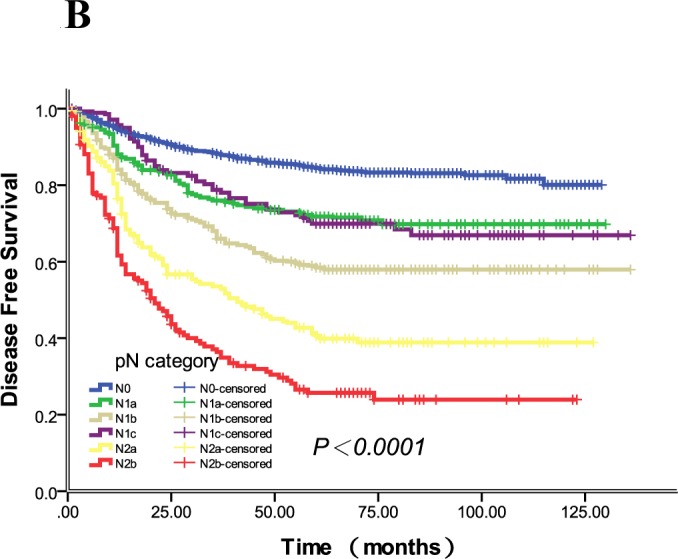
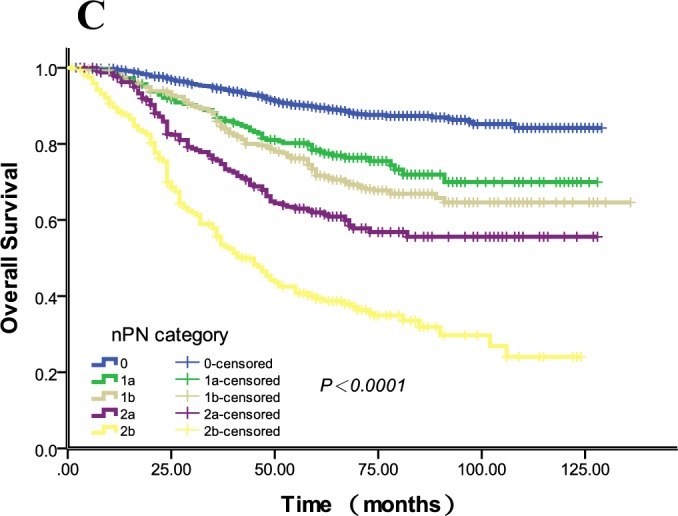
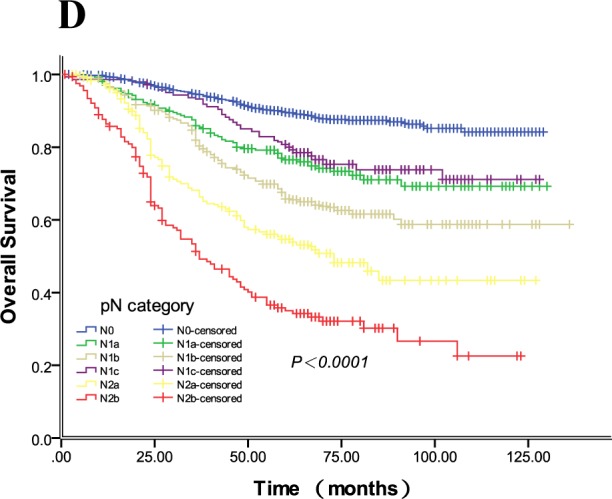
1A. The 5-year DFS rates of npN0-2b were 83.6%, 72.4%, 65.6%, 45.7%, 26.0%,respectively (P < 0.0001), and the 5-year DFS rates of each group from npN 0 to 2b were different (all P < 0.05). 1B. The 5-year DFS rates of pN0-2b were 83.6%, 71.4%, 57.8%, 69.9%, 39.5%, and 25.8%, respectively (P < 0.0001). pN1a and 1c had similar 5-year DFS rates (P = 0.862). 1C. The 5-year OS rates of npN0-2b were 87.9%, 76.2%, 69.1%, 57.9% and 37.1%, respectively (P < 0.0001), and the 5-year DFS rates of each group from npN 0 to 2b were different (all P < 0.05). 1D. The 5-year OS rates of pN0-2b were 87.9%, 74.3%, 64.8%, 75.2%, 50.1% and 32.9%, respectively (P < 0.0001), and the 5-year DFS rates of each group from pN 0 to 2b were different (all P < 0.05). Of note, pN1c had a similar 5-year OS rate with pN1a (P = 0.303).
Table 4. Multivariate analysis for 5-year DFS and OS when npN category enrolled.
| Variables | 5-Year DFS | 5-Year OS | ||||
|---|---|---|---|---|---|---|
| HR | 95.0% CI | P | HR | 95.0% CI | P | |
| Age | — | — | — | 1.371 | (1.181 to 1.592) | <0.0001 |
| Preoperative CEA | 0.901 | (0.792 to 1.024) | 0.111 | 0.970 | (0.837 to 1.123) | 0.683 |
| PreoperativeCA199 | 0.987 | (0.844 to 1.154) | 0.867 | 0.843 | (0.711 to 0.994) | 0.041 |
| pT category | 1.461 | (1.280 to 1.668) | <0.0001 | 1.533 | (1.312 to 1.791) | <0.0001 |
| pN category | 1.367 | (1.313 to 1.422) | <0.0001 | 1.462 | (1.398 to 1.529) | <0.0001 |
| TDs | 0.591 | (0.509 to 0.687) | <0.0001 | 1.103 | (1.039 to 1.200) | 0.036 |
| Venous invasion | 0.729 | (0.594 to 0.895) | 0.003 | 0.816 | (0.648to 1.027) | 0.083 |
| Lymphatic invasion | 0.455 | (0.276 to 0.750) | 0.002 | 0.555 | (0.323 to 0.954) | 0.033 |
| Differentiation grade | 1.387 | (1.209 to 1.591) | <0.0001 | 1.425 | (1.222 to 1.663) | <0.0001 |
| Pathological category | 1.112 | (1.006 to 1.229) | 0.037 | 1.160 | (1.036 to 1.298) | 0.010 |
| Histological type | 0.924 | (0.774 to 1.103) | 0.381 | 1.131 | (0.940 to 1.361) | 0.193 |
| Adjuvant Chemotherapy | — | — | — | 1.660 | (1.413 to 1.950) | <0.0001 |
Table 5. Multivariate analysis for 5-year DFS and OS when pN category enrolled.
| Variables | 5-Year DFS | 5-Year OS | ||||
|---|---|---|---|---|---|---|
| HR | 95.0% CI | P | HR | 95.0% CI | P | |
| Age | — | — | — | 1.346 | (1.160 to 1.563) | <0.0001 |
| Preoperative CEA | 0.901 | (0.793 to 1.023) | 0.108 | 0.950 | (0.822 to 1.099) | 0.493 |
| Preoperative CA199 | 0.976 | (0.837 to 1.138) | 0.755 | 0.839 | (0.709 to 0.993) | 0.041 |
| pT category | 1.448 | (1.270 to 1.651) | 0.000 | 1.517 | (1.300 to 1.769) | <0.0001 |
| npN category | 1.519 | (1.444 to 1.598) | <0.0001 | 1.653 | (1.560 to 1.752) | <0.0001 |
| TDs | 0.665 | (0.570 to 0.775) | <0.0001 | 1.108 | (1.007 to 1.202) | 0.032 |
| Venous invasion | 0.730 | (0.595 to 0.897) | 0.003 | 0.791 | (0.629 to 0.995) | 0.045 |
| Lymphatic invasion | 0.466 | (0.283 to 0.769) | 0.003 | 0.534 | (0.311 to 0.917) | 0.023 |
| Differentiation grade | 1.333 | (1.163 to 1.529) | <0.0001 | 1.384 | (1.187 to 1.613) | <0.0001 |
| Pathological category | 1.094 | (0.989 to 1.210) | 0.082 | 1.140 | (1.108 to 1.277) | 0.023 |
| Histological type | 0.936 | (0.784 to 1.117) | 0.463 | 1.139 | (0.947 to 1.371) | 0.168 |
| Adjuvant Chemotherapy | — | — | — | 1.747 | (1.488 to 2.052) | <0.0001 |
Table 3. Influence of different clinical and pathological factors on 5-year DFS and OS.
| Variable | No. of All patients | Local Recurrence | Distant Metastasis | All Failure | 5-Years DFS Rate | P | 5-Year OS Rate | P | |||
|---|---|---|---|---|---|---|---|---|---|---|---|
| No. | % | No. | % | No. | % | ||||||
| 4121 | 351 | 8.5% | 973 | 23.6% | 1215 | 29.5% | 69.5% | 75.2% | |||
| Gender | |||||||||||
| Male | 2352 | 219 | 9.3% | 553 | 23.5% | 713 | 30.3% | 68.7% | 0.081 | 74.9% | 0.762 |
| Female | 1769 | 132 | 7.5% | 420 | 24.7% | 502 | 29.4% | 70.6% | 75.5% | ||
| Age, year | |||||||||||
| ≤60 | 2312 | 173 | 7.5% | 535 | 24.1% | 652 | 29.2% | 71.5% | 0.087 | 78.0% | <0.0001 |
| >60 | 1809 | 178 | 9.8% | 438 | 24.2% | 563 | 31.1% | 66.9% | 71.5% | ||
| Tumor location | |||||||||||
| Colon | 1449 | 34 | 2.3% | 364 | 25.1% | 381 | 26.3% | 73.2% | 0.065 | 76.1% | 0.132 |
| Rectum | 2671 | 317 | 11.9% | 609 | 22.8% | 834 | 31.2% | 67.4% | 74.7% | ||
| Tumor size, diameter | |||||||||||
| ≤5.0 cm | 2866 | 240 | 8.4% | 670 | 23.4% | 835 | 29.1% | 70.1% | 0.654 | 75.8% | 0.251 |
| >5.0 cm | 1254 | 111 | 8.9% | 303 | 24.1% | 380 | 30.3% | 68.2% | 73.9% | ||
| Preoperative CEA levels | |||||||||||
| <5.0 ng/ml | 2479 | 98 | 8.4% | 463 | 18.7% | 610 | 24.6% | 75.0% | <0.0001 | 80.7% | <0.0001 |
| ≥5.0 ng/ml | 1161 | 198 | 8.0% | 401 | 34.5% | 454 | 39.1% | 58.6% | 64.3% | ||
| Unknown | 481 | 55 | 11.4% | 109 | 22.7% | 151 | 31.4% | 67.0% | 72.0% | ||
| Preoperative CA199 levels | |||||||||||
| <29.0 u/ml | 2820 | 32 | 7.0% | 490 | 20.8% | 601 | 26.5% | 73.1% | <0.0001 | 81.3% | <0.0001 |
| ≥29.0 u/ml | 459 | 169 | 7.2% | 179 | 39.0% | 195 | 42.5% | 54.9% | 54.5% | ||
| Unknown | 842 | 55 | 6.5% | 109 | 12.9% | 151 | 17.9% | 80.2% | 72.0% | ||
| pT category (7th) | |||||||||||
| pT 2 | 128 | 8 | 6.2% | 20 | 15.6% | 26 | 20.3% | 78.5% | <0.0001 | 82.8% | <0.0001 |
| pT 3 | 2851 | 141 | 8.1% | 253 | 14.4% | 353 | 20.2% | 79.2% | 83.4% | ||
| pT 4 | 2242 | 202 | 9.0% | 700 | 31.2% | 836 | 37.3% | 61.3% | 68.1% | ||
| pN category (7th) | |||||||||||
| pN 0 | 2070 | 106 | 5.1% | 252 | 12.2% | 332 | 16.0% | 83.6% | <0.0001 | 87.9% | <0.0001 |
| pN 1a | 533 | 39 | 7.3% | 121 | 22.7% | 149 | 28.0% | 71.4% | 74.3% | ||
| pN 1b | 539 | 43 | 8.0% | 187 | 34.7% | 215 | 39.1% | 57.8% | 64.8% | ||
| pN 1c | 282 | 42 | 14.9% | 47 | 16.7% | 87 | 30.9% | 69.9% | 75.2% | ||
| pN 2a | 374 | 56 | 15.0% | 171 | 45.7% | 207 | 55.3% | 39.5% | 50.1% | ||
| pN 2b | 323 | 65 | 20.1% | 195 | 40.6% | 225 | 69.7% | 25.8% | 32.9% | ||
| npN category | |||||||||||
| npN 0 | 2070 | 106 | 5.1% | 252 | 12.2% | 332 | 16.0% | 83.6% | <0.0001 | 87.9% | <0.0001 |
| npN 1a | 526 | 32 | 6.1% | 116 | 22.1% | 141 | 26.8% | 72.4% | 76.2% | ||
| npN 1b | 629 | 51 | 8.1% | 179 | 28.5% | 207 | 22.9% | 65.6% | 69.1% | ||
| npN 2a | 495 | 72 | 14.5% | 198 | 40.0% | 252 | 50.9% | 45.7% | 57.9% | ||
| npN 2b | 401 | 90 | 22.4% | 228 | 56.9% | 283 | 60.6% | 26.0% | 37.1% | ||
| Tumor deposits (TDs) | |||||||||||
| Positive | 717 | 131 | 18.3% | 281 | 39.2% | 389 | 54.3% | 44.6% | <0.0001 | 57.7% | <0.0001 |
| Negative | 3404 | 220 | 6.5% | 692 | 20.3% | 826 | 24.3% | 74.9% | 78.9% | ||
| Venous invasion | |||||||||||
| Yes | 268 | 47 | 17.5% | 136 | 50.7% | 157 | 58.6% | 36.8% | <0.0001 | 45.7% | <0.0001 |
| No | 3853 | 304 | 7.9% | 837 | 21.7% | 1058 | 27.5% | 71.7% | 77.1% | ||
| Lymphatic invasion | |||||||||||
| Yes | 26 | 8 | 30.8% | 10 | 38.5% | 16 | 61.5% | 29.2% | <0.0001 | 35.6% | <0.0001 |
| No | 4095 | 343 | 9.4% | 963 | 23.5% | 1199 | 29.3% | 69.8% | 75.4% | ||
| Differentiation grade | |||||||||||
| Well | 452 | 22 | 4.9% | 54 | 11.9% | 73 | 16.2% | 82.7% | <0.0001 | 88.2% | <0.0001 |
| Moderately | 3213 | 275 | 8.6% | 725 | 22.6% | 922 | 28.7% | 70.4% | 75.8% | ||
| Poorly | 456 | 54 | 11.8% | 194 | 42.5% | 220 | 48.2% | 50.0% | 57.8% | ||
| Pathological category | |||||||||||
| Papillary or tubular adenocarcinoma | 3856 | 325 | 8.4% | 888 | 23.0% | 1121 | 29.1% | 69.9% | <0.0001 | 75.9% | <0.0001 |
| Mucinous adenocarcinoma | 220 | 20 | 9.1% | 63 | 28.6% | 68 | 30.9% | 68.2% | 70.1% | ||
| Signet ring cell cancer | 45 | 6 | 13.7% | 22 | 49.9% | 26 | 57.8% | 40.8% | 41.5% | ||
| Histological type | |||||||||||
| Protrude | 2733 | 230 | 8.4% | 561 | 20.5% | 722 | 26.4% | 73.0% | <0.0001 | 78.5% | <0.0001 |
| Ulcer | 1151 | 98 | 8.5% | 322 | 28.0% | 386 | 33.5% | 64.8% | 70.1% | ||
| Infiltrative | 237 | 23 | 9.7% | 90 | 38.0% | 107 | 45.1% | 52.1% | 61.2% | ||
| Adjuvant therapy | |||||||||||
| Yes | 2796 | 228 | 8.2% | 672 | 24.0% | 825 | 29.5% | 70.1% | 0.361 | 76.7% | 0.002 |
| No | 1325 | 123 | 9.3% | 301 | 22.7% | 390 | 29.4% | 68.2% | 71.8% | ||
The pN and npN categories were calculated by Harrell's C statistic to identify which one had superior predictive capacity. The npN category (Harrell's C = 0.716, 95% CI: 0.709 to 0.728) was found to be superior to the pN category (Harrell's C = 0.707, 95% CI: 0.695 to 0.718) for DFS. Also, the npN category was a more accurate predictor than pN category for OS (Harrell's C = 719, 95% CI: 0.700 to 0.736; 712, 95% CI: 0.696 to 0.731, respectively). To identify whether one TD and one pLN had the same weight in patient outcome, we compared the 5-year DFS and OS rates for patients with pure pLNs with patients with pLNs plus TDs. The results are shown in Table 6 and indicate no prognostic heterogeneity meaning that TDs had the same weight as the pLNs (all P < 0.05).
Table 6. Influence of TDs on 5-year DFS and OS in subgroups of npN category.
| npN Category | No. of All Patients | All Failure with TDs | All Failure without TDs | 5-Years DFS Rate | 5-Years OS Rate | ||
|---|---|---|---|---|---|---|---|
| No. | % | No. | % | ||||
| npN 1a | 526 | 27 | 29.00% | 114 | 26.30% | 72.1% vs.73.6% | 76.0% vs.76.2% |
| npN 1b | 629 | 73 | 34.10% | 134 | 32.30% | 65.4% vs.65.7% | 68.9% vs.69.9% |
| npN 2a | 495 | 107 | 53.20% | 145 | 49.30% | 44.8% vs.46.3% | 57.3% vs.58.5% |
| npN 2b | 401 | 150 | 71.80% | 133 | 69.30% | 25.4% vs.27.6% | 36.8% vs.37.5% |
Note: the 5-year DFS rates of the subgroups with or without TDs in npN1a, 1b, 2a, 2b were similar (all P < 0.05), and the 5-year OS rates of the subgroups had the similar results (all P < 0.05).
DISCUSSION
Changes in definitions of what should be considered as positive lymph nodes (pLNs) and tumor deposits (TDs) have been causing great confusion and having a large impact on patient prognosis and selection for postoperative chemoradiotherapy. Although tumor deposits are defined as focal aggregates of adenocarcinoma located in the pericolic or perirectal fat discontinuous with the primary tumor and unassociated with a lymph node, it is difficult to distinguish TDs and nodes. Thus, TNM5 proposed the 3-mm rule, which defined a tumor nodule > 3mm in diameter without histological evidence of residual lymph node tissue as a TD [1]. However, this rule was reported as being based on unpublished data, which were not substantiated. In TNM6, the new definition of TDs based on contour replaced the 3-mm rule, and defined TDs to be classified as pLNs when they had the form and smooth contour of lymph nodes, while irregular TDs were classified in the pT category and as venous invasion [3]. Still, this contour rule lacks support from clinical evidences and reproducibility is poor because of the absence of appropriate guidelines [8].
Currently, the TNM7 proposed a novel pN category (pN1c) in stage III in the absence of lymph node (LN) metastasis which states T1 and T2 lesions that lack regional positive lymph node(s) but have tumor deposit(s) be classified in addition as pN1c, though it is not consistent in that in pN1c is also an option for pT3/4a tumors in the CRC staging table [10]. However, this new edition does not propose guidelines on the definition of TDs, which might impact reproducibility because of subjective opinion from pathologists. Although the TNM staging system changed several times with lack of appropriate guidelines, it is still the most important determinant of prognosis in CRC and it is the basis for the patient management guidelines that influence most patient management decisions [5].
The prevalence of TDs ranges from 6% to 64% in CRC and 17% to 55% in colon cancer [13]. The TNM7 abandoned the 3-mm rule and retained the contour rule so that classification of TDs is left to the discretion of the pathologists and pN1c is designated for TDs. However, when we investigated the use of the new definition for TDs, we found that all studies selected TDs depending, in part, on the definition. In other words, TDs selection is still lacking in guidelines. Still, it is difficult to distinguish pLNs and TDs especially when nodes are replaced completely by tumor cells. In fact, the TNM7 gastric cancer staging system has considered TDs as metastatic lymph nodes and the number of TDs was included for pathologic staging [12]. Additionally, TDs were considered as pLNs in Japanese classification of CRC [14]. Song YX et al [5] declared that tumor deposits can be counted as metastatic lymph nodes in TNM staging system for CRC. Based on the above evidence, we attempted to consider all TDs as pLNs and re-designate the pN category.
In the present study, we considered all TDs as pLNs and the npN category was determined by the number of pLNs plus TDs. By using the npN category, we simplified the node category and investigated the feasibility and effects. The 5-year DFS and OS rates of patients with or without TDs were 44.6% vs. 74.9% and 57.7% vs. 78.9% (P < 0.0001, respectively), which indicatapproved that patients with TDs had a worse DFS and OS compared with patients without TDs. This result was similar with to a previous study [8]. By using univariateble and multivariateble analyses, we concluded that TDs could be potentially an independent and adverse prognostic factor for colorectal cancer. Of note, in multivariable analysis, we found that both the npN and pN category were independent predictors for long-term outcome, including DFS and OS in CRC. And then we declared that, however, the npN category was superior to the pN category for DFS (Harrell's C = 0.716, 95% CI: 0.709 to 0.728 vs. 0.707, 95% CI: 0.695 to 0.718) and OS (Harrell's C = 719, 95% CI: 0.700 to 0.736 vs. 0.712, 95% CI: 0.696 to 0.731). Thus, we proposed that the TDs can be counted as pLNs in TNM staging system and the npN category is feasible and superior to the pN category for predicting the long-term outcomes in CRC.
The origins of TDs remain controversial. Some studies propose that 3 types of TDs can be identified. They define TDs as “vascular invasion type,” “TDs other than the vascular invasion type,” and “tumor deposits, extramural venous and perineural types of invasion” [15, 16]. Recent studies have declared strong correlations between the presence of TDs and vascular invasion [7, 17, 18]. However, in the present study, we did not differentiate between types of TDs and reported that 32.5% (87/268) of the TDs was with venous invasion, which was lower than previous studies. Besides, 46.2% (12/26) of the patients with TDs also had lymphatic invasion. In our study, we differentiated venous invasion from lymphatic invasion by hematoxylin-eosin (H-E) staining, which may reduce the accuracy of recognizing venous and lymphatic invasion. In fact, many other factors such as the histological sectioning, which is only a 2-demensional sample of the 3-demensional structure, could cause us to underestimate the association of TDs with vessels.
Whether or not TDs should be considered pLNs or satellite tumor nodules for the purposes of staging may be difficult to determine. It is thus necessary and reasonable to consider TDs as pLNs. Using the npN category, pathologists and clinicians can simplify the TNM staging system and make suitable suggestions for patient postoperative treatment.
The results from this study are constrained by all the flaws and biases inherent to a nonrandomized trial, although this study included large-scale and multicenter data. Additionally, there are no clear and regular guidelines on how to identify the TDs from lymph nodes, which also may potentially influence the conclusions. The ideal trial design to investigate TDs according to sections of whole specimens would be a prospective clinical trial, which may be helpful to get more reliable data.
In sum, we found that it was feasible to consider TDs as positive lymph nodes in the pN category for evaluating the prognoses of CRC patients, and the npN category was potentially superior to the 7th pN category for predicting the disease-free and overall survival of advanced CRC patients. Whether the npN category has any additional significant practical impact on patients management needs more data to validate.
PATIENTS AND METHODS
Ethics considerations
Ethical approval was obtained from the appropriate ethics committees of all participating study sites before the enrolment of patients started. Informed consent was obtained by the investigator at each center from all patients before patient enrollment.
Patients
A total of 4,121 patients with stage II and III colorectal adenocarcinoma who received an initial radical surgery were identified at seven study centers in China between January 2004 and December 2011, and all relevant data were retrospectively collected including age, gender, serum CEA and CA199 levels, date of surgery, location of the primary tumor (colon and rectal), date and site of recurrence, pathological result, adjuvant chemoradiotherapy and cause of death (CRC related or other cause). We defined colon cancer including tumors locating in cecum to sigmoid colon, and rectal cancer containing tumors locating in rectum or rectosigmoid junction according to the definition from Chok KS et al. [19].
The exclusion criteria were as follows: 1) patients who received neoadjuvant chemoradiotherapy (NCRT, resulting in less nodes detection in specimens); 2) patients with distant metastasis such as liver metastasis found pre- or perioperatively; 3) patients with multiple adenocarcinomas of colon and rectum; 4) patients with synchronous or metachronous tumors; 5) patients who had suffered from colorectal cancer before; 6) patients who died in the immediate postoperative period (within 1 month); 7) patients with positive circumferential resection margins; and 8) patients without complete pathological slides.
Treatments
All patients initially received R0 resection without preoperative radiotherapy and/or chemotherapy. For rectal cancer patients, the standard total mesorectal excision was performed. After surgery, patients were treated with radiotherapy and/or chemotherapy or not according to body situation and TNM staging system except some patients who rejected adjuvant therapy. Patients with rectal cancer received adjuvant chemoradiotherapy (40-50Gy/2Gy/20-25F and Xeloda basically), while colon cancer patients were treated with Xeloda and 5-Fu regimens basically. 1325 patients did not received adjuvant therapy, including 83.1% (1101/1325) of patients who were in low risk, and other 16.9% (224/1325) who were in high risk (venous invasion, lymphatic invasion, poor differentiation, or advanced stage) but rejected adjuvant therapy (46.4%, 104/224), or were in poor body situation and could not tolerate adjuvant therapy (53.6%, 120/224).
Pathologic examination
Sections from all resected specimens were examined by local pathologists from seven hospitals. The standardized protocol included determination of the AJCC TNM classification, stage grouping, differentiation degree, histological type, pathological number of examined and involved lymph nodes, and presence or absence of lymphatic or venous invasion. All slides were reviewed for the presence of TDs, defined as either macroscopic or microscopic depositions of carcinoma, without any residual lymph node structures. TDs were assessed using the 3-mm (TNM5) and contour (TNM6) rules [7, 8]. For a regular tumor nodule, we classify it as a positive LN. For an irregular node without any residual tissues of LN we consider it as a TD if the diameter > 3mm measured by a ruler, otherwise, we consider the irregular node as pT3 if the diameter ≤3mm. The reference pathologist tested pathological sections and then recorded the findings in a standardized document.
Classification methods
All patients were classified depending on TNM7, and then we counted TDs as pLNs in a new pN category. In this study, the pN category which combined with the number of TDs was recorded as npN category [5].
Follow-up
The follow-up result was collected from all seven hospitals'database. The end point of follow-up was May 2015. The median time of follow-up was 66 months (range: 2-136 months).
Statistical analysis
Local recurrence and distant metastasis analyses were performed for all eligible patients who received R0 resection without distant metastasis found at time of surgery. All time-to-event end points were measured from date of radical surgery. Disease-free survival (DFS) and overall survival (OS) was calculated from radical resection to finding evidence of local recurrence and/or distant metastasis. Statistical analysis was performed using SPSS software (version 19). Differences were evaluated with the log-rank test. Analyses for local recurrence and distant metastasis were calculated as cumulative incidences. Mutivariate models were performed using the Cox proportional hazards model. All significant variables in the univariate analysis were included in multivariate Cox regression models in a forward-step procedure. The variables were entered in the order according to clinical relevance into the regression models with increasing complexity, and significance was assessed using analysis of variance analysis. The predictive power of the individual models was evaluated using Harrell'C statistic. A model with perfect predictive capacity (sensitivity and specificity of 100%) would have a Harrell'C statistic of 1.00 and the highest Harrell'C statistic was chosen as the best model [20]. A two-sided p value less than 0.05 was considered to be significant.
Footnotes
Authors' contributions
JL, SKY, JJH, and HL conceived of and designed the study. JL, SKY, HL, JJH, FD, JY, SL, CL, JF, SSL, XZ, BW, JTY and BL provided study materials or patients. JL, SSX, and SKY performed the analyses. JL, SL and FD prepared all figures and tables. JL, HL, SKY and JJH wrote the main manuscript. All authors reviewed the manuscript.
CONFLICTS OF INTEREST
None of the authors have any conflicts of interest to declare.
REFERENCES
- 1.Sobin LH, Wittekind C, editors. International Union Against Cancer TNM Classification of Malignant Tumours. 5. Hoboken, NJ: John Wiley & Sons; 1997. [Google Scholar]
- 2.Fleming ID, Cooper JS, Henson DE, editors. AJCC Cancer Staging Manual. 5. Philadelphia, PA: Lippincott Raven; 1998. [Google Scholar]
- 3.Sobin LH, Wittekind C, editors. International Union Against Cancer TNM Classification of Malignant Tumours. 6. Hoboken, NJ: John Wiley & Sons; 2002. [Google Scholar]
- 4.Greene FL, Page DL, Fleming ID, editors. AJCC Staging Handbook. 6. New York, NY: Springer; 2002. [Google Scholar]
- 5.Song YX, Gao P, Wang ZN, Liang JW, Sun Z, Wang MX, Dong YX, Wang XF, Xu HM. Can the tumor deposits be counted as metastatic lymph nodes in the UICC TNM staging system for colorectal cancer? PLoS One. 2012;7:e34087. doi: 10.1371/journal.pone.0034087. [DOI] [PMC free article] [PubMed] [Google Scholar]
- 6.Lin Q, Wei Y, Ren L, Zhong Y, Qin C, Zheng P, Xu P, Zhu D, Ji M, Xu J. Tumor deposit is a poor prognostic indicator in patients who underwent simultaneous resection for synchronous colorectal liver metastases. Onco Targets Ther. 2015;22:233–40. doi: 10.2147/OTT.S71414. [DOI] [PMC free article] [PubMed] [Google Scholar]
- 7.Nagtegaal ID, Tot T, Jayne DG, McShane P, Nihlberg A, Marshall HC, Pahlman L, Brown JM, Guillou PJ, Quirke P. Lymph nodes, tumor deposits, and TNM: are we getting better? J Clin Oncol. 2011;29:2487–92. doi: 10.1200/JCO.2011.34.6429. [DOI] [PubMed] [Google Scholar]
- 8.Nagtegaal ID, Quirke P. Colorectal tumour deposits in the mesorectum and pericolon: a critical review. Histopathology. 2007;51:141–9. doi: 10.1111/j.1365-2559.2007.02720.x. [DOI] [PubMed] [Google Scholar]
- 9.Tateishi S, Arima S, Futami K, Kawahara K, Tachikawa D, Naritomi K, Iwashita A. A clinicopathological investigation of “tumor nodules” in colorectal cancer. Surg Today. 2005;35:377–84. doi: 10.1007/s00595-004-2950-y. [DOI] [PubMed] [Google Scholar]
- 10.Sobin LH, Gospodarowicz MK, Wittekind C. TNM classification of malignant tumours. (7) 2010 [Google Scholar]
- 11.Belt EJ, van Stijn MF, Bril H, de Lange-de Klerk ES, Meijer GA, Meijer S, Stockmann HB. Lymph node negative colorectal cancers with isolated tumor deposits should be classified and treated as stage III. Ann Surg Oncol. 2010;17:3203–11. doi: 10.1245/s10434-010-1152-7. [DOI] [PMC free article] [PubMed] [Google Scholar]
- 12.Edge SB, Byrd DR, Compton CC, Fritz AG, Greene FL, editors. AJCC cancer staging handbook. 7. New York: Springer; 2010. p. 149. [Google Scholar]
- 13.Ono C, Yoshinaga K, Enomoto M, Sugihara K. Discontinuous rectal cancer spread in the mesorectum and the optimal distal clearance margin in situ. Dis Colon Rectum. 2002;45:744–749. doi: 10.1007/s10350-004-6290-1. [DOI] [PubMed] [Google Scholar]
- 14.Japanese Society for Cancer of the Colon and Rectum: Japanese classification of Colorectal Carcinoma. First English. Kanehara & Co, LTD; Tokyo: 1997. [Google Scholar]
- 15.Sternberg A, Mizrahi A, Amar M, Groisman G. Detection of venous invasion in surgical specimens of colorectal carcinoma: the efficacy of various types of tissue blocks. J Clin Pathol. 2006;59:207–210. doi: 10.1136/jcp.2004.023333. [DOI] [PMC free article] [PubMed] [Google Scholar]
- 16.Ueno H, Mochizuki H, Hashiguchi Y, Ishiguro M, Miyoshi M, Kajiwara Y, Sato T, Shimazaki H, Hase K. Extramural cancer deposits without nodal structure in colorectal cancer: optimal categorization for prognostic staging. Am J Clin Pathol. 2007;127:287–294. doi: 10.1309/903UT10VQ3LC7B8L. [DOI] [PubMed] [Google Scholar]
- 17.Prabhudesai A, Arif S, Finlayson CJ, Kumar D. Impact of microscopic extranodal tumor deposits on the outcome of patients with rectal cancer. Dis Colon Rectum. 2003;46:1531–7. doi: 10.1007/s10350-004-6809-5. [DOI] [PubMed] [Google Scholar]
- 18.Ueno H, Mochizuki H, Tamakuma S. Prognostic significance of extranodal microscopic foci discontinuous with primary lesion in rectal cancer. Dis Colon Rectum. 1998;41:55–61. doi: 10.1007/BF02236896. [DOI] [PubMed] [Google Scholar]
- 19.Chok KS, Law WL. Prognostic factors affecting survival and recurrence of patients with pT1 and pT2 colorectal cancer. World J Surg. 2007;31:1485–90. doi: 10.1007/s00268-007-9089-0. [DOI] [PubMed] [Google Scholar]
- 20.Harrell FE, Jr, Lee KL, Mark DB. Multivariable prognostic models: issues in developing models, evaluating assumptions and adequacy, and measuring and reducing errors. Stat Med. 1996;15:361–387. doi: 10.1002/(SICI)1097-0258(19960229)15:4<361::AID-SIM168>3.0.CO;2-4. [DOI] [PubMed] [Google Scholar]