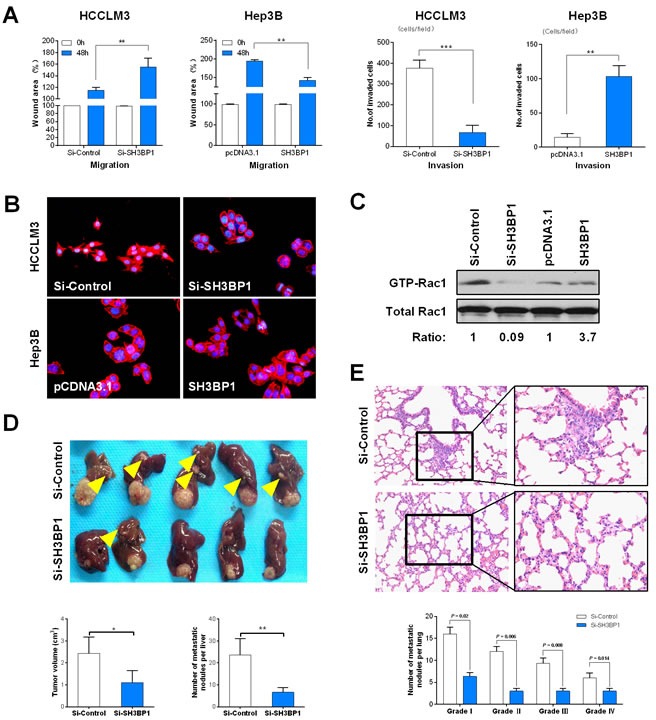
Figure 2. SH3BP1 promotes HCC cell invasion and metastasis in vivo and in vitro through Rac1-WAVE2 pathway activation.

A. Wound healing analysis showed a significant difference in the speed between the SH3BP1 knockdown (Si-SH3BP1-HCCLM3) and over expression SH3BP1 (SH3BP1-Hep3B) group cells compared with the negative control (left). Boyden chamber invasion analysis showed a significant difference lower number of invasive cells in Si-SH3BP1 HCCLM3 and Hep3B cells than HCCLM3 and SH3BP1 Hep3B cells (right). B. Cytoskeletal rearrangement events were decreased in SH3BP1-depleted HCCLM3 cells (top) and were increased in ectopically expressed SH3BP1 Hep3B cells (bottom). C. GTPase pull-down and immune-blot assays showing that endogenous SH3BP1 depletion in HCCLM3 cells corresponded to a decrease in the amount of GTP-bound activate Rac1, whereas the level of total Rac1 remained unchanged. Correspondingly, ectopic expression of SH3BP1 in Hep3B cells readily induced an increase in active GTP-Rac1 level without affecting the total Rac1 level. The relative signal of each band in the GTP-bound form of the pull-down experiments was normalized to the total amount detected in the whole-cell lysates and followed by normalization to the untreated control of the same cell lysate. D. The morphologic characteristics of tumor in Si-SH3BP1 and Si-Control groups (top). The comparison of tumor size and the number of intra-hepatic metastasis nodules between Si-SH3BP1 and Si-Control groups (bottom). F. The characteristics of lung metastases detected by H&E staining (top). Lung metastasis rates between Si-SH3BP1 and Si-Control groups are statistically different in each grade from I to IV (bottom).
