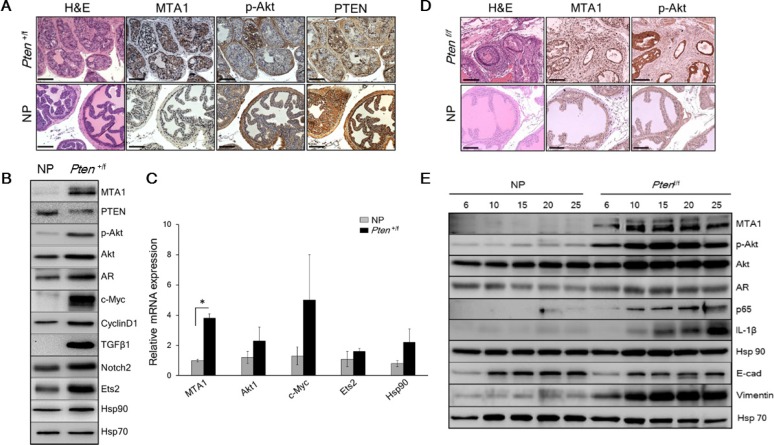
Figure 1. MTA1 promotes the Pten loss-driven prostate tumorigenesis and cancer progression.
(A) Comparison of H & E and IHC of MTA1, p-Akt and PTEN in the prostates from 10-month-old Pten+/f mice and Cre-negative normal prostate (NP) controls. Scale bars, 100 μm. (B) Immunoblots of MTA1, PTEN, p-Akt, Akt, AR, c-Myc, CyclinD1, TGFβ1, Notch2, Ets2, and Hsp90 and (C) qRT-PCR analysis of MTA1, Akt1, c-Myc, Ets2 and Hsp90 mRNA levels in the prostate tissues from 10-month-old Pten+/f mice compared to NP controls. (D) Comparison of H & E, MTA1, and p-Akt staining in the prostate tissues from 10-week-old Ptenf/f mice and NP controls. Scale bars, 100 μm. (E) Immunoblots of MTA1, p-Akt, Akt, AR, NF-κB (p65), IL-1β, Hsp90, E-cadherin (E-cad) and Vimentin in the prostate tissues from Ptenf/f mice compared to NP controls, isolated at the ages mentioned. Hsp70 was used as a loading control. qRT-PCR data represent the mean ± SEM (n = 3), *p < 0.05 (two-tailed, two-sample t-test).

