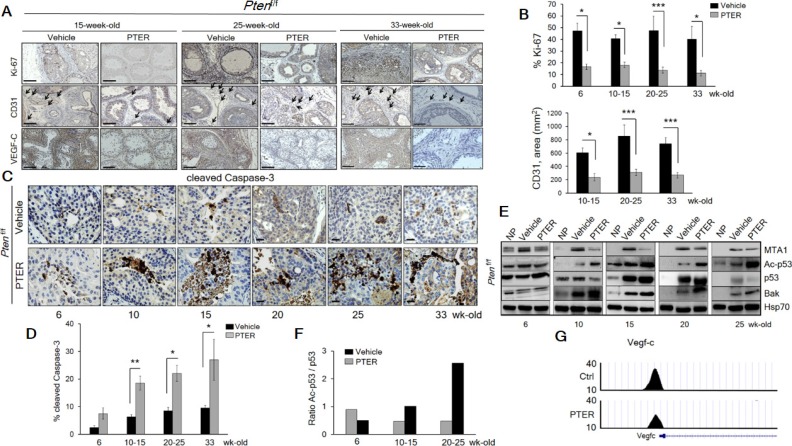
Figure 8. Pterostilbene significantly inhibits MTA1-dependent cell proliferation and angiogenesis and induces MTA1-targeted apoptosis in Ptenf/f mice.
(A) Representative Ki-67 (top, each panel), CD31 (middle, each panel) and VEGF-C (bottom, each panel) staining of the prostate tissues from Ptenf/f mice treated with vehicle and PTER, at indicated ages. Arrows indicate vessels. Scale bars, 100 μm. (B) Quantitation of Ki-67 (top) and CD31 (bottom) positive cells of prostate tissues from mice treated with vehicle and PTER (n = 5/group). (C) Representative images and (D) Quantitation of cleaved Caspase-3 staining at the indicated ages of vehicle and PTER treated Ptenf/f mice (n = 5/group). Scale bars, 10 μm. Data are mean ± SEM (n = 3), *p < 0.05; **p < 0.01; ***p < 0.001 (two-tailed, two-sample t-test). (E) Immunoblots of MTA1, Ac-p53, p53 and Bak in the prostate tissues from vehicle and PTER treated Ptenf/f mice, isolated at the indicated ages. NP, normal prostate. Hsp70 was used as loading controls from prostate tissues. (F) Densitometry of the Ac-p53/p53 ratio from the representative blot. (G) Comparative analysis of MTA1 binding in the prostate tissues of Pten+/f mice on Ctrl- and PTER-Diet. Representative MTA1 ChIP-Seq tracks for Vegf-c gene locus at 10 kb resolution are shown.

