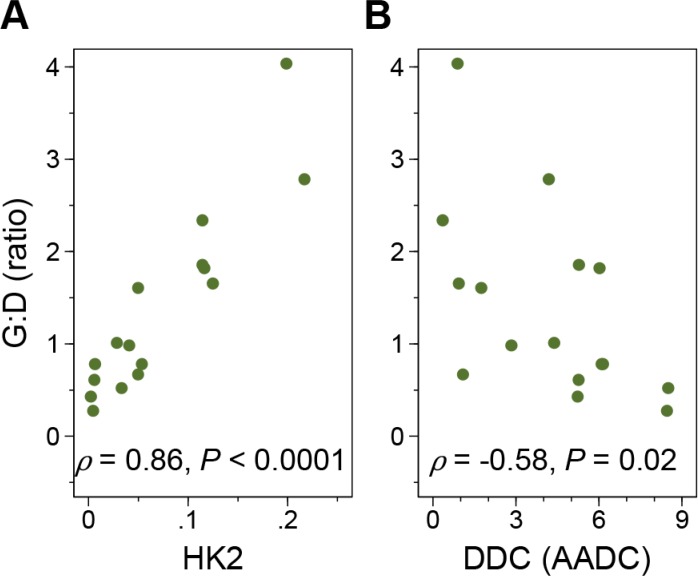
Figure 4. The FDG:FDOPA ratio of tumor uptake and gene expression.
G:D correlated positively with the hexokinase 2 (HK2) (A) and negatively with DOPA decarboxylase (DDC) (B) expression levels. The x axis represents the relative folds of target gene expression normalized to the geometric mean of HPRT1 and SDHA transcript levels serving as controls.

