Abstract
Quality of care in intensive care and surgery has benefited from establishing comparative standards. At present there is no accepted tool to compare outcomes for emergency admissions in internal medicine. The Simple Clinical Score (SCS) was used in 1,098 consecutive medical emergency admissions to adjust mortality for severity of illness. Hospital mortality adjusted for severity of illness and length of stay in the cohort was in keeping with mortality in the Irish derivation study with a trend towards lower mortality in the very high-risk group. Three parameters with poor reproducibility were identified. The SCS has several potential applications: identification of patients with low risk of death suitable for early hospital discharge; early identification of patients with a high risk of death, who will require care in critical care areas (or specialist palliative care); and benchmarking of acute medical departments internationally in a similar way to how APACHE II scoring has been used in critical care units worldwide.1
Key Words: benchmarking, emergency, internal medicine, length of stay, mortality
Background
The majority of inpatient workload in internal medicine throughout Europe is generated by emergency admissions. Variation in clinical practice affects mortality of patients and length of stay in hospital. Despite this there is no accepted model to benchmark different hospital departments with regards to mortality and use of financial resources. In contrast, intensive care units in the UK have worked for some time with models that allow comparing mortality rates for different units adjusted for the severity of illness of the admitted patients. The results are integrated with diagnostic information in order to derive the standardised mortality ratio (SMR).2–4 For surgical procedures statistical models are available that allow comparison of morbidity and mortality between different units.5 Comparison of mortality in cardiothoracic centres has led to improvements in the standard of care.6,7
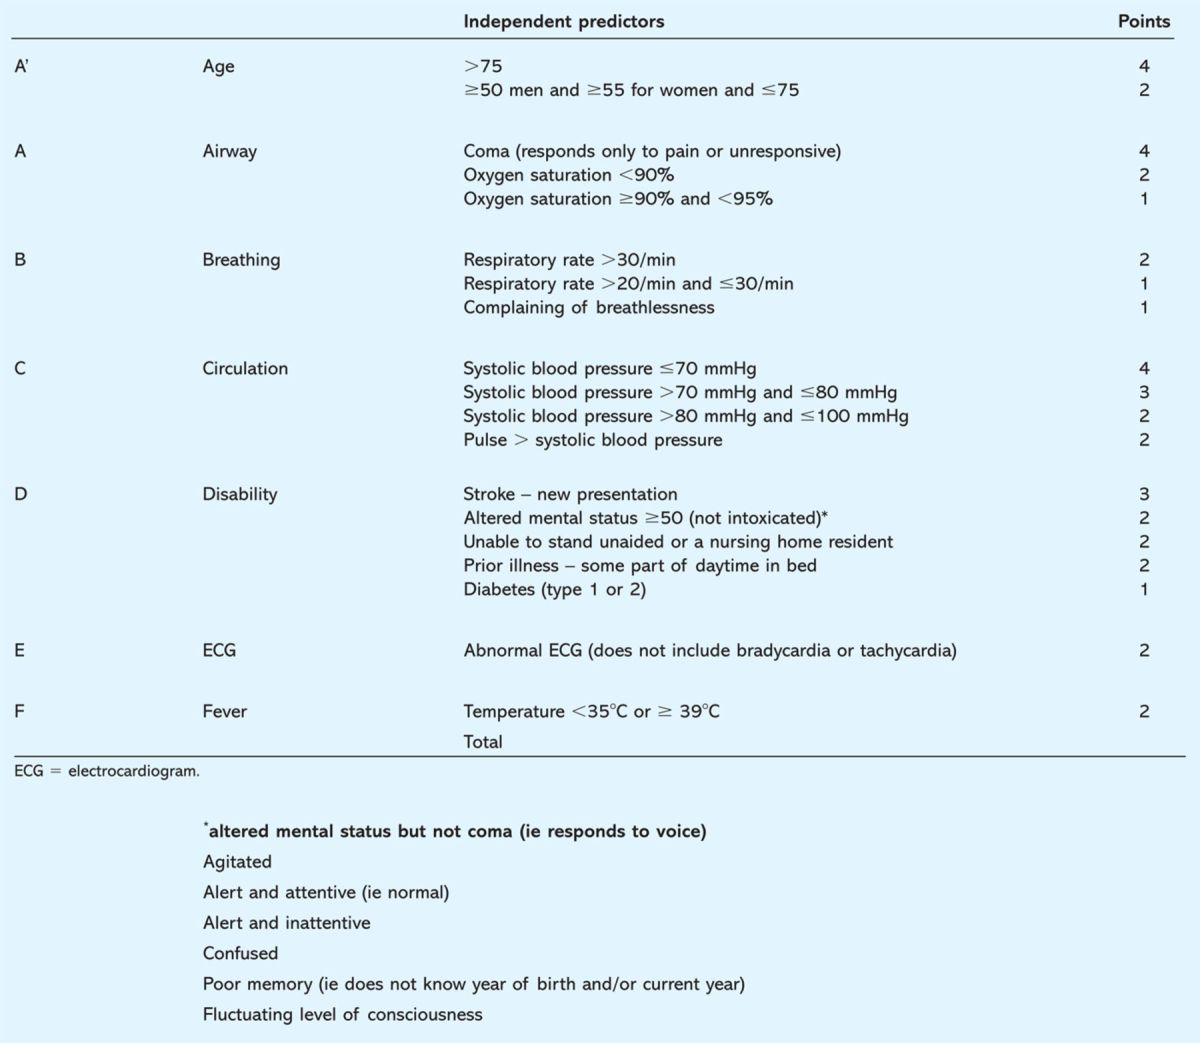
Earlier research showed how a simple scoring model, the Modified Early Warning Score (MEWS), was used to gauge the risk of patients for catastrophic deterioration.8 However, the proposed model lacked specificity to evaluate the risk of in-hospital death for individual patients. An improved model (Table 1), with superior sensitivity and specificity in estimating mortality at 30 days, has recently been tested in a district general hospital in Ireland.9
Table 1.
Scoring table for the Simple Clinical Score (SCS).9
Methods
Patients
Patients were recruited from the acute medical admissions unit of Wrexham Maelor Hospital (WMH), Wrexham, North Wales. The hospital serves a population of 250,000 in a mixed urban and rural area. All patients over the age of 16 admitted through the acute medical take between 15 June and 1 September 2007 and followed-up for a minimum of 30 days post-admission were included. Readmissions were excluded from statistical analysis.
Data collection
Data were restricted to information that was routinely collected during the admissions process. Demographic details, systolic blood pressure, pulse rate, temperature, respiratory rate and AVPU score (A for ‘alert’, V for ‘reacting to vocal stimuli’, P for ‘reacting to pain’, U for ‘unconscious’) were recorded on admission as part of an existing triage process. Blood pressure and pulse rate were measured electronically and checked manually where appropriate. Patients’ temperatures were taken orally. Oxygen saturations were measured on air or on oxygen depending on the clinical status of the patient. The respiratory rate was counted over a full minute. AVPU was scored according to best response at time of blood pressure measurement. A dedicated research nurse (MH) checked completeness of data.
Additional variables were collected by extraction from medical and nursing admission records: functional status (Zubrod score,10 ability to stand), clinical presentations (mental status, new stroke, intoxication, breathlessness), demographic or social features (sex, nursing home residency), additional risk factors (diabetes), electrocardiogram (ECG) findings and the shock index. ECGs were reviewed and reported by junior doctors in internal medicine. Two data collectors (AC, FB) tested reproducibility in a sample of 90 patients. They reviewed patients independently, collated the data and derived the SCS. Investigators were additionally asked to identify patients potentially suitable for early discharge (SCS 0–3) and those with a possible need for augmented care (SCS >8).
Outcome measures
The primary outcome measure was 30-day mortality; secondary outcome measure was mortality within 24 hours and within seven days from admission and length of hospital stay.
Statistical evaluation and power calculations
Data were evaluated with the help of GenStat® version 11 and SPSS version 15. SPSS was used to derive the SCS from raw data. Comparison between subgroups was made using the Student's t test with Levene's test for equality of variances and the Mann-Whitney U test. The sample size was chosen pragmatically to represent 10% of the annual intake of the department. The collected data were used to establish receiver operator characteristic curves.11
Ethics approval
Written guidance was obtained from the Central Office for Research Ethics Committees and the Local Ethics Research Committee who advised that the proposed work fulfils criteria that characterise it as service evaluation without the need to obtain a formal research ethics committee review.
Results
In total, 1,098 consecutive patients were included in the study. Mean age on admission was 65 years (standard deviation (SD) 19) and 594 (54%) patients were female. At six-month follow-up, 82 patients (7.5%) had died during their hospital stay. Of these, 15 died on the day of admission or the day after admission (1.3%), 34 died within seven days (3.1%) and 65 patients had died within 30 days (6.3%).
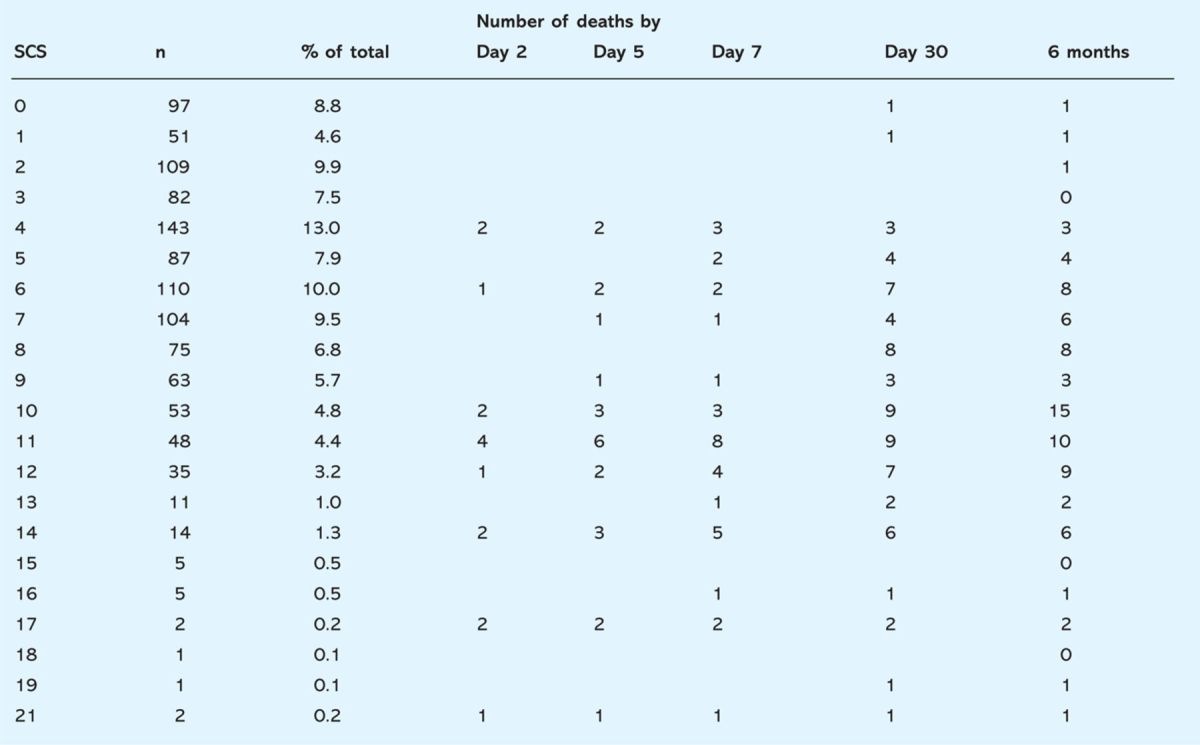
The median SCS was five (interquartile range (IQR) 3–8). The median length of stay was four days (IQR 1–11 days). Data collected on admission are shown in Table 2. The distribution of scores is summarised in Table 3.
Table 2.
Data collected on admission to hospital in all patients and in the subgroup of patients that died within 48 hours of admission and that died during their hospital stay. P value adjusted according to Levene's test for equality of variances.
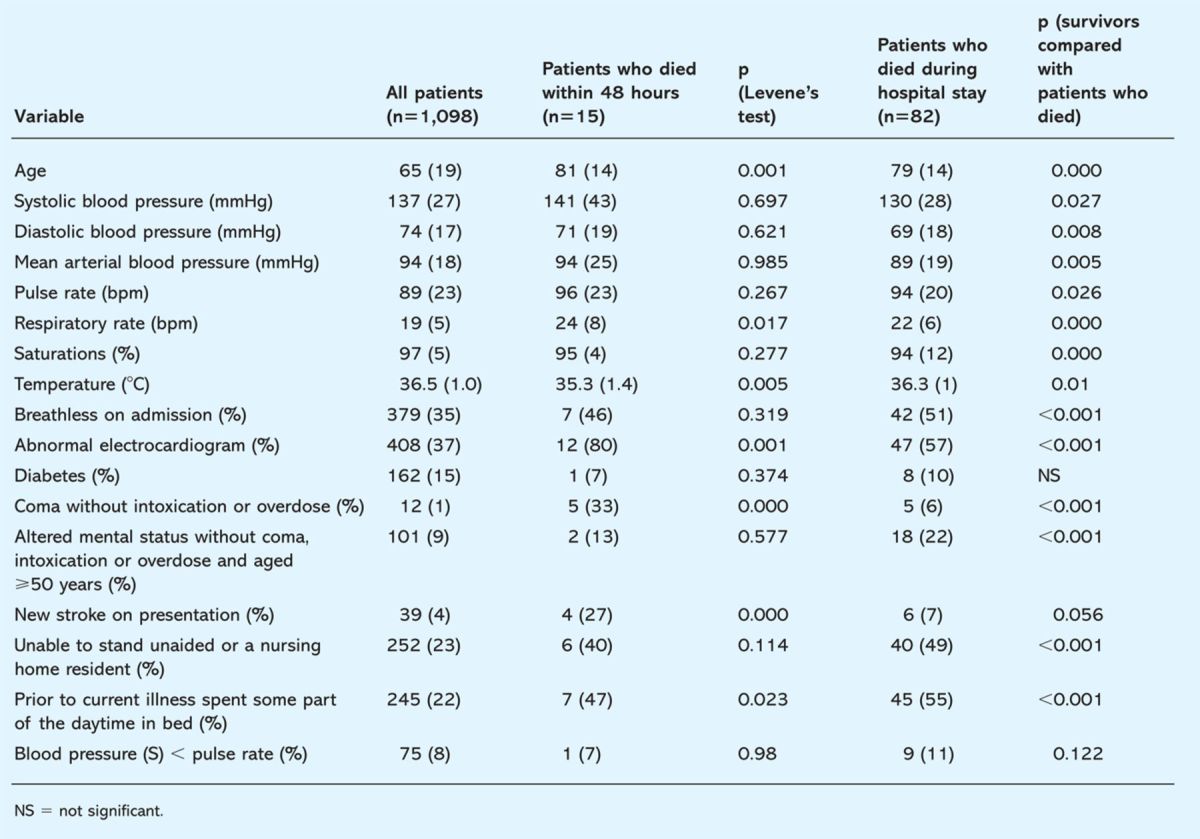
Table 3.
Frequency distribution of Simple Clinical Score (SCS) on admission and death during up to six months of in-hospital follow-up.
Parameters
Comparisons were made between bedside observations on admission in all patients and in those that died within 48 hours or that died during the course of the study. Age, high respiratory rate, low temperature, the presence of an abnormal ECG and coma were strong predictors of death within 48 hours. Abnormalities in nearly all parameters were associated with death in hospital with the exception of the presence of diabetes, a new stroke on admission and a heart rate higher then the systolic blood pressure.
Distribution of scores
The distribution of scores showed that 52% of patients admitted had a low or very low risk of catastrophic deterioration. No patients with very low scores died within the first week in hospital. While no diagnostic data were analysed this suggests death from chronic or hospital-acquired conditions as significant contributors to in-hospital death.
The SCS can be used to stratify patients into five groups with distinct risk profiles (Table 4). Mortality increased proportionally with rising SCS. In the very low risk group no patients died within the first week and even in the low risk and average risk group only 0.9% and 0.5% died within the first 48 hours of admission.
Table 4.
Mortality according to risk bands of the Simple Clinical Score (% of deaths per risk group). The majority of deaths in the very low risk and low risk groups occur late into the hospital stay.

Reproducibility
Applying the sign test to SCS there was no statistical difference between two observers (p=0.26). Observer 2 placed 19 patients at a higher SCS and seven patients in a lower SCS, in 64 patients (71%) there was no difference. There were statistically significant differences in the assessment of three variables (Wilcoxon signed-rank test): altered mental status (p<0.046), presence of an abnormal ECG (p<0.007) and functional capacity (p<0.005).
To test robustness of decision making based on the score the investigators were asked to document the score and resulting advice on placement of patients. In 91% of cases the investigators agreed on the identification of low risk patients (SCS 0–3) and in 94% of cases of those with increased risk (SCS>8).
Comparison to validation cohort
Frequency distribution of scores and mortality in the five risk groups was comparable to mortality in the 3,228 patients in the validation cohort of Kellett et al (Table 5). The crude 30-day mortality rate in the WMH sample was 6.3%. This compares with a 30-day mortality rate of 4.5% in the Kellett validation cohort. At five days, mortality in the WMH sample was 2.1% compared with 1.5% in the Kellett sample. These rates are in proportion, indicating that the combined effect of factors contributing to the risk of dying are multiplicative rather than additive, and may be represented thus as: Pr(death) ∝ Length of Stay ∗ hospital site ∗ risk category. A model of risk is obtained from a log transformation of the above equation: Ln[Pr(death)] = ALOS + Bhospital site + CSCS risk group + error. This model can be analysed using standard Poisson regression methods to model survival subsequent to admission (Table 6 with length of hospital stay at two levels: 0–5 days and 5–30 days). Length of hospital stay was used to calculate the comparative exposure of patients in each cell of the table to the hazard and a model was fitted with the three factors in an attempt to reduce the unexplained residual variation (‘mean deviance’) in the model to <1.
Table 5.
Comparison of frequency distribution of risk bands and clinical outcomes in patients from Wrexham Maelor Hospital (WMH) and the validation cohort of Kellett.9
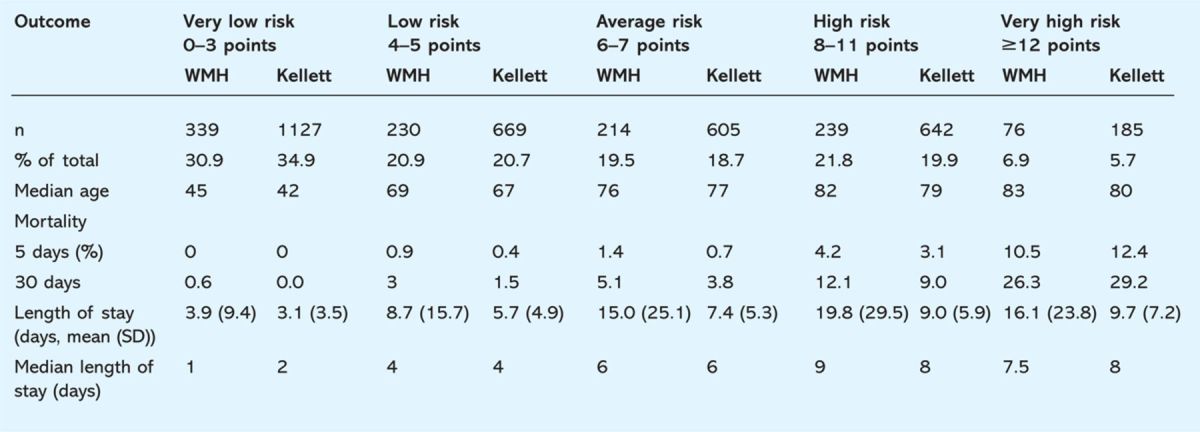
Table 6.
Multidimensional tables of factors for stratification of risk of death combining data from the present cohort and the Kellett study.9
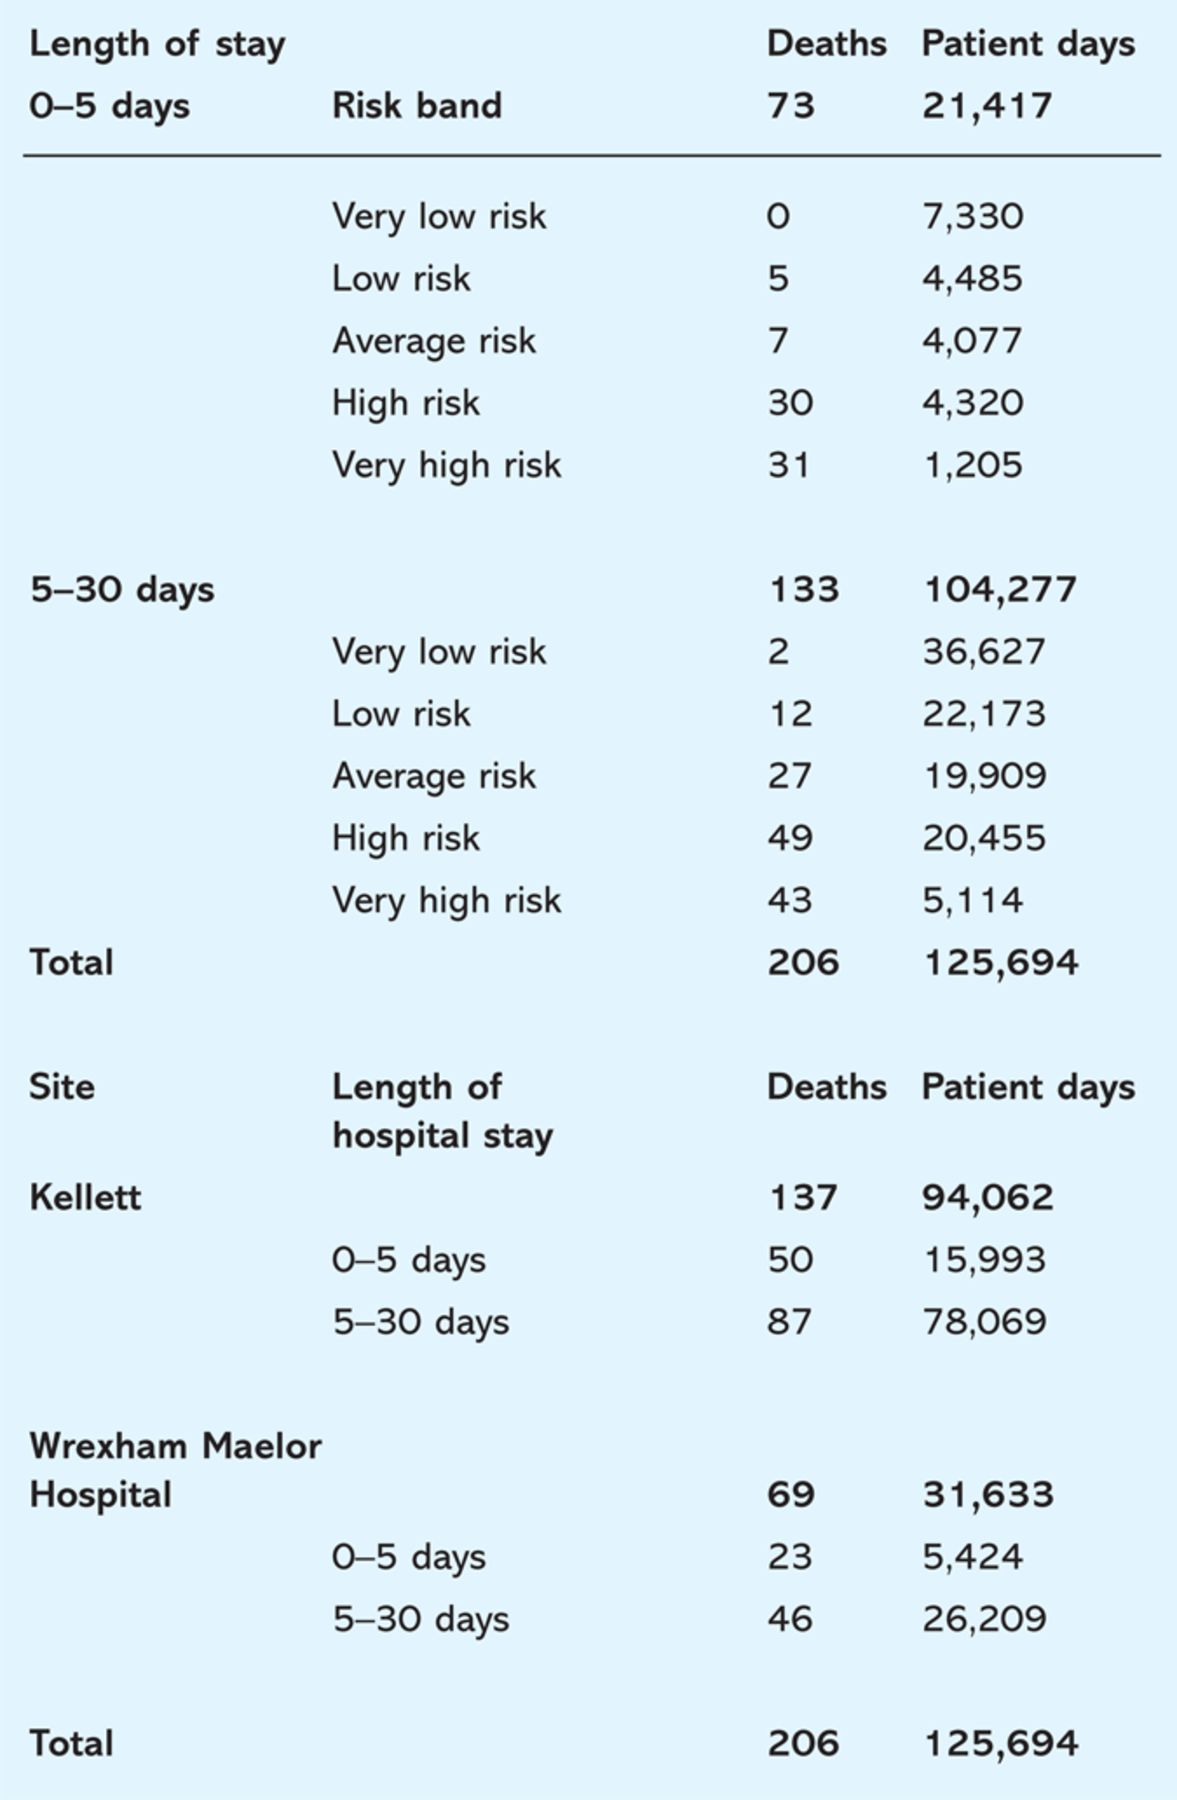
The estimated uniform hazard was 0.001639 deaths per day. SCS risk group accounted for 85% of the observed variation in both samples combined, and is a highly significant explanatory factor (p<0.001). Length of stay explains a significant amount of observed variation (p<0.001). Hazard from day six onwards is on average 60% lower than that in the first five days. This suggests that patients are most at risk on admission. The main effect of the hospital unit from which the two samples are derived is borderline significant (p=0.054).
When adding a nested benchmarking factor (risk group/site, p=0.03) the resulting model displays an acceptable fit (mean deviance = 0.73). The factor is therefore significant. From a benchmarking perspective WMH could be said to have a reduced hazard in the high-risk group (by 10% in comparison with Kellett), and an elevated hazard in other risk groups.
There was, however, near co-linearity in this model arising from two unexpected deaths in the very low risk group in WMH (standardised residual >2). Sample size calculations suggest that at least 1,450 admissions should be considered per unit in order to distinguish successfully between proportions of mortality.
Discussion
The present study showed that it is practical to derive the SCS from routinely collected clinical records. Patients in the very low risk group are unlikely to benefit from hospital admission in terms of mortality and even patients in the low risk and average risk group might be manageable as ambulatory patients with urgent outpatient investigations and treatment. The SCS also identified a group of patients with high risk of adverse outcomes that might benefit from enhanced care in a critical care setting. The results were comparable with those derived in the validation cohort despite the setting being different in the size of the hospitals and in the nationality of the examined population.
This was a single centre study and the short data collection period did not allow analysis of the natural variability of data for scores, outcomes and the care process. Reproducibility was affected by variability in a limited number of parameters. Further research needs to address how performance of these parameters is affected by focused training. Kellett used an automated evaluation of ECGs by a computerised system.9 This is likely to be a more reproducible and precise method.
It is believed that no other study has attempted to compare quality of care for medical emergency admissions over a broad range of diagnostic categories in different hospitals or healthcare systems. Collaborative research has established differences in outcomes in care for single diagnostic categories such as asthma, diabetes and ischemic heart disease.12–14
Measures of quality of care have served in other specialties to highlight achievable standards of good care. Internal medicine is a specialty looking after a broad range of conditions that appear to have little in common. This current study, however, shows that physiological and functional data could aid to risk-stratify patients on admission to hospital irrespective of underlying pathology. Furthermore the SCS represents a useful algorithm to assist with clinicians’ clinical judgement and in their ability to prognosticate patients in internal medicine.
It would be desirable to compare outcomes of patients admitted as emergencies to departments of internal medicine on a multicentre and ideally on an international level for purposes of quality control. The SCS exploits readily available data and combines usefulness for routine clinical triage and quality control and thus should finally allow internal medicine to use comparative audit as a driver for improvement of patient care.
Acknowledgements
The authors would like to thank Habib Rehman, Abhijit Chakraborty, Soudaka Venturi, Annette D’Souza, Mathew Hankey, Farrah Bakr for help with data collection; Julie Jones and Julia Blaylock for their administrative support; David Harrison for statistical advice; and Chris Whitaker from the School of Medical Sciences, University of Bangor, for a review of the manuscript. Data have been presented at the European Federation of Internal Medicine, Rome May 2008 (Abstract book, 7th Congress European Federation of Internal Medicine).
Funding
The study was supported by a grant from the North East Wales NHS Trust.
References
- 1.Rowan KM, Kerr JH, Major E, et al. Intensive Care Society's APACHE II study in Britain and Ireland – II: Outcome comparisons of intensive care units after adjustment for case mix by the American APACHE II method. BMJ 1993;307:977–81. [DOI] [PMC free article] [PubMed] [Google Scholar]
- 2.Knaus WA, Draper EA, Wagner DP, Zimmerman JE. APACHE II: a severity of disease classification system. Crit Care Med 1985;13:818–29. 10.1097/00003246-198608000-00028 [DOI] [PubMed] [Google Scholar]
- 3.Le Gall, JR, Neumann A, Hemery F, et al. Mortality prediction using SAPS II: an update for French intensive care units. Crit Care 2005;9:R645–52. [DOI] [PMC free article] [PubMed] [Google Scholar]
- 4.Intensive Care National Audit and Research Centre . www.icnarc.org/audit/cmp/edars. [Google Scholar]
- 5.McCulloch P, Ward J, Tekkis PP, ASCOT group of surgeons British Oesophago-Gastric Cancer Group. Mortality and morbidity in gastro-oesophageal cancer surgery: initial results of ASCOT multicentre prospective cohort study. BMJ 2003;327:1192–7. [DOI] [PMC free article] [PubMed] [Google Scholar]
- 6.Bridgewater B, Grayson AD, Brooks N, et al. North West Quality Improvement Programme in Cardiac Interventions. Has the publication of cardiac surgery outcome data been associated with changes in practice in northwest England: an analysis of 25,730 patients undergoing CABG surgery under 30 surgeons over eight years. Heart 2007;93:744–8. [DOI] [PMC free article] [PubMed] [Google Scholar]
- 7.Vincent C, Aylin P, Franklin BD, et al. Is health care getting safer?. BMJ 2008;337:1205–7. 10.1136/bmj.a2426 [DOI] [PubMed] [Google Scholar]
- 8.Subbe CP, Kruger M, Rutherford P, Gemmell L. Patients at risk: Validation of a modified Early Warning Score in medical admissions. QJM 2001;94:521–6. [DOI] [PubMed] [Google Scholar]
- 9.Kellett J, Deane B. The Simple Clinical Score predicts mortality for 30 days after admission to an acute medical unit. QJM 2006;99:771–81. 10.1093/qjmed/hcl112 [DOI] [PubMed] [Google Scholar]
- 10.Zubrod CG, Schneiderman M, Frei E, et al. Appraisal of methods for the study of chemotherapy of cancer in man: comparative therapeutic trial of nitrogen mustard and triethylene triphosphoramide. J Chron Dis 1960;11:7–33. 10.1016/0021-9681(60)90137-5 [DOI] [Google Scholar]
- 11.Hanley JA, McNeil BJ. The meaning and use of the area under a receiver operating characteristic (ROC) curve. Radiology 1982;143:29–36. [DOI] [PubMed] [Google Scholar]
- 12.Williams AD, Lloyd AC, Watson L, Rabe KF. Cost of scheduled and unscheduled asthma management in seven European Union countries. Eur Respir Rev 2006;15:4–9. 10.1183/09059180.06.00009801 [DOI] [Google Scholar]
- 13.Massi-Benedetti M. The cost of diabetes type II in Europe. The CODE-2 study. Diabetologia 2002;45:S1–S4. [DOI] [PubMed] [Google Scholar]
- 14.Kunst AE, Groenhof F, Andersen O, et al. Occupational class and ischemic heart disease mortality in the United States and 11 European countries. Am J Public Health 1999;89:47–53. 10.2105/AJPH.89.1.47 [DOI] [PMC free article] [PubMed] [Google Scholar]


