



Erratum
Unfortunately, the original version of this article [1] contained an error. Figures 2 and 3 were interchanged. Figures 2 and 3 have been corrected in the original article and are also included correctly below.
Fig. 2.
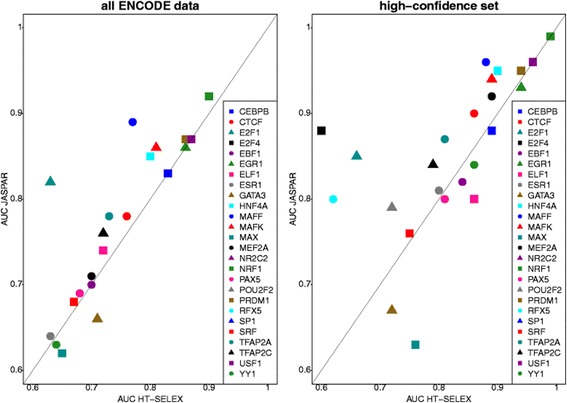
Direct comparison of binding models generated by different methods. Depicted are AUC scores for TFs stored in both JASPAR (manually collected curated models) and HT-SELEX. AUC scores were generated using ROCR. If multiple binding models were available for one TF, we depict the average AUC value
Fig. 3.

Representative plots for conservation analyses. We determined the maximum phastCons (a) and phyloP (b) scores in each experimentally confirmed binding site of BCL11A (left panel) and ZBTB33 (right panel) and calculated the averages of the maximum scores
Footnotes
The online version of the original article can be found under doi:10.1186/s12864-016-2729-8.
Reference
- 1.Hombach, et al. A systematic, large-scale comparison of transcription factor binding site models. BMC Genomics 2016;17:388. doi:10.1186/s12864-016-2729-8 [DOI] [PMC free article] [PubMed]