Abstract
The challenge of generating bed availability is constant in most NHS acute trusts. Building on previous work applying queue theory, this paper now takes operational data from one NHS trust, collected over a period of more than a year, to provide an evidence base and to establish the practical challenges associated with demand variation and managing length of stay. The problem is split into three separate parts. Daily bed shortages are mostly influenced by the timing of arrival and discharge of patients with a short length of stay. Patients who stay for longer than one to two days contribute most significantly to the observed weekly bed availability problem. The problems associated with bed shortages around Christmas time and into the New Year are not simply issues of increased demand. A reduction in discharge capacity is a major contributory factor that results in unnecessary increases in length of stay.
Key Words: bed management, capacity, flow, seasonal demand
Introduction
In a previous paper the part that demand and capacity variation play in the generation of bed shortages was highlighted.1 Put simply, the variation seen in the demand and availability of beds generates Erlang queues that create problems when new patients need to be admitted. The important feature of this situation is that trusts cannot work effectively if they only plan for average demand and some degree of ‘spare’ capacity is needed to cope with this variation. However, it was also suggested that ‘more beds’ is not a universal solution to the problem. An increase in the bed pool generates its own problems and also ignores some potential to improve the management of beds through better control of admissions and discharges, and a greater focus on managing length of stay. A proportion of bed capacity is still wasted and there is scope to improve use of beds without a detrimental impact upon patient care. It is suggested that a suitable bed stock can be achieved when the natural effects of variation are factored in and the real behaviours of the system are understood. In this paper data from one NHS trust are used to carefully assess the underlying patterns associated with bed availability. These data are then used to generate a set of diagnostic approaches so that others can understand the situation.
The theory quickly revisited
There have now been a number of studies that highlight the impact of variable bed occupancy and analyses that treat bed shortages as the equivalent of an Erlang queue.2–8 These queues develop when capacity and demand mismatch in the short term due to random capacity and demand variation. The situation is made more complex by the fact that seasonal demand patterns create additional pressures. The implication is that bed utilisation needs to be significantly less than 100%, and that the size of the bed pool also influences the achievable levels of bed occupancy that do not cause excessive periods of time without available beds. Jones provides a detailed analysis of the outcomes for different scenarios of length of stay (LoS) and bed pool.9 He also concurs that commonly applied ‘85% rule’ of bed occupancy occurs as a misinterpretation of the theory from the mathematical model by Bagust et al and was not necessarily the intention in that paper.8 Mathematical models that allow the user to perform assessments on their own relationships between demand, LoS, capacity, utilisation and bed availability are now generally available.
One area of disagreement with Jones concerns his remarks about the impact of poor bed management practices in his reference to Rogers et al9:
…the Modernisation Agency may have muddied the waters considerably by insisting that poor standardisation of processes lead to variation in bed demand and that bed demand was largely amenable to direct control via process change.
In this respect it is interesting to see if an individual trust's bed problems are purely down to uncontrollable cyclical and random changes or whether some of the patterns of occupancy can be controlled. Our assertion is that much of the measured variation is not purely random and has a cyclical pattern that can be altered by changed management practices. The Erlang models can produce misleading answers where cyclical and random demand are confused.
Method
To fully understand the dynamics of the bed management problem, the following items of data were recorded:
daily emergency (unplanned) admissions (from April 2006 to present)
daily elective (planned) admissions (from April 2006–present)
daily bed occupancy state at midnight in adult beds, excluding ophthalmology, obstetrics and paediatrics
daily discharges, stratified by elective/emergency admission type
hourly admissions and discharges
hourly bed occupancy state for sample weeks.
These allowed us to derive a number of other pieces of data:
frequency distribution of LoS
Pareto analysis of LoS
admissions, discharges and relative bed occupancy for patients with greater or less than seven days LoS.
Findings
Pareto analysis of LoS reveals that, typically, 80% of patients actually stay in hospital for less than seven days and nearly half of all patients stay for two days or less. Cumulatively this group of patients takes up 30% of the total bed capacity. Fifteen per cent of patients stay between seven and 21 days, but these take up about 40% of the total capacity. Detailed analysis of patient type suggests that the two groups of patients are broadly very different, with a high proportion of short-stay patients being admitted for stabilisation and tests. Substantial episodes of treatment, especially medical treatment, generally take seven days or more.
The daily bed cycle
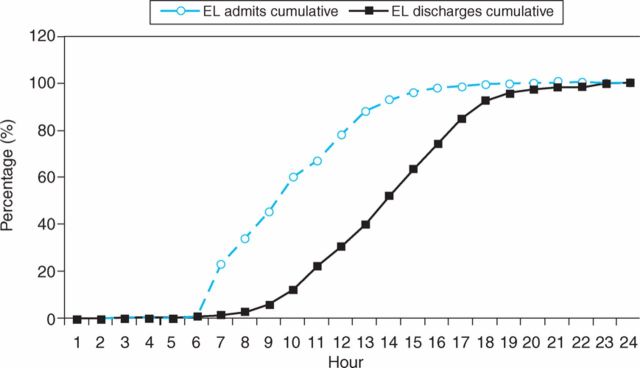
Most bed management systems devote a lot of time and attention to the daily problem of bed availability. Perceived bed shortages that are apparent in the morning of a typical working day are resolved by the bed management team during 24 hours. There are suggestions that the daily admission and discharge cycle is partly responsible for this problem and that it should partially resolve itself towards the end of each day.10 Figure 1 shows the contrast between admissions and discharges for elective patients at the study site.
Fig 1.
Cumulative daily elective (EL) admission and discharges.
The evidence here confirms the suggestions in the literature of the lag between admissions and discharges by time of day. Results for unplanned admissions are similar, although the arrival times are more spread through the day. This implies the arrival times that are planned for patients are more problematic than those for emergency patients, from a bed availability perspective. It is also worth noting that half the requests for beds are from patients with a two-day or less LoS, so the management of admission of short-stay patients should have a high impact on the daily bed ‘crisis’.
The bed cycle over the week
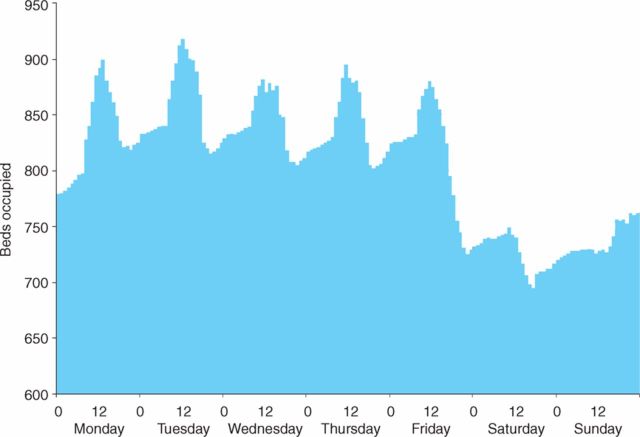
Once the bed occupancy is measured every hour over a week, other cyclical patterns emerge. These are shown in Fig 2. Three specific points emerge from interpretation:
The bed occupancy at midnight reflects the demand for beds based around the total number of patients and their LoS. This figure is below the peak demand for bed space due to the daily bed cycle.
The peak bed requirement occurs at about midday due to the daily mismatch between admissions and discharges. The data show that about 100 more beds are needed to cope with the daily cycle in this example, which represents about 11% of total bed capacity.
The system runs at full speed five days per week and occupancy inevitable falls during the weekend, with about 20% of bed capacity unutilised. Additional waste is potentially hidden by lack of other discharges during the two-day period. The weekly cycle currently relies on empty beds at midnight on Sundays to allow for the net admissions on the first two days of each week. In this trust, Tuesdays are likely to be the worst crisis days, when expected occupancy peaks at midday.
Fig 2.
Hourly bed occupancy over a week.
Annual patterns
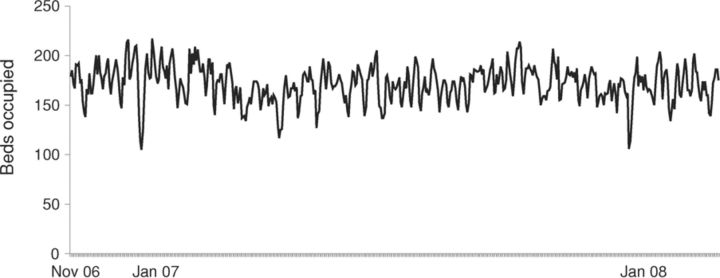
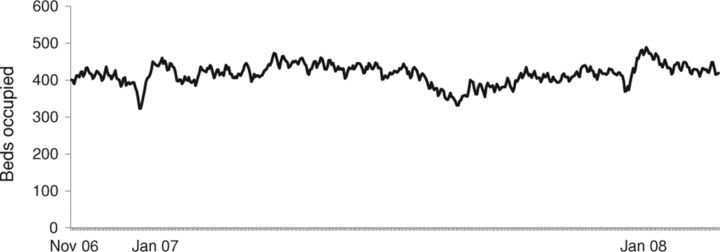
Figures 3a and 3b show the beds occupied by short- and long-stay patients in the study site. The data show that the annual pattern of bed occupancy for short LoS patients (Fig 3a) shows very little obvious seasonality, with the overwhelming majority of the year needing between 150 and 200 beds. The variation observed seems to be natural random variation. If anything, there is a slight drop in shorter stay admissions over both December/January periods shown above. Longer stay patients show two clear trends (Fig 3b). First, there is a reduction in bed requirement over the August holiday period, which is replicated in other years (not shown). Second, both December periods start with a drop in demand followed immediately by a sudden increase in bed occupancy by long LoS patients.
Fig 3a.
Bed occupancy <7 days length of stay, November 2006 to January 2008.
Fig 3b.
Bed occupancy >7 days length of stay, November 2006 to January 2008.
Interpretation of results
The data that focus on hourly and daily demand variation for beds show that the patterns of demand are predictable around known and explainable patterns of referral and in-hospital system behaviour. The implication for this is that much of the effort currently put into bed management repeatedly addresses the symptom of lack of short-term bed availability but treats this as if it is part of the longer term issue of bed capacity. Although there is still much that needs to be done to improve the planning and control of the ‘bed state’, the existing practices do not address the underlying causes of the short-term bed shortage. In effect, it is classic crisis management rather than crisis prevention.
It is important to recognise the net effect of random variation on bed requirements. Figure 3a shows that the number of beds needed for shorter stay patients naturally randomly varies by about 25% over the period of a year. This variation is a result of other random factors, including random variation in patients' sickness levels and the resulting random nature of LoS. In the literature the challenges posed by the perception of an 85% bed occupancy target have been targeted. The data show that bed occupancy should fall to relatively low levels during periods of randomly low demand and pressure for beds could increase significantly as well, by chance. This implies that we have to accept that sometimes beds will be empty and a trust, as a whole, should operate at below 85% occupancy some of the time. Equally, when random events create higher occupancy, this is expected. Such occupancy figures must not be treated as absolute limits. The fact that most trusts report very high levels of occupancy most of the time, outside of holiday periods, also hints that the system operates as a ‘push’ system, ie new demand creates pressure to discharge old demand. Trusts would not be able to cope with random variation at such high levels of apparent utilisation unless there is hidden waste in the system.
These new data challenge the interpretation of the ‘winter beds crisis’. Experience in this trust is that average patient demand remains at fairly constant levels, but there is a mix change towards longer lengths of stay. However, no evidence that patients' sickness levels are significantly higher, which would explain longer LoS, was found. Instead, two factors contribute to longer LoS and hence are at least partially responsible for the apparent crisis. First, during the late December period, inpatient services slow down, creating delays for diagnosis and treatment. Perhaps more significantly, there is a two-week period when discharge processes come to a halt, particularly in relation to more complex discharge. It is the manpower availability to perform discharge tasks that acts as the capacity constraint in the system, rather than the physical bed space. High levels of discharge prior to Christmas create the impression of ample bed space, the ‘push’ process discussed above also stops, further reducing the capacity provided to complete discharge activity. This is a more plausible explanation of the beds crisis.
A further issue that might be addressed in the future is the impact of an ability to release longer stay patients to alternative settings. Where capacity in alternative settings is constrained or absent, this will limit the ability of the acute providers to take on more work.
Conclusions
This paper has contributed to the evidence base concerning the need for changes to bed management practice that should happen in tandem with the planning and modelling processes currently used to establish appropriate bed capacity. Three specific challenges for the effective management of bed capacity still exist:
The daily bed cycle, where admission and discharge times mismatch, generates the most immediate problems in relation to perceived bed shortages. Current bed management practices do very little to solve the underlying problem and instead tackle the symptoms. Demand from short stay patients is the most significant factor influencing the problem.
The weekly bed cycle does create waste in the system, even though some people regard this as a less important factor. However, at least 20% of capacity is partly wasted because of this problem. Practices to ensure a more level schedule across the week could create significant extra supply that reduces the number of crisis days.
These data do not support the notion of increased demand as a single, dominant causal factor for winter bed shortages. There is a temporary change in patient LoS in the December/January period, probably due to reductions in effective discharge capacity, which readily explains the increase in bed occupancy. For the system to effectively limit this problem, investigation, clinical review and discharge practices in hospital and support services out of hospital would need to be more consistently provided during this holiday period.
The data also show the levels of expected natural variation in demand over time. How this variation should create random peaks and troughs in bed occupancy that must not be misinterpreted as seasonal demand change should be emphasised. It must also be recognised by both clinicians and managers that occupancy levels temporarily below 85% should be a natural phenomenon and must not be automatically regarded as inefficient.
References
- 1.Allder S, Silvester K, Walley P. Managing capacity demand across the patient journey. Clin Med 2010;10:13–5. [DOI] [PMC free article] [PubMed] [Google Scholar]
- 2.Cooke MW, Wilson S, Hallsall J, Roalfe A. Total time in English accident and emergency departments is related to bed occupancy. Emer Med J 2004;21:575–6. 10.1136/emj.2004.015081 [DOI] [PMC free article] [PubMed] [Google Scholar]
- 3.Proudlove NC, Gordon K, Boaden R. Can good bed management solve the overcrowding problem in accident and emergency departments?. Emerg Med J 2003:149–55. [DOI] [PMC free article] [PubMed] [Google Scholar]
- 4.Fusco D, Saitto C, Arca M, et al. Cyclic fluctuations in hospital bed occupancy in Roma (Italy): supply or demand driven?. Health Serv Manag Res 2003;16:4:268–75. 10.1258/095148403322488964 [DOI] [PubMed] [Google Scholar]
- 5.Noon CE, Hankins CT, Cote MJ. Understanding the impact of variation in the delivery of healthcare services. J Healthcare Manag 2003;48:2:81–98. [PubMed] [Google Scholar]
- 6.Walley P, Silvester K, Steyn R. Managing variation in demand: lessons from the UK National Health Service. J Healthcare Manag 2006;51:5:309–20. [PubMed] [Google Scholar]
- 7.De Bruin AM, van Rossum A.C, Visser MC, Koole GM. Modeling the emergency cardiac in-patient flow. An application of queuing theory. Health Care Manag Sci 2007;10:2:125–37. [DOI] [PubMed] [Google Scholar]
- 8.Bagust A, Place M, Posnett JW. Dynamics of bed use in accommodating emergency admissions: stochastic simulation model. BMJ 1999;319:155–8. 10.1136/bmj.319.7203.155 [DOI] [PMC free article] [PubMed] [Google Scholar]
- 9.Jones R. Emergency admissions and hospital beds. Br J Healthcare Manag 2009;15:289–96. [Google Scholar]
- 10.Walley P. A common ritual. Health Service J 2008:30. 10.1207/S15327825MCS0301_05 [DOI] [Google Scholar]


