Abstract
The slow epidemic of liver disease in the UK over the past 30 years is a result of increased consumption of strong cheap alcohol. When we examined alcohol consumption in 404 subjects with a range of liver disease, we confirmed that patients with alcohol-related cirrhosis drank huge amounts of cheap alcohol, with a mean weekly consumption of 146 units in men and 142 in women at a median price of 33p/unit compared with £1.10 for low-risk drinkers. For the patients in our study, the impact of a minimum unit price of 50p/unit on spending on alcohol would be 200 times higher for patients with liver disease who were drinking at harmful levels than for low-risk drinkers. As a health policy, a minimum unit price for alcohol is exquisitely targeted at the heaviest drinkers, for whom the impact of alcohol-related illness is most devastating.
KEYWORDS : Alcohol, alcohol policy, cirrhosis, liver, minimum unit price
Introduction
Over the past 30 years, the UK has seen a fourfold increase in mortality due to liver disease, with most of these deaths resulting from alcohol-related liver disease (ALD).1 In 2011, ALD comprised around 4% of the 1.2 million alcohol-related admissions in England but caused 84% of the 6,923 deaths directly attributable to alcohol and, as such, is a major contributor to alcohol-related harm. Liver disease is the third leading cause of years of working life lost in England and Wales,2 with the vast majority of these premature deaths being related to alcohol.3
In the alcohol strategy4 published in March 2012, the government in the UK outlined the underlying reasons for this increase in alcohol-related harm. They cited cheap alcohol and a failure of previous governments to tackle the issue as the main factors. They noted the ‘strong and consistent evidence that an increase in the price of alcohol reduces the demand for alcohol which in turn can lead to a reduction in harm, including for those who regularly drink heavily and young drinkers under 18’4 and proposed a minimum unit price (MUP) for alcohol, with a consultation not on the principle of the legislation but on the level of the MUP. Modelling was used to provide estimates of the impact of an MUP set at various levels, with an MUP of 50p estimated to prevent about 1,000 deaths in England.5
Evidence shows that very heavy drinkers seek out the cheapest possible alcohol but still spend a considerable proportion of their limited incomes on alcohol.6,7 As a result, an MUP is likely to impact on high-risk drinkers out of all proportion to the impact on low-risk drinkers. To test this hypothesis, we questioned patients by using a detailed drinking diary asking about the type of alcohol they drink, where they buy it and how much they pay for it, so that we could calculate the financial impact of MUP on heavy harmful drinkers with ALD in a clinical setting.
Methods
The study was performed in the liver unit of a large teaching hospital in the south of England. The hospital does not have a liver transplant unit and, although some tertiary referral cases are seen, most of the workload is local and represents a normal liver workload for a hospital.
Recruited subjects were selected at random from consecutive new attendances at liver outpatient clinics and inpatient admissions. The study was performed in two cohorts by trained fourth-year medical students using validated alcohol assessment tools, as previously reported.8 The main study cohort (n = 204 in final analysis) was recruited from 16 December 2012 to 1 April 2013 (excluding weekends and university holidays), when undergraduate student researchers were available to attend clinics and liver wards. Researchers had no knowledge of the underlying liver diagnosis before they approached patients. Informed consent was obtained, and patients who had never drunk alcohol were asked no further questions about their drinking but were included in the study. Patients were given the choice of being interviewed face to face or completing a written questionnaire comprising the validated alcohol assessment tools AUDIT9 and Retrospective Drinking Diary (RDD)10. Patients were also asked additional questions adapted from the ONS Living Costs and Food Survey (LCF)11 and further additional questions, including ‘How much do you spend on alcohol per week?’. Patients were given the opportunity to give their income as an exact figure or within a range, with the mean income within each range used in subsequent analysis when the exact figure was not stated; 60/204 (29.4%) patients were not prepared to state their income in either format and were therefore excluded from income calculations.
Patients in the second cohort (n = 200) had previously been recruited between 8 October 2007 and 17 March 2008. Detailed data from drinking diaries for these patients, which have previously been used to report patterns of drinking,12 were incorporated, where appropriate. The methods for this additional cohort were identical to those for the major cohort, except that they had not been asked questions about expenditure on alcohol.
The study thus comprised drinking diary information in 404 subjects, 204 of whom also recorded their expenditure on alcohol.
Data analysis and presentation
The purpose of the study was to determine how much very heavy drinkers spend on alcohol in relation to their income and not to compare drinking levels between ALD and other types of liver disease, which has been reported previously.8 Patients were classified into the drinking grades used by the Office for National Statistics for England and Wales2 and the Sheffield Alcohol Policy Model.5 With one unit of alcohol in the UK equal to one centilitre (cl) of pure alcohol, the grades were: moderate or low risk (0–14 cl and 0–21 cl alcohol/week for women and men, respectively), hazardous (15–34 cl and 22–49 cl alcohol/week) and harmful (≥35 and ≥50 cl alcohol/week). No significant differences were seen between the two cohorts in alcohol consumption within drinking categories (data not shown) and the type of alcohol purchased, so data were combined in subsequent analyses. It was possible to calculate expenditure on alcohol according to a typical price and the cheapest possible price in all subjects, but only patients in the second cohort were asked about their income or how much money they spent on alcohol each week, and only these data were used to model the impact of an MUP set at 50p/cl (UK unit). To validate these data we also calculated expenditure using the drinking diary. Students visited supermarkets, local shops and pubs in Southampton in March 2013 to ascertain typical ‘average prices’ and typical ‘lowest possible prices’ for a range of different types of alcoholic beverage bought as either ‘on-sales’ (bars and pubs) or ‘off-sales’ (alcohol to take away from supermarkets and shops). Using this information it was possible to calculate an average price/unit of alcohol for each type of alcoholic drink (spirits, wine, beer and cider), and a lowest possible price/unit for each type of alcohol drink. We were then able to compare these values against the prices/unit obtained from patient questionnaires (questions on weekly expenditure and drinking diary) in order to confirm that the figures we obtained were realistic and corresponded to the price range of alcohol in the shops. This proved to be the case, with prices corresponding closely to either average or lowest possible prices in different categories of drinking hazard.
Data were entered into an encrypted SPSS database. The amount spent per unit of alcohol, the additional weekly spend with an MUP of 50p and the percentage of annual income spent on alcohol were calculated for each participant, as follows:
Amount spent per unit of alcohol = weekly alcohol expenditure/weekly units
Additional weekly spend for an MUP of 50p = (£0.50 – price per unit) × weekly units
Proportion of annual income spent on alcohol = (weekly spend × 52)/annual income.
Data on alcohol consumption are not normally distributed, but levels of drinking at the heavy end of the spectrum are of great importance. The Office for National Statistics and the Health and Social Care Information Centre report mean values for alcohol consumption,13 and mean consumption values are used in the Sheffield Alcohol Policy Model.14 We present consumption and derived data using mean, 95% confidence intervals (CIs), median, interquartile range (IQR) and categorised data, as appropriate. Data were analysed using SPSS software version 20, with non-parametric tests of significance including chi-squared, Spearman correlations and Mann–Whitney U tests.
Results
The heaviest drinkers (those in the harmful category) drank a mean of 145 cl alcohol/week (95% CI 121–170, median 112 cl). Within drinking categories, there were no gender differences in overall alcohol consumed (Table 1), so data for the sexes were combined for subsequent analyses. There were significant differences between risk groups in terms of preferred drink, with a significant preference for spirits (p = 0.002) and cider (p<0.001) among harmful drinkers. In terms of the proportion of units consumed, the total units consumed by harmful drinkers comprised 32.5% spirits and 17.4% cider. Whereas of the total units consumed by low risk drinkers, spirits comprised 14.2% and cider only 5.7%. In other words harmful drinkers drank twice as much alcohol as spirits compared with low risk drinkers and three times as much alcohol as cider compared to low risk drinkers. This confirmed our suspicion that harmful drinkers with liver disease exhibit a preference for spirits and strong cider compared with low risk drinkers (Fig 1). Of all of the units of alcohol consumed by all subjects, harmful drinkers consumed 94% of cider units, 90% of spirit units, 81% of lager/beer units and 68% of wine units. For harmful drinkers, 80% of alcohol consumed was bought to consume at home, with roughly equal proportions coming from supermarkets, local shops and off-licences.
Table 1.
Demographics and alcohol consumption.
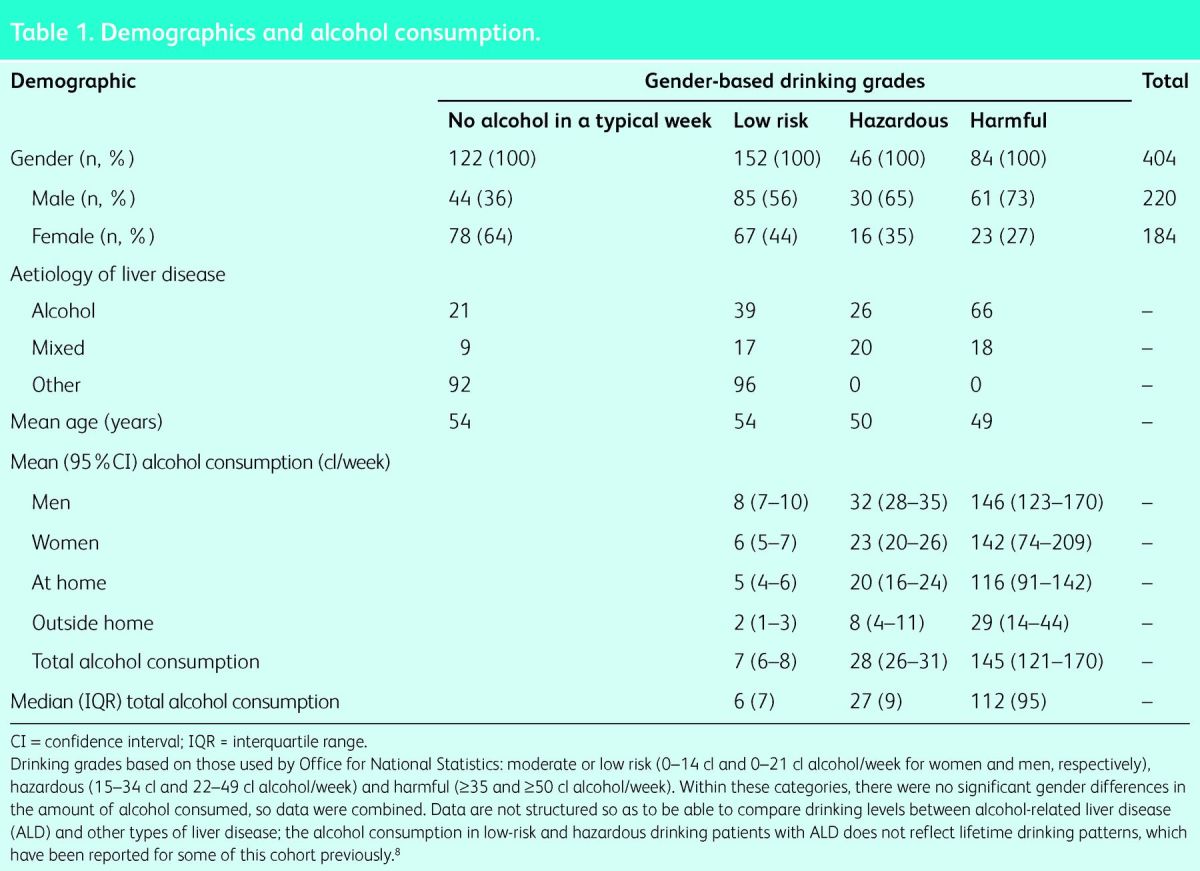
Fig 1.
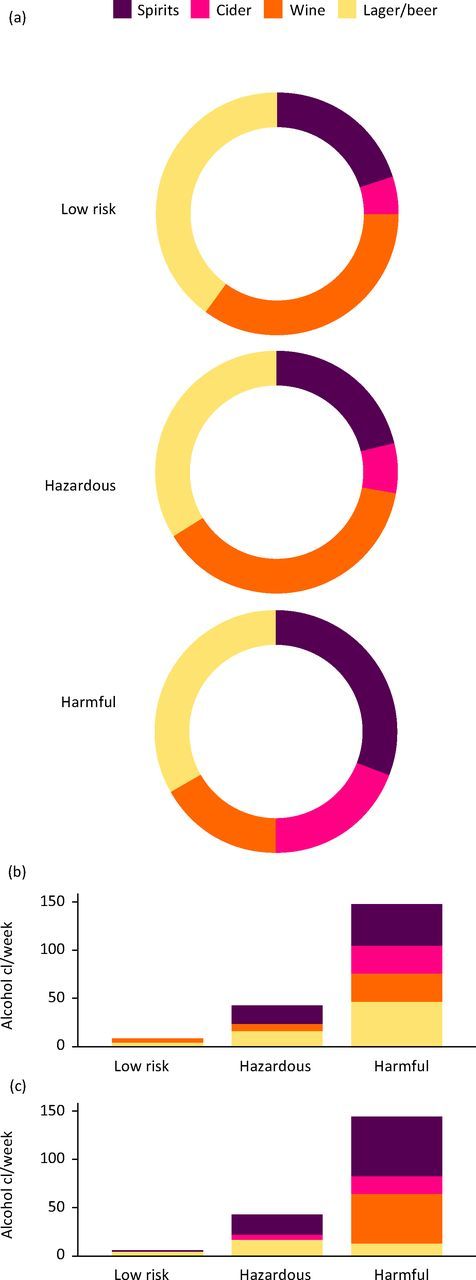
Preferences for different types of alcoholic beverage vary -between low-risk and harmful drinkers in (a) The proportions of total units -consumed as: spirits, cider, wine and according to the category of drinking hazard. (b) Units of alcohol of consumed per week by males according to type of alcohol and category of drinking hazard. (c) Units of alcohol of consumed per week by females according to type of alcohol and category of drinking hazard. As a proportion of alcohol consumed, harmful drinkers drank twice as much alcohol as spirits (p = 0.002) and three times as much alcohol as cider (p < 0.001) compared with low-risk drinkers. The proportion of alcohol drunk as wine was reduced in harmful drinkers (p < 0.001), although women drinking at harmful levels consumed equivalent proportions of their alcohol intake as wine (30%) and spirits (30%).
We made two separate assessments of expenditure on alcohol. We asked participants to tell us the amount they spent on alcohol each week, and we validated this information against information from the drinking diary – separating alcohol bought to consume at home from alcohol purchased in a pub or bar, where prices are substantially higher. We then estimated weekly expenditure using two sets of prices obtained by visiting local supermarkets, off-licences and pubs and noting the typical average prices for ‘on-sales’ and ‘off-sales’ for each type of alcoholic beverage, together with the cheapest possible price that we could find in the same retail outlets (Table 2). Median levels of expenditure between reported and calculated weekly spend were similar to average prices: median £6.00 (IQR £8) and £5.60 (IQR £8), respectively, for low-risk drinkers and £19.00 (IQR £15) and £18.10 (IQR £8), respectively, for hazardous drinkers. For harmful drinkers, reported median spend was similar to the calculation using the cheapest possible prices: £50 (IQR £75) and £53 (IQR £99), respectively. The Spearman rho correlations for reported and calculated levels of expenditure were 0.63 for average price and 0.7 for cheap price for low-risk drinkers, 0.48 and 0.50 for hazardous drinkers and 0.63 and 0.58 for harmful drinkers (p<0.001).
Table 2.
Calculated and reported weekly expenditure on alcohol.
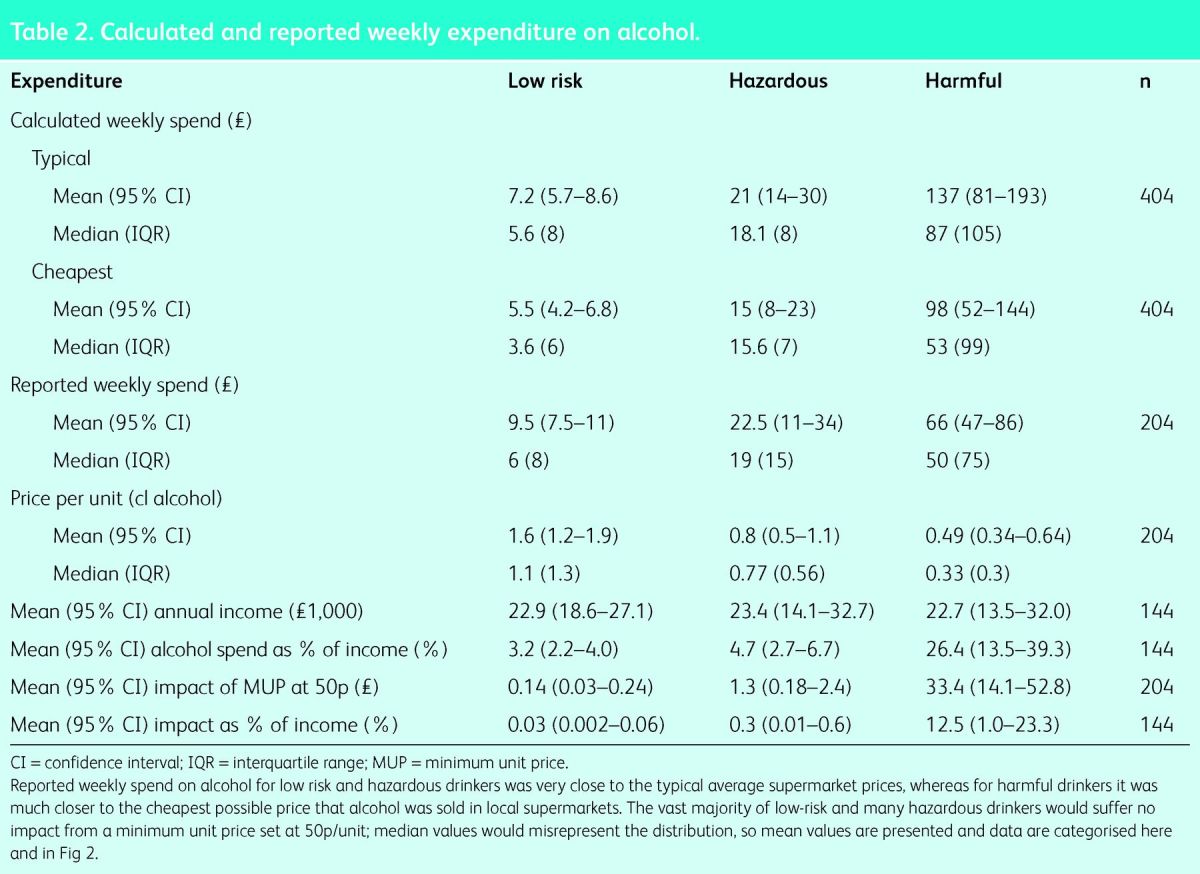
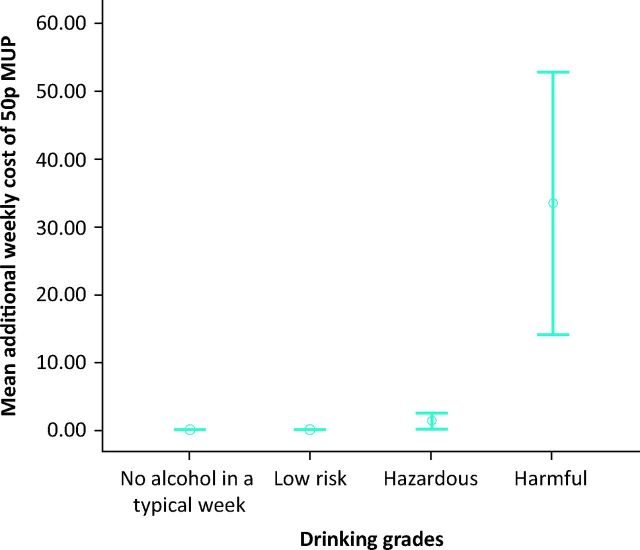
These data suggest that levels of reported alcohol expenditure were realistic compared with expenditure calculated from the drinking diary (Fig 2) and confirm our hypothesis that most patients with liver disease who drink at harmful levels tend to consume the cheapest possible alcohol, with 75% paying ≤50p/cl per unit and a median price of £0.33/cl per unit compared with a median of £1.10/cl per unit for low-risk drinkers. The projected impact of an MUP of 50p on weekly expenditure varied enormously according to the level of alcohol consumption, with a more than 200-fold difference between harmful (£33.40/week) and low-risk drinkers (14p/week, see Fig 2). We found that 89% of low-risk drinkers would not be impacted at all by an MUP of 50p/unit, with 6% paying up to an additional £1/week and 5% up to £5 (Table 3).
Fig 2.
Mean (95% confidence interval; p < 0.001) additional cost of a minimum unit price (MUP) of 50p for alcohol according to category of drinking grade. With knowledge of the amount of alcohol consumed and the price paid per unit for each subject, we were able to estimate the additional cost for each category of drinker should an MUP of 50p/unit be imposed. Most low-risk and hazardous drinkers would be unaffected by an MUP of 50p/unit, and there is a massively disproportionate impact of more than 200-fold on harmful drinkers with liver disease compared with low-risk drinkers.
Table 3.
Impact of a minimum unit price of 50p for alcohol, categorised according to drinking grade (%).
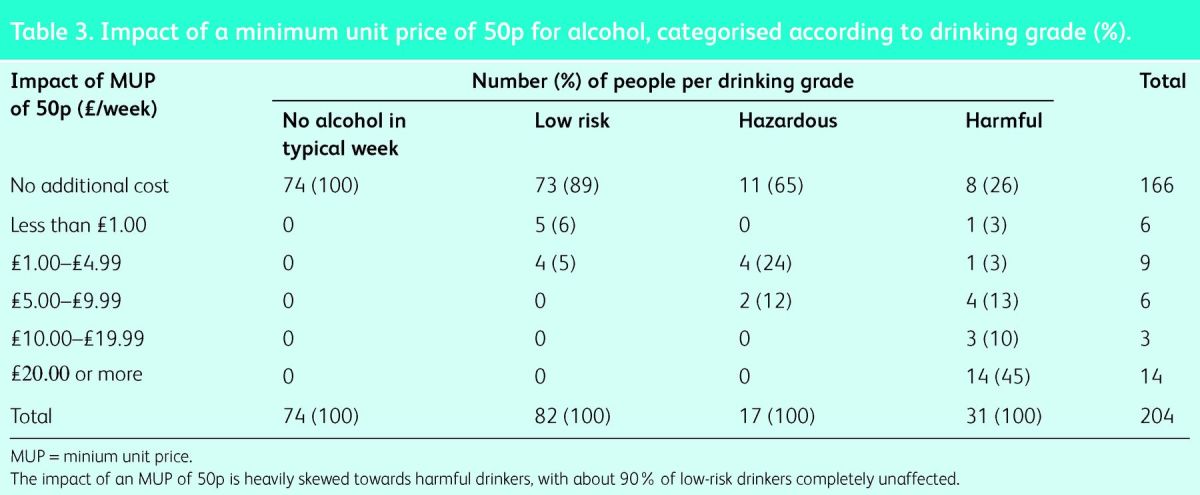
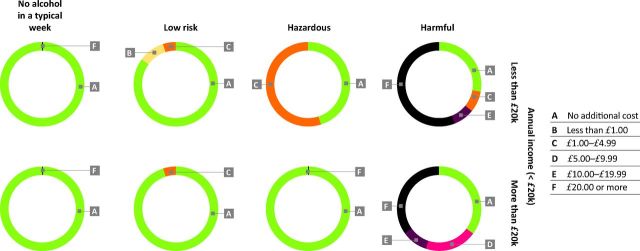
We split our subjects into two income cohorts using a cut-off at £20,000 year in order to model the differential impact of a 50p MUP. There was a higher impact on low-income hazardous drinkers, with more than 50% paying up to an additional £5/week (chi-squared p = 0.03), but the impact on low-risk (p = 0.19) and harmful drinkers (p = 0.43) did not differ according to income (Fig 3).
Fig 3.
Additional weekly cost of a minimum unit price (MUP) of 50p for alcohol categorised by risk category and income. Impact of an MUP of 50p is categorised: low-risk patients are almost entirely unaffected; some hazardous drinkers would pay up to an additional £5/week, with more impact on lower-income drinkers; and there is a disproportionate impact on harmful drinkers irrespective of income, with many of the very heavy drinkers paying more than £20/week extra.
As a proportion of annual income, the additional cost of an MUP of 50p would be around £4/year, which is 0.03% of the annual income for our patients drinking at low-risk levels, whereas the additional cost for harmful drinkers would be a mean of £1,500/year, or 13% of annual income (a 400-fold difference), with 45% of harmful drinkers paying more than an additional £1,000/year were they to maintain their previous level of alcohol consumption.
Discussion
In this study we have confirmed that patients with alcohol-related liver disease drink very large quantities of alcohol and, as a result, they purchase the cheapest alcohol it is possible to buy, paying less than one-third of the price paid by low-risk drinkers. Even wealthy patients with alcoholic cirrhosis buy the cheapest booze available. As a result the impact of minimum unit pricing falls almost entirely on the heavy harmful drinkers irrespective of income; they would pay an additional £1,500 per year (13% of annual income). The vast majority (89%) of low-risk drinkers would pay nothing extra at all – on average £4 per year – a 200-fold difference in financial impact. MUP is a policy that is exquisitely targeted towards alcohol-related harm. The reasons for the hugely disproportionate impact are that the majority of patients with alcohol-related cirrhosis have extremely high alcohol consumptions and, as a result, have graduated to the cheapest alcohol it is possible to buy. Although liver- and alcohol-related mortality are strongly associated with low income and deprivation,15,16 there were no significant differences in income between drinking categories in our study, and differences in income cannot be implicated as the reason for the hugely disproportionate impacts.
For low-risk and moderate drinkers, the levels of alcohol consumption were essentially the same as the survey data from the General Lifestyle Survey, but alcohol consumption in the harmful/dependent category was much higher (mean 146 units/week vs 71.4 units/week); this is important because alcohol policy models, including the Sheffield model,17 use survey data in preference to real patient data when predicting health impacts. This very high alcohol consumption is entirely consistent with previous studies. We have previously reported a mean of 114 cl alcohol/week in patients with alcohol-related cirrhosis.8 A French study found a mean consumption of 165 cl/week in patients with cirrhosis and 248 cl/week in patients with alcohol dependency but no cirrhosis.18 Similarly, Scottish patients with alcohol dependency had higher levels of alcohol consumption than our patients with liver disease, with a mean of 198 cl/week (95% CI 184–210).6 Given the tight relationship between liver fibrosis/cirrhosis and alcohol consumption,19 it may seem counterintuitive that alcohol-dependent patients without liver disease drink more than patients with alcohol-related cirrhosis. However, genetic cofactors mean that only about 20–30% of lifelong alcoholics develop liver fibrosis and cirrhosis,20,21 and the very heavy drinkers in these studies escape cirrhosis by virtue of their genes rather than their lifestyle. About 80% of the deaths directly attributable to liver disease are from ALD,3,22 and a further 10% result from alcohol dependency, so the drinking behaviours of these two groups are absolutely critical to the accurate modelling of fiscal policies, including MUP.
Studies of alcohol consumption are reliant on retrospective self-reported data.23 In addition, we relied on subjects to tell us accurately how much they spend on alcohol each week, although we were able to validate these data to some extent against calculations based on a drinking diary. Our data confirm that patients with liver disease who drink at harmful levels consume very cheap alcohol – a median of 33p/cl compared with the cheapest alcohol, which was 29p/cl for 7.5% alcohol by volume (ABV) cider. We also found that harmful drinkers drank a much higher proportion of their alcohol as strong cider and spirits (usually vodka) than low-risk drinkers. We are aware of one previous study that examined the price paid for alcohol in very heavy drinkers in an alcohol dependency unit in Edinburgh, with the median price/cl for off-sales being 33p in 2008, but the study did not record incomes.6 Similarly, in the US National Alcohol Survey, the decile of heaviest consumers paid $0.79/drink compared with $4.57 for the lower five deciles combined.7 The latter study also demonstrated that the Pareto principle, or 80:20 rule,24 applies to alcohol purchases; despite buying cheap alcohol, the 10% heaviest consumers accounted for 33% of expenditure overall. Similar to our findings that spirits (and strong cider) were preferentially consumed by harmful drinkers, 63% of spirits sales in the American study were purchased by the heaviest drinking decile.7 The Pareto principle also applies to the alcohol market in the UK; in the 2008 Alcohol Strategy consultation, the Department of Health stated that hazardous and harmful drinkers were responsible for 75% of alcohol consumption in the UK – a powerful motive for the drinks industry to oppose targeted polices to reduce harmful drinking and liver deaths.25
The Sheffield Alcohol Policy Model17 predicts that an MUP delivers a greater reduction in alcohol-related harm than overall increases in taxation, with almost double the number of deaths prevented.26 Further evidence for the effectiveness of an MUP comes from long-running natural experiments in Canada, where significant reductions in alcohol consumption followed increases in minimum prices in government liquor stores, despite these outlets representing only a minority of the retail market,27,28 with a 10% increase in minimum price resulting in a 32% fall in deaths directly attributable to alcohol.29 Our data suggest that the Sheffield model is likely to underestimate the impact of an MUP on liver-related mortality. The mean intake of 145 cl alcohol/week in our harmful drinking patients with liver disease compares with a mean of 71.4 units for the harmful category of drinkers from the General Lifestyle Survey (2009)30 used in the Sheffield model. We had hoped that the Sheffield group would be prepared to re-run a further sensitivity analysis using clinically relevant alcohol consumption data to confirm our hypothesis of an increased impact on liver mortality; although they had yet to run the analysis at the time of submission, John Holmes agreed that ‘data on real consumption in ALD patients is relevant to underlying assumptions made for the model, the implications are complex, however, and would require further detailed analysis to make any firm conclusions’. The Sheffield group subsequently confirmed the increased impact of MUP on harmful drinkers who ‘purchase more alcohol at less than the minimum price’.17
The drinks industry presents a paradox – it claims to support policies that target heavy drinkers31 but is fiercely opposed to an MUP, even though it is exquisitely targeted at the very heaviest consumers. The Scotch Whisky Association states on its website, ‘Minimum unit pricing will punish responsible consumers with higher prices. A 40p minimum unit price will impact only on the bottom 30% of households by income group – hitting the poor hardest and will do nothing to address the causes of alcohol mis-use’,32 a statement that is not supported by the facts. However, a further statement from the Scotch Whisky Association may contain a grain of truth: ‘Distillers believe minimum pricing, as proposed by the Scottish Government, would have little impact on alcohol harm but would violate EU and international trade rules, leading to copycat trade barriers in export markets’.33
Clearly, an ineffective policy is not going to be taken up elsewhere, but if an MUP proves to be as effective as the evidence suggests, it will be adopted by other countries; Ireland, Switzerland, Wales and Poland are currently in various stages of the process. In Scotland, the MUP bill was a manifesto commitment overwhelmingly supported by the electorate, approved by parliament and given the Queen's ascent but is now stalled by legal challenges from the spirits industries, which under the circumstances are profoundly undemocratic.34 Rather than opposing evidence-based health policies, a better solution for drinks industry shareholders might be to develop less lethal business models. This has happened in France, where the wine trade has shifted from selling cheap ‘plonk’ in high volumes to higher quality regional wines, which has resulted in increased profits despite reductions in population-level alcohol consumption and a dramatic decrease in deaths from liver disease.1
Acknowledgements
Thanks to Colin Newell for his input to the data analysis and detailed review of the manuscript.
References
- 1.Jewell J, Sheron N. Trends in European liver death rates: implications for alcohol policy. Clin Med 2010;10:259–63. 10.7861/clinmedicine.10-3-259 [DOI] [PMC free article] [PubMed] [Google Scholar]
- 2.Office for National Statistics Statistical bulletin: alcohol-related deaths in the United Kingdom, 2011. Newport: ONS, 2013. www.ons.gov.uk/ons/rel/subnational-health4/alcohol-related-deaths-in-the-united-kingdom/2011/alcohol-related-deaths-in-the-uk–2011.html [Accessed 4 June 2014]. [Google Scholar]
- 3.Jones L, Bellis MA, Dedman D. et al. Updating England-Specific Alcohol-Attributable Fractions. Liverpool: Centre for Public Health, Liverpool John Moores University, 2013. www.cph.org.uk/wp-content/uploads/2014/03/24892-ALCOHOL-FRACTIONS-REPORT-A4-singles-24.3.14.pdf [Accessed 27 June 2014]. [Google Scholar]
- 4.Home Office The government's alcohol strategy. London: Home Office, 2013. www.homeoffice.gov.uk/publications/alcohol-drugs/alcohol/alcohol-strategy [Accessed 4 June 2014]. [Google Scholar]
- 5.Meng Y, Brennan A, Holmes J. et al. Modelled income group-specific impacts of alcohol minimum unit pricing in England 2014/15: policy appraisals using new developments to the Sheffield Alcohol Policy Model (v2.5). Sheffield: University of Sheffield, 2013. www.shef.ac.uk/polopoly_fs/1.291621!/file/julyreport.pdf [Accessed 4 June 2014]. [Google Scholar]
- 6.Black H, Gill J, Chick J. The price of a drink: levels of consumption and price paid per unit of alcohol by Edinburgh's ill drinkers with a comparison to wider alcohol sales in Scotland. Addiction 2011;106:729–36. 10.1111/j.1360-0443.2010.03225.x [DOI] [PMC free article] [PubMed] [Google Scholar]
- 7.Kerr WC, Greenfield TK. Distribution of alcohol consumption and expenditures and the impact of improved measurement on -coverage of alcohol sales in the 2000 National Alcohol Survey. Alcohol Clin Exp Res 2007;31:1714–22. 10.1111/j.1530-0277.2007.00467.x [DOI] [PubMed] [Google Scholar]
- 8.Hatton J, Burton A, Nash H, et al. Drinking patterns, dependency and life-time drinking history in alcohol-related liver disease. Addiction 2009;104:587–92. 10.1111/j.1360-0443.2008.02493.x [DOI] [PubMed] [Google Scholar]
- 9.Saunders JB, Aasland OG, Babor TF, et al. Development of the alcohol use disorders identification test (AUDIT): WHO -collaborative project on early detection of persons with harmful alcohol consumption – II. Addiction 1993;88:791–804. 10.1111/j.1360-0443.1993.tb02093.x [DOI] [PubMed] [Google Scholar]
- 10.Whitty C, Jones RJ. A comparison of prospective and retrospective diary methods of assessing alcohol use among university undergraduates. J Public Health Med 1992;14;264–70. [PubMed] [Google Scholar]
- 11.Office for National Statistics Living costs and food survey. London: 2013. www.ons.gov.uk/ons/guide-method/surveys/respondents/household/living-costs-and-food-survey/index.html [Accessed 4 June 2014]. [Google Scholar]
- 12.Brandish E, Sheron N. Drinking patterns and the risk of serious liver disease. Expert Rev Gastroenterol Hepatol 2010;4:249–52. 10.1586/egh.10.27 [DOI] [PubMed] [Google Scholar]
- 13.Boniface S, Shelton N. How is alcohol consumption affected if we account for under-reporting? A hypothetical scenario. Eur J Public Health 2013: doi: 10.1093/eurpub/ckt016. [DOI] [PubMed] [Google Scholar]
- 14.Meier PS, Meng Y, Holmes J, et al. Adjusting for unrecorded -consum-ption in survey and per capita sales data: quantification of impact on gender- and age-specific alcohol-attributable fractions for oral and pharyngeal cancers in Great Britain. Alcohol Alcohol 2013;48:241–9. 10.1093/alcalc/agt001 [DOI] [PubMed] [Google Scholar]
- 15.Siegler V, Al-Hamad A, Johnson B, et al. Social inequalities in alcohol-related adult mortality by National Statistics Socio-economic Classification, England and Wales, 2001-03. Health Stat Q 2011;50:4-39. [DOI] [PubMed] [Google Scholar]
- 16.Erskine S, Maheswaran R, Pearson T, Gleeson D. Socioeconomic deprivation, urban-rural location and alcohol-related mortality in England and Wales. BMC Public Health 2010;10:99. 10.1186/1471-2458-10-99 [DOI] [PMC free article] [PubMed] [Google Scholar]
- 17.Holmes J, Meng Y, Meier PS, et al. Effects of minimum unit pricing for alcohol on different income and socioeconomic groups: a modelling study. Lancet 2014;383:1655–64. 10.1016/S0140-6736(13)62417-4 [DOI] [PMC free article] [PubMed] [Google Scholar]
- 18.Pelletier S, Vaucher E, Aider R, et al. Wine consumption is not -associated with a decreased risk of alcoholic cirrhosis in heavy drinkers. Alcohol Alcohol 2002;37:618–21. 10.1093/alcalc/37.6.618 [DOI] [PubMed] [Google Scholar]
- 19.Rehm J, Taylor B, Mohapatra S, et al. Alcohol as a risk factor for liver cirrhosis: a systematic review and meta-analysis. Drug Alcohol Rev 2010;29:437–45. 10.1111/j.1465-3362.2009.00153.x [DOI] [PubMed] [Google Scholar]
- 20.Reed T, Page WF, Viken RJ, Christian JC. Genetic predisposition to organ-specific endpoints of alcoholism. Alcohol Clin Exp Res 1996;20:1528–33. 10.1111/j.1530-0277.1996.tb01695.x [DOI] [PubMed] [Google Scholar]
- 21.Dunn W, Zeng Z, O’Neil M, et al. The interaction of rs738409, -obesity, and alcohol: a population-based autopsy study. Am J Gastroenterol 2012;107:1668–74. 10.1038/ajg.2012.285 [DOI] [PMC free article] [PubMed] [Google Scholar]
- 22.Office for National Statistics Mortality statistics: deaths registered in England and Wales (Series DR), 2010. Newport: ONS, 2011. www.ons.gov.uk/ons/rel/vsob1/mortality-statistics--deaths-registered-in-england-and-wales--series-dr-/2010/index.html [Accessed 4 June 2014]. [Google Scholar]
- 23.Shield KD, Rylett M, Gmel G, et al. Global alcohol exposure -estimates by country, territory and region for 2005–a contribution to the Comparative Risk Assessment for the 2010 Global Burden of Disease Study. Addiction 2013;108;912–22. 10.1111/add.12112 [DOI] [PubMed] [Google Scholar]
- 24.Wikipedia Pareto principle. http://en.wikipedia.org/wiki/Pareto_principle [Accessed 4 June 2014]. [Google Scholar]
- 25.Department of Health Safe, sensible, social – consultation on further action. 12. London: DH, 2008. www.dh.gov.uk/en/Consultations/Liveconsultations/DH_086412 [Accessed 4 June 2014]. [Google Scholar]
- 26.Purshouse RC, Meier PS, Brennan A, et al. Estimated effect of alcohol pricing policies on health and health economic outcomes in England: an epidemiological model. Lancet 2010;375:1355–64. 10.1016/S0140-6736(10)60058-X [DOI] [PubMed] [Google Scholar]
- 27.Stockwell T, Auld MC, Zhao J, Martin G. Does minimum pricing reduce alcohol consumption? The experience of a Canadian -province. Addiction 2012;107:912–20. 10.1111/j.1360-0443.2011.03763.x [DOI] [PubMed] [Google Scholar]
- 28.Stockwell T, Zhao J, Giesbrecht N, et al. The raising of minimum alcohol prices in Saskatchewan, Canada: impacts on consumption and implications for public health. Am J Public Health 2012;102:e103–10. 10.2105/AJPH.2012.301094 [DOI] [PMC free article] [PubMed] [Google Scholar]
- 29.Zhao J, Stockwell T, Martin G, et al. The relationship between -minimum alcohol prices, outlet densities and alcohol attributable deaths in British Columbia, 2002 to 2009. Addiction 2013;108:1059–69. 10.1111/add.12139 [DOI] [PubMed] [Google Scholar]
- 30.Office for National Statistics General lifestyle survey 2009. Newport: ONS, 2010. www.ons.gov.uk/ons/rel/ghs/general-lifestyle-survey/index.html [Accessed 4 June 2014]. [Google Scholar]
- 31.House of Commons Health Committee Alcohol: first report of -session 2009–10. London: Stationery Office, 2010. www.publications.parliament.uk/pa/cm200910/cmselect/cmhealth/151/151i.pdf [Accessed 4 June 2014]. [Google Scholar]
- 32.Wine and Spirit Trade Association WSTA response to government's alcohol strategy. London: WSTA, 2013. www.wsta.co.uk/press/611-wsta-response-to-governments-alcohol-strategy [Accessed 4 June 2014]. [Google Scholar]
- 33.Scotch Whisky Association MSPs urged to reject minimum price plan and push for fair and responsible excise taxation. Edinburgh: SWA, 2013. www.scotch-whisky.org.uk/news-publications/publications/documents/msps-urged-to-reject-minimum-price-plan-and-push-for-fair-and-responsible-excise-taxation/#.U4477ijhFG4 [Accessed 4 June 2014]. [Google Scholar]
- 34.McCambridge J, Hawkins B, Holden C. Vested interests in addiction research and policy. The challenge corporate lobbying poses to reducing society's alcohol problems: insights from UK evidence on minimum unit pricing. Addiction 2014;109:199–205. 10.1111/add.12380 [DOI] [PMC free article] [PubMed] [Google Scholar]


