Abstract
Discounting of alcoholic products is universal in UK supermarkets with some chains selling own brand spirits for less than the duty payable per item. Eighty per cent of alcohol purchases are made by 30% of the population and this group are the main beneficiaries. In December 2008 the government announced its intention to consult on modifications to the Licensing Act 2003 to enable the introduction of mandatory conditions for the sale of alcoholic products in order to curtail alcohol harm. In this article it is shown that families in Britain have nothing to fear from the introduction of a 50p/unit minimum price of alcohol as the overall effect should be a reduction in average weekly supermarket bills for the majority while harmful and hazardous drinkers will pay more. By paying less for non-alcoholic products sold by supermarkets, moderate drinkers should no longer be effectively subsidising the alcohol purchased by the harmful and hazardous group.
Key Words: alcohol, licensing, minimum prices Introduction
There has been increasing concern about the harm to health caused by alcohol since the publication of a report by the Chief Medical Officer in 2001 showing a ninefold increase in cirrhosis in 25–44 year olds in the previous 30 years.1 This led to the introduction of an Alcohol Harm Reduction Strategy for England in 2004 which was extended in 2007 with the publication of Safe. Sensible. Social.2,3 In Britain, alcohol consumption rose 121% between 1950 and 2000,2 and from 9.5 to 11.5 litres of pure alcohol per adult between 1987 and 2007 so that the average consumption for every person over the age of 15 is now 22 units (of 8 gram) per week.4 Since the Department of Health (DH) safe limits for consumption are 2–3 and 3–4 units/day for men and women respectively (with two alcohol-free days after heavy drinking) it is not surprising that surveys have shown that about 25% of the population are drinking at hazardous or harmful levels. Alcohol harm continues to escalate and in 2008 the North West Public Health Observatory showed that hospital admissions for alcohol-related conditions were increasing by 80,000 per year.5 In April 2008 the government announced a new cross departmental public service agreement (PSA 25) which includes a performance indicator for the DH to lower the rate of increase in alcohol-related hospital admissions.6 The DH is encouraging local health commissioners and primary care trusts to include this indicator in their local operational plans.
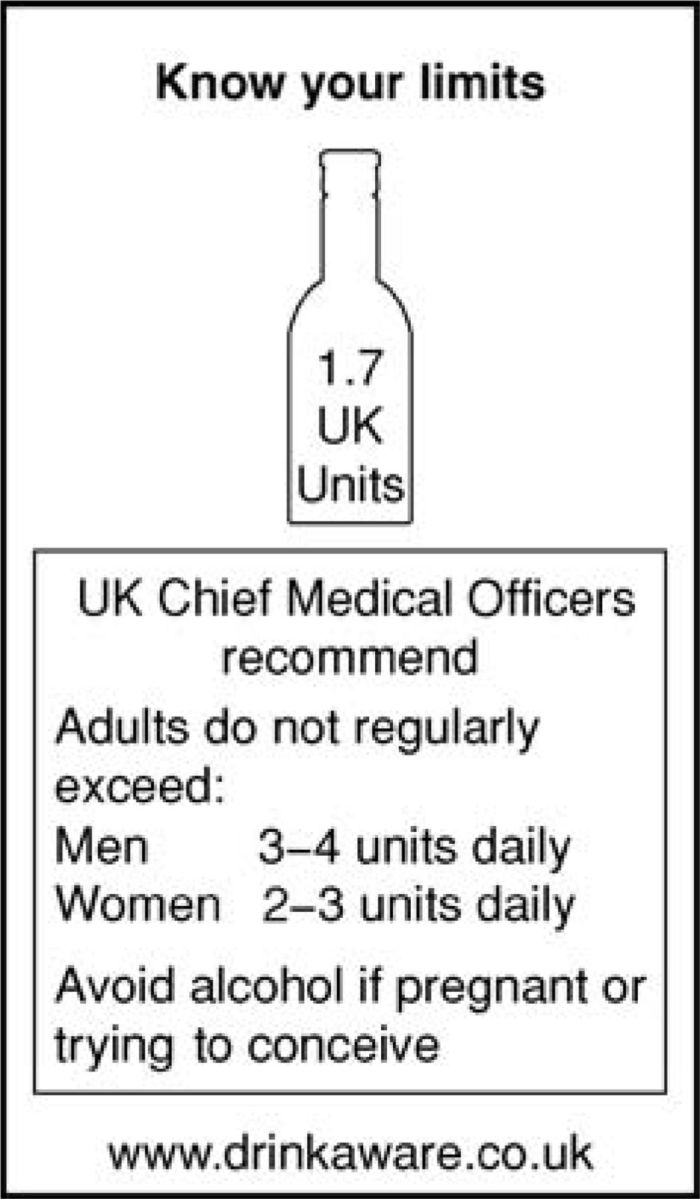
As part of their harm reduction strategy, in May 2007, the government concluded a voluntary agreement with producers to label all alcoholic products with the unit content and the safe limits for consumption (Fig 1) although to date the implementation of this agreement has been extremely poor.3 The government has also commenced a series of public information campaigns designed to educate on alcohol units and safe alcohol consumption while in December 2008 a commitment to the development of a new mandatory retail code was announced.6
Fig 1.

The ‘know your limits’ label. Reproduced with permission from the Office of Public Sector Information (OPSI).3
The price of alcohol
Affordability of alcohol is the relationship between household income and the price of alcohol and in 2004 the Cabinet Office Harm Reduction Strategy showed a parallel relationship with consumption.2 Overall between 1980 and 2007 alcohol became 69% more affordable while in the off-trade (alcohol purchases for consumption ‘off’ the premises), since 1987, beer and wine have become 139% and 124% more affordable respectively.7 An increase in taxation could decrease alcohol affordability and thus consumption but the price increases are not necessarily passed on to purchasers. Immediately after the 2008 budget, which increased alcohol taxation by 9%, the price of a basket of products on mysupermarket.co.uk was actually reduced by 2% by one supermarket chain. Some supermarkets sell alcohol during promotions for as little as 11p/UK unit (10 ml 100% alcohol) and own brand spirits are often sold for less than the excise duty and value added tax (VAT) payable. Such discounting can only be financed by raising prices and thus profitability of the food and non-alcoholic drinks sold. Changes in alcohol taxation cannot curtail alcohol discounting by supermarkets. In this paper the effect of the introduction of a minimum price per unit of alcohol sold has therefore been modelled.
Home food and drinks expenditure
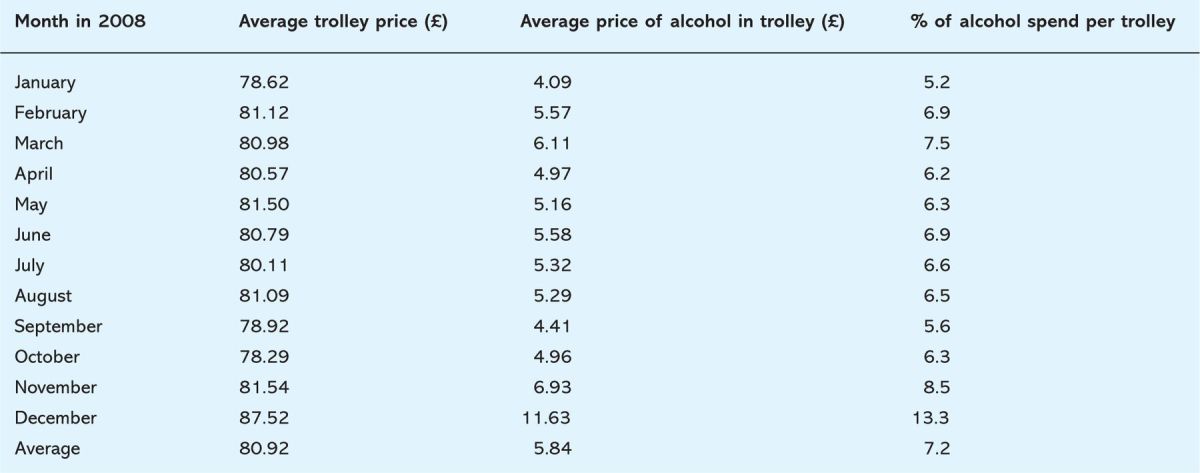
The average trolley price bought through mysupermarket.co.uk, together with the cost in the trolley of the alcohol containing drinks, for the months January to December 2008 are shown in Table 1.
Table 1.
Sums paid for average trolley purchases from mysupermarket.co.uk.

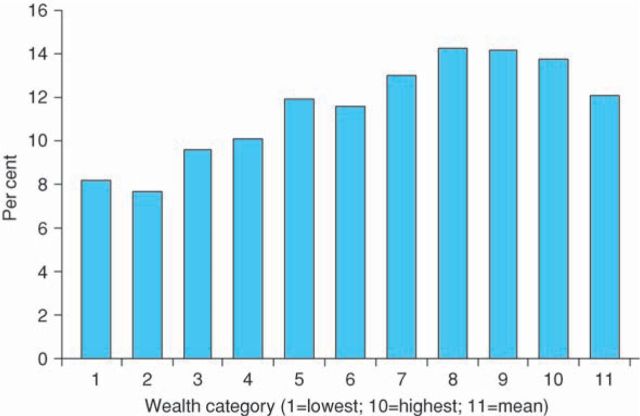
The average trolley expenditure was £80.92 nearly £6 (7.2%) of which was spent on alcohol. Figures for home food and non-alcoholic drinks were also obtained from the Office of National Statistics Expenditure and Food Survey (EFS) in 2006 and compared with home alcoholic drink expenditure (Fig 2).8
Fig 2.
Home alcohol expenditure as a percentage of home food and drinks expenditure.8
The average weekly family expenditure on food and non-alcoholic drinks was £46.90 and on alcohol £6.50. The proportion of the combined expenditure spent on alcohol increased from 7.7% in wealth category 2 to 14.3% in wealth category 8, the mean being 12.1%. This percentage in monetary terms was £6.50/household/week for a mean household size of 1.8 adults. This sum is quite close to the average amount spent on alcohol in the supermarket trolleys (£5.84; Table 1).
Using data from the EFS and from Nielson, the actual cost of alcohol units in four alcohol categories has been calculated.9,10 For beer and spirits the Neilson corrected mean unit price paid is 35p/unit, for wine 45p and for RTD's (alcopops) is 73p.
Effect of a minimum price of 50p/unit on off-trade alcohol purchasing
A minimum price of alcohol of 50p/unit was chosen as it is above the mean price paid for the high volume sales of beer, wine and spirits so that all would be affected by the change in policy. The model relies on the General Household Survey 2006 data that 80% of alcohol is consumed by 30% of the population and that the bottom 30% consume only 2% of alcohol.7,10
The EFS 2006 gives the average alcohol expenditure for spirits, wines and beers (Table 2).8 Using these figures and the Neilson corrected price/unit of alcohol it can be calculated that the average household of 1.8 adults in England is purchasing 16.1 units of alcohol/week. In calculating the figures it is assumed that the same amount of money will be spent per household before and after the change in price. Different alcoholic products vary in the way the volume purchased changes in response to alterations in price. This is known as price elasticity. In calculating changes in purchasing the most recent estimates by the Government Economic Service of price elasticity for different types of alcoholic drinks in the UK have been applied.11
Table 2.
Effect of minimum price of 50p/unit on alcohol purchasing.

From Table 2 it can be seen that a 50p/unit minimum price results in an overall fall in off-trade purchasing of 3.4 units/week (21%). In Table 3 the effect of a 50p/unit price in the three sectors of the population is shown: the 30% purchasing 2% of alcohol; the 40% purchasing 18% of alcohol; and the 30% purchasing 80% of alcohol. In making this calculation it is assumed that these proportions are similar in the off and on trades. It can be seen that the major effect is in the 30% purchasing 80% of the alcohol market where off-trade alcohol purchasing falls by 16 units per week (32%).
Table 3.
Effect of minimum price of 50p/unit on off-trade alcohol purchasing by population sector assuming no change in weekly expenditure.

Effect of a minimum price of 50p/unit on household expenditure on off-trade alcohol
From Table 2 it has been seen that alcohol purchasing would need to fall by 3.4 units per week for alcohol spending to be maintained at a constant. If purchasing were to remain constant at 16.1 units per week this would now cost £8.05/week which represents an increase in household expenditure on alcohol of 24%. When this is applied to the three sectors of the population (Table 4) it can be seen that the major effect on household expenditure is in the top purchasing sector which would need to spend an extra £4.16/week to maintain purchasing levels.
Table 4.
Effect on 50p/unit minimum price on weekly household budget assuming no change in volume purchased.

Effect of a minimum price of 50p/unit on food and non-alcoholic drinks expenditure and overall household budget
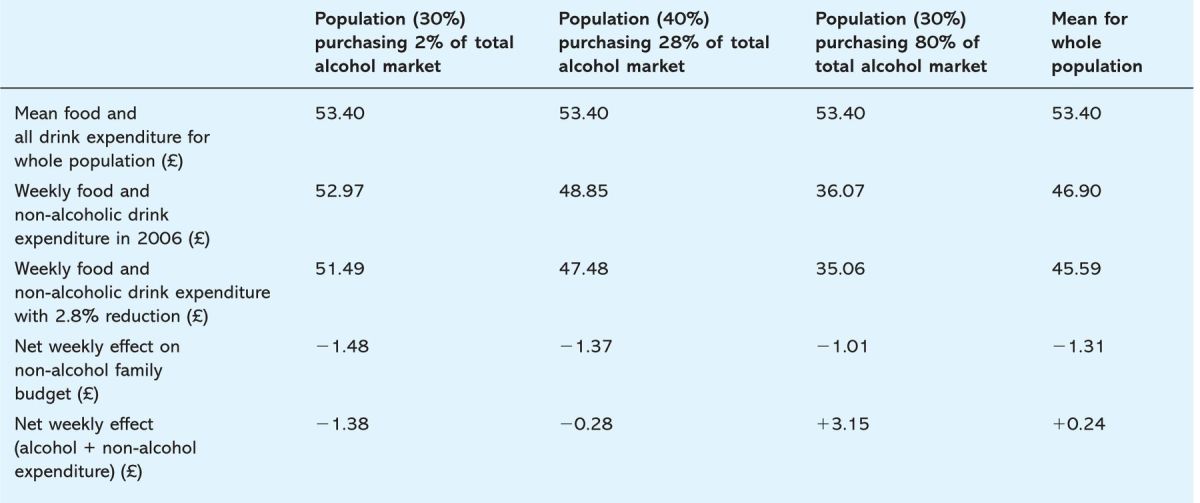
In calculating these figures (Table 5) it is assumed that the overall margins made by supermarkets will be unchanged so that if alcohol prices rise, the price of non-alcoholic products sold will decrease and that the increased profitability of alcohol will be exactly offset by a decrease in profitability on non-alcoholic products. The figures show the effect on family expenditure assuming no change in purchased volume. The mysupermarket.co.uk and EFS figures show that 7.2% and 12% respectively of food and drink purchases are alcohol. For these calculations a figure of 10% has been used so that the 24% increase in alcohol prices can be offset by a 2.8% fall in prices of the 90% of purchases in the non-alcohol sector.
Table 5.
Effect on 50p/unit minimum price for alcohol on food and non-alcoholic drink expenditure and overall household budget.

The figures show that 70% of the population would be better off while the sector purchasing the most alcohol would be selectively affected. The figures illustrate the scenario in which 100% of alcohol is purchased in supermarkets where increased prices of alcohol can be offset by lower prices for food and non-alcoholic drinks. In practice only two thirds of alcohol purchases come from such stores although alcohol specialist stores could also respond by substantially discounting the non-alcoholic drinks they sell.
Discussion
In their detailed and comprehensive study, the Sheffield School of Health and Related Research (ScHARR) has shown that the introduction of a 50p minimum price would cut overall alcohol consumption by 6.9% and would result in extra spending of only £10/year for moderate drinkers, £65 for hazardous drinkers and £165 for harmful drinkers.10 They estimate that this policy would save 100,000 hospital admissions per year and result in the public making financial savings for alcohol-related harm of £1.3 billion per year.10 The percentage fall in consumption calculated by ScHARR is less than that suggested above as they use lower price elasticities. The purpose of this paper is to illustrate the differential rather than overall size of the effect on household budget in the 70% of the population who are moderate drinkers and purchase 20% of total alcohol sales. The calculations are based on a mean selling price of 50p/unit which is higher than the mean selling price for wine, beer and spirits although a few brands are sold at a higher price than this and would not be affected by the policy change. Since nearly all products would be affected we have not considered cross elasticities.
In March 2008 alcohol duty was increased by 9%. There was also a further increase in duty in November 2008 designed to offset the 2.5% decrease in VAT introduced at the same time. The current figures do not take account of any rise in price passed on to customers as a result of these changes. An analysis of a basket of products priced through mysupermarket.co.uk showed 2.4%, 3.2% and 4.4% increases in March 2009 prices for three leading supermarket chains compared to pre-budget prices in February 2008. The annual change in the Consumer Prices Index was 3.0 in the same period so that the increases in alcohol duty cannot have been passed on to consumers in full. Nevertheless the increases in prices since 2006 would partially offset the effect of a minimum price of 50p/unit as calculated in this study.
Minimum pricing of alcohol is based upon the price of a unit of alcohol not on the volume of a particular type of drink. In recent years the alcohol by volume (abv) of alcoholic products has been increasing, in the beer/lager market manufacturers concentrating on the higher (premium strength) products. Very few table wines are now less than 12% (9 units per bottle) and many reach 14.5% (10.9 units per bottle). Producers could offset the effects of the price rise by reducing the alcohol content of their products. For example:
lager currently sold at 35p per unit and 5% abv costs £0.77 per 440 ml can. If the minimum price is 50p per unit the price would rise to £1.10 but if the alcohol content were reduced to 4% abv the price would be £0.88
wine currently sold at 37p per unit and 12% abv (eg three bottles for £10) costs £3.33 per bottle. If the minimum price is 50p/unit the price would rise to £4.50 but if the alcohol content were reduced to 9% abv the price would be £3.38 per bottle.
Thus the introduction of minimum unit pricing should for the first time encourage manufacturers to decrease the abv of their products.
Which section of the population would be most affected by a minimum price of 50p/unit? There is evidence that general alcohol control policies may have a greater impact on heavy drinkers and in their report ScHARR have shown that it is young and heavy drinkers who are selectively targeted.10,12 It is crucial that young drinkers are targeted as it is well known that high consumption in early life leads to chronic abuse later on.
Alcohol retailers would be unlikely to discount alcohol if this led to lower profits; therefore their purpose as with all promotions must be to increase total sales of their products some of which have higher profit margins. At present the public expect alcohol to be on promotion and are under the misconception that they are benefiting. A minimum price of 50p/unit should largely remove the sale of alcohol as a means by which supermarkets attract customers. It is hoped that retailers will respond to this change by introducing price promotions on health foods, such as fruit and vegetables, which would benefit most families financially and lead to an improvement in the nation's health.
Conclusion
Families in Britain have nothing to fear from the introduction of minimum unit prices of alcohol as the majority would be better off. The current policy of low alcohol prices means that responsible drinkers are subsidising the behaviour of the 25% of the population who are drinking at hazardous or harmful levels. The introduction of a 50p/unit minimum price would mean that this sector would be selectively targeted and would pay more for the alcohol they consume thus removing the subsidy they are currently enjoying. Alcohol consumption in this group is therefore likely to fall with substantial advantages to public health, law and order.
Acknowledgements
mysupermarket.co.uk kindly supplied the expenditure figures for trolley purchases in 2008 and Professor Anne Ludbrook provided much helpful advice and a copy of her submission to the Scottish Government on minimum prices.
Conflict of interest
Both authors are members of the UK Alcohol Alliance.
References
- 1.Donaldson L. On the state of public health. London: Department of Health, 2001. [Google Scholar]
- 2.Cabinet Office Strategy Unit. Alcohol harm reduction strategy for England. London: Cabinet Office Strategy Unit, 2004. [Google Scholar]
- 3.Department of Health. Safe. Sensible. Social. The next steps in the National Alcohol Strategy. London: DH, 2007. [Google Scholar]
- 4.HM Revenue and Customs. Alcohol factsheet 2008. www.uktradeinfo.com/index.cfm?task=factalcohol
- 5.North West Public Health Observatory. Indications of public health in the English regions 8: alcohol. Liverpool: NWPHO, 2007. [Google Scholar]
- 6.Department of Health. Reducing alcohol harm: health services in England for alcohol misuse. London: DH, 2008. [Google Scholar]
- 7.Booth A, Brennan A, Meier PS. et al Independent review of the effects of alcohol pricing and promotion. Part A: systematic reviews. Sheffield: School of Health and Related Research, 2008. www.dh.gov.uk/en/Publichealth/Healthimprovement/Alcoholmisuse/DH_085390 [Google Scholar]
- 8.Department of Food and Rural Affairs. Family food in 2006. London: Stationery Office, 2008. [Google Scholar]
- 9.Nielsen AC. Top 100 brands report 2008.
- 10.Brennan A, Purshouse R, Taylor K, Rafia R. Independent review of the effects of alcohol pricing and promotion. Part B: modelling the potential impact of pricing and promotion policies for alcohol in England. Sheffield: School of Health and Related Research, 2008. www.dh.gov.uk/en/Publichealth/Healthimprovement/Alcoholmisuse/DH_085390 [Google Scholar]
- 11.Huang CD. Econometric models of alcohol demand in the United Kingdom. Working paper 140. London: Government Economic Service, 2003. [Google Scholar]
- 12.Room R. Effects of alcohol controls: Nordic research traditions. Drug Alcohol Rev 2004;23:43–53. 10.1080/095952304100001645547 [DOI] [PubMed] [Google Scholar]


