

Abstract
Complex I is a crucial respiratory enzyme that conserves the energy from NADH oxidation by ubiquinone‐10 (Q10) in proton transport across a membrane. Studies of its energy transduction mechanism are hindered by the extreme hydrophobicity of Q10, and they have so far relied on native membranes with many components or on hydrophilic Q10 analogues that partition into membranes and undergo side reactions. Herein, we present a self‐assembled system without these limitations: proteoliposomes containing mammalian complex I, Q10, and a quinol oxidase (the alternative oxidase, AOX) to recycle Q10H2 to Q10. AOX is present in excess, so complex I is completely rate determining and the Q10 pool is kept oxidized under steady‐state catalysis. The system was used to measure a fully‐defined K M value for Q10. The strategy is suitable for any enzyme with a hydrophobic quinone/quinol substrate, and could be used to characterize hydrophobic inhibitors with potential applications as pharmaceuticals, pesticides, or fungicides.
Keywords: electron transport chain, NADH, oxidoreductases, proteoliposomes, quinones
Mitochondrial complex I (NADH:ubiquinone oxidoreductase) is a crucial energy‐transducing respiratory enzyme. It catalyzes NADH oxidation in the matrix and ubiquinone‐10 (Q10) reduction in the inner membrane by a process coupled to energy‐conserving proton transfer across the membrane.1 The mechanism of NADH oxidation by the flavin‐containing active site has been characterized in detail by using soluble electron acceptors. The mechanism of Q10 reduction, an integral part of the unknown coupling mechanism, presents a much greater challenge owing to the extreme hydrophobicity of Q10. Previous studies have addressed the effects of inhibitors2 and mutations in and around the substrate binding site,3, 4 and made use of spectroscopy to search for ubiqsemiquinone intermediates.5 However, they have relied on either Q10 in native membranes5, 6 (which contain many different enzymes, thus complicating spectroscopic and kinetic analyses) or on non‐physiological hydrophilic Q10 analogues such as ubiquinone‐1, ubiquinone‐2 and decylubiquinone (DQ)4, 7 (which must be added in excessive concentrations to maintain steady‐state catalysis and that react adventitiously at the flavin to generate damaging reactive oxygen and semiquinone species8).
Proteoliposomes (PLs) are artificial phospholipid vesicles into which membrane proteins are reconstituted to mimic their natural environment. PLs suitable for kinetic and spectroscopic studies of Q10 reduction by complex I require Q10 in the membrane and co‐reconstitution of an enzyme to reoxidize Q10H2 (ubiquinol‐10, reduced Q10). The alternative oxidase (AOX) is a single‐subunit quinol oxidase that catalyzes Q10H2 oxidation and O2 reduction (but not proton transfer across the membrane).9 Herein, we present a new, self‐assembled respiratory membrane system (termed Q10PLs) that contains mammalian complex I (from Bos taurus), Q10 (its physiological substrate), and AOX (from Trypanosoma brucei brucei; see Scheme 1).
Scheme 1.
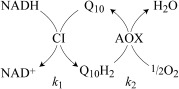
Q10 cycling in the Q10PL membrane. Complex I (CI) oxidizes NADH in the external solution and reduces Q10 to Q10H2 in the membrane; AOX reoxidizes the Q10H2 and reduces O2 to H2O. k 1 and k 2 are the rate constants for catalysis by complex I and AOX, respectively.
Table 1 presents the catalytic properties of Q10PLs formed with a CI/Q10/AOX molar ratio of 1:800:26 (equal masses of complex I and AOX; see the Supporting Information for experimental details). The highest reported turnover numbers for AOX and B. taurus complex I are approximately 500 and 330 s−1, respectively10, 11 (assuming complex I comprises ca. 10 % of the protein in mitochondrial membranes12). The high CI/AOX ratio is intended to ensure that, during steady‐state catalysis, complex I is rate determining and the Q10 pool is oxidized. First, to confirm that complex I is rate determining, Q10PLs were prepared with half the usual amount of complex I (Table S1 in the Supporting Information), and the rate of catalysis was exactly halved. Second, Equation 1 (derived from Scheme 1) indicates that for a 1:26 ratio of complex I and AOX with equal rate constants, the Q10 pool is 96 % oxidized. Finally, complex I in Q10PLs catalyzes at up to 400 s−1 (see Table 1), which is faster than in native membranes (in which Q10H2 reoxidation is rate limiting).
| (1) |
Table 1.
Characterization of a typical Q10PL preparation.
| Reaction | Specific activity[d] [μmol min−1/ mg CI] | Complex I turnover[d] [s−1] | Value determined[d] |
|---|---|---|---|
| 1) NADH:O2 | 18.6±0.51 | 309±9 | – |
| 2) NADH:O2 +gramicidin[a] | 20.4±0.76 | 340±13 | RCR 1.10±0.05 |
| 3) NADH:O2 +alamethicin[b] | 24.6±1.26 | 410±21 | % Oriented 83.0±4.3 |
| 4) NADH:DQ +ala[b]+asco[c] | 7.64±0.73 | 127±12 | Relative activity vs. (3) 31±3 % |
| 5) NADH:DQ +alamethicin[b] | 12.90±0.23 | 215±4 | Relative activity vs. (3) 54±3 % |
Q10PLs allow direct comparison of complex I catalysis using Q10 with catalysis using its hydrophilic analogue DQ.7 Catalysis with 100 μm DQ (molar CI/DQ ratio 1:200,000) was measured with Q10‐free CI/AOX PLs, with AOX inhibited by ascofuranone14 to prevent DQH2 reoxidation. Complex I turnover was three times slower than with Q10 (127 vs. 410 s−1, see Table 1). However, the rate increased to 215 s−1 when AOX was allowed to oxidize DQH2 in the membrane, which matches the rate of NADH:DQ oxidoreduction by the detergent‐solubilized complex I used to prepare the (Q10)PLs (233±53 s−1), and also the rate from (Q10)PLs resolubilized by detergent addition. Therefore, steady‐state reduction of DQ by complex I in (Q10)PLs is hindered by accumulation of DQH2 in the membrane and its slow exchange for DQ across the membrane interface. Our results highlight three important advantages of a reconstituted Q10 system for studying the quinone chemistry of complex I: the rapid kinetics of Q10 reduction, the physiological relevance of Q10, and the simplicity of having all of the Q10 species confined to the membrane with no exchange across the membrane interface.
There are two well‐established methods for assessing proton‐motive force (Δp) formation by respiratory enzymes in PLs, a central requirement for mechanistic studies. First, substantial quenching of the fluorescence of 9‐amino‐6‐chloro‐2‐methoxyacridine (ACMA) during NADH oxidation by Q10PLs indicates the formation of a substantial ΔpH (Figure 1 A).15 Second, the respiratory control ratio (RCR) is the ratio of the coupled and uncoupled rates of catalysis: Δp opposes catalysis, so when an “uncoupler” is used to dissipate Δp, the rate increases. The RCR value for NADH oxidation by Q10PLs (1.1, 4 H+ translocated per NADH) is low compared to values reported for submitochondrial particles (3.0–5.5,11, 12, 16 10 H+ per NADH for complexes I, III, and IV) and complex I containing PLs measured using DQ (2.2–4.5,17, 18 4 H+ per NADH) However, lower values are typical for succinate oxidation by SMPs (1.6–3.2,11, 12, 16 6 H+ per succinate from complexes II, III and IV), and the highest value from inverted Escherichia coli vesicles that are known to sustain Δp≈160 mV19 is 1.720 (6 H+ per NADH, from complex I and an ubiquinol oxidase). Higher RCR values are usually taken to indicate “better coupled” vesicles, but the values are also affected by the enzyme activity and configuration. More highly active or tightly packed proton‐pumping enzymes are better able to compete with proton leak back across the membrane, so they push Δp higher. During steady‐state catalysis, proton leak and translocation are equal and opposite: because leak increases with Δp,21 the more active or packed enzyme reaches a higher Δp but displays a lower RCR. Therefore, it is not currently possible to quantify the Δp sustained by complex I in Q10PLs. The pore‐forming antibiotic alamethicin13 was used in all subsequent experiments to dissipate Δp and prevent it from confounding the results.
Figure 1.
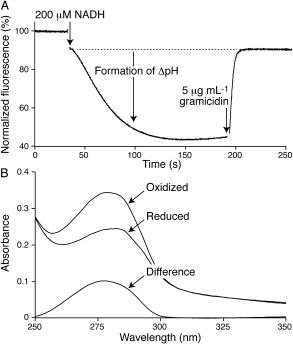
Analyses of ΔpH formation and Q10 concentration in Q10PLs. A) Formation of ΔpH across the PL membrane is demonstrated by quenching of ACMA fluorescence. Gramicidin collapses Δp and the fluorescence returns to its starting value. Conditions: 4 μg mL−1 complex I and 6 μg mL−1 AOX in Q10PLs containing ca. 20 nmol Q10/mg phospholipid in 10 mm Tris‐SO4 (pH 7.5), 50 mm KCl, 75 mm KNO3, and 0.5 μm ACMA, 32 °C. B) Spectroscopic determination of Q10 concentration in a Q10PL preparation. The spectra are from Q10PLs that have been solubilized with 1 % sodium dodecyl sulfate (SDS) before (oxidized) and after (reduced) addition of 1.5 mm KBH4 to reduce the Q10 to Q10H2. The intensity of the difference spectrum at 275 nm denotes the Q10 concentration. Concentrations present: 11.8 nm complex I, 0.6 μm AOX, 0.472 mg mL−1 phospholipid, and 6.88 μm Q10 (calculated).
Q10PLs are a unique respiratory system because all of their components are known and can be quantified (see the Supporting Information). Complex I concentrations were quantified using the flavin‐catalyzed NADH:APAD+ oxidoreduction reaction,22 and AOX concentrations were taken to be the difference between the total protein and complex I concentrations. Phospholipid concentrations were quantified by phosphate determination23 and Q10 concentrations were determined spectroscopically by measuring the absorbance change upon addition of KBH4 (a reducing agent, see Figure 1 B).24 Table S1 shows the values from a set of Q10PLs containing different Q10 concentrations. Finally, density‐gradient centrifugation was used to check the homogeneity of a high‐Q10 preparation of Q10PLs. Two distinct bands were observed: the denser band contained approximately 80 % of the phospholipid and roughly 90 % of the complex I. The vesicles in the less dense band may contain less complex I because they became less saturated with detergent during reconstitution. Crucially, both bands contained the same phospholipid/Q10 ratio, so the minor inhomogeneity present was not considered significant.
Figure 2 shows the rate of NADH:O2 oxidoreduction by complex I in Q10PLs as a function of Q10 concentration, defined using the phospholipid concentration as a proxy for the hydrophobic/membrane phase volume. The complex I/Q10 ratio is fixed in the preparation, so standard solution kinetic analyses are not possible and each point is from an independent preparation. The fact that the preparation with half the usual complex I content has a matching rate of turnover confirms that the rate is set only by the Q10 concentration (complex I is diluted in the membrane but the Q10 concentration is constant). The data in Figure 2 were fit to the Michaelis–Menten equation, giving a K M (Q10) value for B. taurus complex I of 3.9 nmol/mg phospholipid (approximately one Q10 molecule per 300 phospholipids). To our knowledge this is the first steady‐state K M measurement for an enzyme and its native quinone, for which the quinone substrate pool is held fully oxidized in every condition tested. Previously, elegant single‐turnover kinetics on Rhodobacter complex III in chromatophores defined K M(Q10H2)=3–5 Q10H2 per complex, but using a “collisional mechanism” in which the rate is determined by [Q10H2] and unaffected by [Q10].26 For complex I, a value of K M(Q10)=2.4±1.7 nmol/mg protein (consistent with our value) was reported using pentane‐extracted mitochondria (but with the redox state of the Q pool undefined).27
Figure 2.
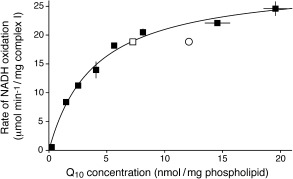
Q10 Michaelis–Menten curve for B. taurus complex I. The rates of NADH oxidation from different Q10PL preparations are plotted against the Q10 concentrations in the membranes and fit to the Michalis–Menten equation with K M=3.94 nmol/mg phospholipid and k cat=29.9 μmol min−1/mg complex I=500 s−1. Open square: Q10PL preparation with half the standard amount of complex I. Open circle: complex I in B. taurus mitochondrial membranes (rate of catalysis enhanced by additional cytochrome c 25). Conditions: 200 μm NADH, 15 μg mL−1 alamethicin (Q10PLs only), 10 mm Tris‐SO4 (pH 7.5), and 50 mm KCl, 32 °C. Values are the mean±S.E.M. (n=3).
Figure 2 also shows our value for complex I turnover in B. taurus heart mitochondrial membranes that contain approximately 12 nmol Q10/mg phospholipid (ca. 60 Q10 per complex I; see Table S2). Because the membrane Q10 concentration is three times the complex I K M value, respiratory‐chain turnover in membranes is not limited at complex I by Q10 pool concentration. The membrane data point in Figure 2 falls below the curve owing to rate‐limiting contributions from complexes III and IV (which also render the Q10 pool partially reduced).
The K M (Q10) value of 3.9 nmol Q10/mg phospholipid equates to approximately 3.9 mm Q10 in the membrane phase because 1 mg of phospholipid has a volume of around 1 μL.28 The value is high in comparison to values for enzymes that act on soluble substrates, but Q10 is restricted to diffusion only within the two‐dimensional membrane bilayer, and the K M tells us little about K D (only that K D≤3.9 mm). With such a high local Q10 concentration, there is no pressure on complex I to evolve a lower K M, and matching K M to concentration may help the system respond to changing conditions. Furthermore, the high concentration creates sufficient capacity to buffer changes to the Q10 pool potential, and may facilitate antioxidant reactions that rely on the (uncatalyzed) second‐order reactions of Q10 and Q10H2 with radical species.29
Q10PLs are independent respiratory units formed by self‐assembly from a mixture of phospholipids, Q10, complex I, and AOX. Complex I (from B. taurus heart) and AOX (from T. brucei) originate from very different sources and assemble independently into Q10PLs, thus making non‐physiological supercomplex assemblies highly unlikely and imposing the fluid mosaic model30 on the membrane. The rapid rates of catalysis observed support the interpretation that supercomplexes are not necessary for efficient catalysis and argue further against a role for Q10 channeling within them.25
Self‐assembled artificial respiratory chains are suitable for biophysical studies of any respiratory or photosynthetic enzyme that uses a membrane‐bound quinone substrate. Historically, they were used to demonstrate the construction of respiratory chains from individual enzymes and Q10, but their capabilities have not (with very few exceptions31) been exploited for detailed mechanistic studies. Furthermore, many quinone antagonists are already used as pharmaceuticals or pesticides,32, 33 and bioenergetic enzymes specific to parasites and phytopathogenic fungi (including the alternative NADH dehydrogenase and AOX) are being investigated as drug targets.34, 35 Our self‐assembled Q10PL system enables candidate drugs and inhibitors to be competed against physiologically relevant quinone substrates to provide properly defined and robust inhibitor dissociation constants for translational research.
Supporting information
As a service to our authors and readers, this journal provides supporting information supplied by the authors. Such materials are peer reviewed and may be re‐organized for online delivery, but are not copy‐edited or typeset. Technical support issues arising from supporting information (other than missing files) should be addressed to the authors.
miscellaneous_information
Acknowledgements
This research was funded by The Medical Research Council (grant U105663141 to J.H.), BBSRC (BB/L022915/1 to A.L.M.) and the University of Sussex.
References
- 1. Hirst J., Annu. Rev. Biochem. 2013, 82, 551–575. [DOI] [PubMed] [Google Scholar]
- 2. Ito T., Murai M., Morisaka H., Miyoshi H., Biochemistry 2015, 54, 3677–3686. [DOI] [PubMed] [Google Scholar]
- 3. Sinha P. K., Castro‐Guerrero N., Patki G., Sato M., Torres‐Bacete J., Sinha S., Miyoshi H., Matsuno‐Yagi A., Yagi T., Biochemistry 2015, 54, 753–764. [DOI] [PMC free article] [PubMed] [Google Scholar]
- 4. Tocilescu M. A., Fendel U., Zwicker K., Kerscher S., Brandt U., J. Biol. Chem. 2007, 282, 29514–29520. [DOI] [PubMed] [Google Scholar]
- 5. Vinogradov A. D., Sled V. D., Burbaev D. S., Grivennikova V. G., Moroz I. A., Ohnishi T., FEBS Lett. 1995, 370, 83–87. [DOI] [PubMed] [Google Scholar]
- 6. Kröger A., Klingenberg M., Eur. J. Biochem. 1973, 34, 358–368. [DOI] [PubMed] [Google Scholar]
- 7. Estornell E., Fato R., Pallotti F., Lenaz G., FEBS Lett. 1993, 332, 127–131. [DOI] [PubMed] [Google Scholar]
- 8. King M. S., Sharpley M. S., Hirst J., Biochemistry 2009, 48, 2053–2062. [DOI] [PMC free article] [PubMed] [Google Scholar]
- 9. Shiba T., Kido Y., Sakamoto K., Inaoka D. K., Tsuge C., Tatsumi R., Takahashi G., Balogun E. O., Nara T., Aoki T., et al., Proc. Natl. Acad. Sci. USA 2013, 110, 4580–4585. [DOI] [PMC free article] [PubMed] [Google Scholar]
- 10. Kido Y., Sakamoto K., Nakamura K., Harada M., Suzuki T., Yabu Y., Saimoto H., Yamakura F., Ohmori D., Moore A., et al., Biochim. Biophys. Acta 2010, 1797, 443–450. [DOI] [PubMed] [Google Scholar]
- 11. Vinogradov A. D., Grivennikova V. G., Biochemistry 2005, 70, 120–127. [DOI] [PubMed] [Google Scholar]
- 12. Pryde K. R., Hirst J., J. Biol. Chem. 2011, 286, 18056–18065. [DOI] [PMC free article] [PubMed] [Google Scholar]
- 13. Gostimskaya I. S., Grivennikova V. G., Zharova T. V., Bakeeva L. E., Vinogradov A. D., Anal. Biochem. 2003, 313, 46–52. [DOI] [PubMed] [Google Scholar]
- 14. Nihei C., Fukai Y., Kawai K., Osanai A., Yabu Y., Suzuki T., Ohta N., Minagawa N., Nagai K., Kita K., FEBS Lett. 2003, 538, 35–40. [DOI] [PubMed] [Google Scholar]
- 15. Grzesiek S., Otto H., Dencher N. A., Biophys. J. 1989, 55, 1101–1109. [DOI] [PMC free article] [PubMed] [Google Scholar]
- 16. Kotlyar A. B., Vinogradov A. D., Biochim. Biophys. Acta Bioenerg. 1990, 1019, 151–158. [DOI] [PubMed] [Google Scholar]
- 17. Galkin A., Dröse S., Brandt U., Biochim. Biophys. Acta Bioenerg. 2006, 1757, 1575–1581. [DOI] [PubMed] [Google Scholar]
- 18. Roberts P. G., Hirst J., J. Biol. Chem. 2012, 287, 34743–34751. [DOI] [PMC free article] [PubMed] [Google Scholar]
- 19. Reenstra W. W., Patel L., Rottenberg H., Kaback H. R., Biochemistry 1980, 19, 1–9. [DOI] [PubMed] [Google Scholar]
- 20. Burstein C., Tiankova L., Kepes A., Eur. J. Biochem. 1979, 94, 387–392. [DOI] [PubMed] [Google Scholar]
- 21. Nicholls D. G., Eur. J. Biochem. 1974, 50, 305–315. [DOI] [PubMed] [Google Scholar]
- 22. Yakovlev G., Hirst J., Biochemistry 2007, 46, 14250–14258. [DOI] [PubMed] [Google Scholar]
- 23. Ames B. N., Methods Enzymol. 1966, 8, 115–118. [Google Scholar]
- 24. Covian R., Trumpower B. L., J. Biol. Chem. 2005, 280, 22732–22740. [DOI] [PubMed] [Google Scholar]
- 25. Blaza J. N., Serreli R., Jones A. J. Y., Mohammed K., Hirst J., Proc. Natl. Acad. Sci. USA 2014, 111, 15735–15740. [DOI] [PMC free article] [PubMed] [Google Scholar]
- 26. Venturoli G., Fernández‐Velasco J. G., Crofts A. R., Melandri B. A., Biochem. Biophys. Acta 1986, 851, 340–352. [DOI] [PubMed] [Google Scholar]
- 27. Estornell E., Fato R., Castelluccio C., Cavazzoni M., Parenti Casteli G., Lenaz G., FEBS Lett. 1992, 311, 107–109. [DOI] [PubMed] [Google Scholar]
- 28. Newman G. C., Huang C., Biochemistry 1975, 14, 3363–3370. [DOI] [PubMed] [Google Scholar]
- 29. James A. M., Smith R. A. J., Murphy M. P., Arch. Biochem. Biophys. 2004, 423, 47–56. [DOI] [PubMed] [Google Scholar]
- 30. Singer S. J., Nicolson G. L., Science 1972, 175, 720–731. [DOI] [PubMed] [Google Scholar]
- 31. Venturoli G., Gabellini N., Oesterhelt D., Melandri B. A., Eur. J. Biochem. 1990, 189, 95–103. [DOI] [PubMed] [Google Scholar]
- 32. Rich P. R., Pestic. Sci. 1996, 47, 287–296. [Google Scholar]
- 33. Wallace K. B., Starkov A. A., Annu. Rev. Pharmacol. Toxicol. 2000, 40, 353–388. [DOI] [PubMed] [Google Scholar]
- 34. Weinstein E. A., Yano T., Li L. S., Avarbock D., Avarbock A., Helm D., McColm A. A., Duncan K., Lonsdale J. T., Rubin H., Proc. Natl. Acad. Sci. USA 2005, 102, 4548–4553. [DOI] [PMC free article] [PubMed] [Google Scholar]
- 35. Saimoto H., Kido Y., Haga Y., Sakamoto K., Kita K., J. Biochem. 2013, 153, 267–273. [DOI] [PubMed] [Google Scholar]
Associated Data
This section collects any data citations, data availability statements, or supplementary materials included in this article.
Supplementary Materials
As a service to our authors and readers, this journal provides supporting information supplied by the authors. Such materials are peer reviewed and may be re‐organized for online delivery, but are not copy‐edited or typeset. Technical support issues arising from supporting information (other than missing files) should be addressed to the authors.
miscellaneous_information