

Abstract
Please cite this paper as: Pearce et al. (2011) Understanding mortality in the 1918–1919 influenza pandemic in England and Wales. Influenza and Other Respiratory Viruses 5(2), 89–98.
Background The causes of recurrent waves in the 1918–1919 influenza pandemic are not fully understood.
Objectives To identify the risk factors for influenza onset, spread and mortality in waves 1, 2 and 3 (summer, autumn and winter) in England and Wales in 1918–1919.
Methods Influenza mortality rates for 333 population units and putative risk factors were analysed by correlation and by regressions weighted by population size and adjusted for spatial trends.
Results For waves 1 and 3, influenza mortality was higher in younger, northerly and socially disadvantaged populations experiencing higher all‐cause mortality in 1911–1914. Influenza mortality was greatest in wave 2, but less dependent on underlying population characteristics. Wave duration was shorter in areas with higher influenza mortality, typically associated with increasing population density. Regression analyses confirmed the importance of geographical factors and pre‐pandemic mortality for all three waves. Age effects were complex, with the suggestion that younger populations with greater mortality in wave 1 had lesser mortality in wave 2.
Conclusions Our findings suggest that socially disadvantaged populations were more vulnerable, that older populations were partially protected by prior immunity in wave 1 and that exposure of (younger) populations in one wave could protect against mortality in the subsequent wave. An increase in viral virulence could explain the greater mortality in wave 2. Further modelling of causal processes will help to explain, in considerable detail, how social and geographical factors, season, pre‐existing and acquired immunity and virulence affected viral transmission and pandemic mortality in 1918–1919.
Keywords: Immunity, influenza, mortality, social, virulence, wave
Introduction
The influenza pandemic of 1918–1919, now known to have been caused by an H1N1 virus, was characterised by global spread, multiple waves and high mortality. The disease was particularly severe among younger adults, possibly because they were immunologically naïve to the new virus, while older adults had some protective immunity. 1 The Great War (1914–1918) affected population mixing, contributing to widespread transmission of influenza in most parts of England and Wales, where three well‐defined waves were described. 2 The first wave was unusual, in that it began in summer in late June 1918, rather than in the colder months typical of inter‐pandemic (seasonal) influenza. 3 , 4 Although this out‐of‐season onset indicates an unusual level of population susceptibility, the mortality rate was relatively low at around 0·03%. 2 The autumn wave (wave 2) was most severe in terms of clinical complications and mortality, 3 with an average mortality rate of 0·27% across regions of England and Wales. 5 The third (winter) wave was less severe, with an average mortality of 0·1%. 5
Areas experiencing higher rates of all‐cause mortality in earlier years typically experienced higher mortality from pandemic influenza, 3 , 6 presumably reflecting social disadvantage. 6 , 7 Pandemic mortality in other European cities was also exacerbated by overcrowding and poverty. 8 Variation in pandemic mortality between cities likely reflect the influence of social, geographical and climatic factors affecting viral spread, changes in viral virulence, as well as effects of population immunity. 9 , 10 In the United States, public health interventions designed to reduce viral transmission apparently reduced pandemic mortality in some cities. 6 However, there is no evidence that similar social distancing measures were formally introduced in England and Wales in 1918–1919. 5
We previously showed that attack rates for waves 1 and 2 of pandemic influenza in 1918–1919 in RAF camps in the UK could be explained by a model incorporating prior immunity, a high rate of asymptomatic infection, and waning of immunity (or antigenic drift of the virus) between waves. 11 To better understand how pandemic spread and mortality was affected by social and geographical factors, and by population immunity, we now re‐analyse 1918–1919 influenza mortality rates from 333 cities and rural boroughs in England and Wales for each of the three waves.
Methods
Sources of data
We used weekly influenza‐specific mortality counts and annualised rates/1000 population for the weeks ending 29 June 1918 to 10 May 1919, collated by the Registrar General’s Office in 1920. 12 Mortality data were available for 333 administrative units (“populations”): 29 London boroughs, 84 metropolitan boroughs, 77 urban districts, 82 county boroughs, and 61 others, comprising county remainders or counties with no specified urban centre. 13 Population totals for each unit were calculated from the cumulative rates and numbers of deaths over the 46‐week period. Acreages were obtained from the decennial 1931 census for England and Wales, 14 and population density was calculated as persons/acre, further categorised into quintiles and modelled as an ordinal variable. All‐cause mortality rates/1000, age‐standardised by the direct method, were available for 329 matched administrative units, 15 and averaged over 1911–1914 for men and women combined. Also available from this source was the “standardising factor” for each population, calculated as the ratio of age‐standardised to crude death rates. 15 In the absence of population age structures within administrative units, we used this factor to represent variation in age structure between administrative unit populations, with higher values indicating younger populations. Latitude and longitude coordinates assigned to geographical areas, such that coordinates approximated county centroids and urbanised areas were within designated historical county boundaries, were obtained from the Lat–Long Finder website (Map Data© 2010 Tele Atlas, Powered by Google, URL http://www.satsig.net/maps/lat‐long‐finder.htm). The Average of Ward Scores from the Indices of Deprivation 2000: District Level Presentations 16 for England was used as an indicator of current socioeconomic deprivation at district level [higher scores indicating greater deprivation], and matched by name to 62/82 (76%) of 1918–1919 counties as identified in Johnson. 12 We used digitised historical 1921 county boundary data for England and Wales, with geographical coordinate system OSGB 1936 in ESRI Shape File format 17 , 18 to assess coordinates of geographical areas and outline contour plots of week of onset and influenza mortality.
Statistical analysis
The minimum total deaths between waves 1 and 2 occurred in week 12 (week ending 14 September 1918) and in week 31 (week ending 25 January 1919) between waves 2 and 3 (Figure 1). For each administrative unit, cumulative deaths for wave 1 were summed from the start of data collection to the weekly minimum deaths within ±1 week of the overall minimum deaths between waves 1 and 2. Cumulative deaths for wave 2 were summed from these minima to the weekly minimum deaths within ±1 week of the overall minimum between waves 2 and 3; and for wave 3, from these minima to the end of data collection. Waves were thus defined to include all recorded influenza deaths between data collection start and end points, with between‐wave demarcation defined by minima for each administrative unit population. Cumulative influenza mortality rates for each wave were calculated as the total deaths occurring/1000 population, and a measure of overall mortality was obtained by summing across waves. For each administrative unit, wave onset was defined as the week marking the 10th percentile of deaths from wave commencement; and wave duration was defined as the number of weeks between the 10th and 90th percentile of deaths, inclusive, per wave. Between‐wave intervals were calculated as the number of weeks between the 50th percentile deaths for each wave.
Figure 1.
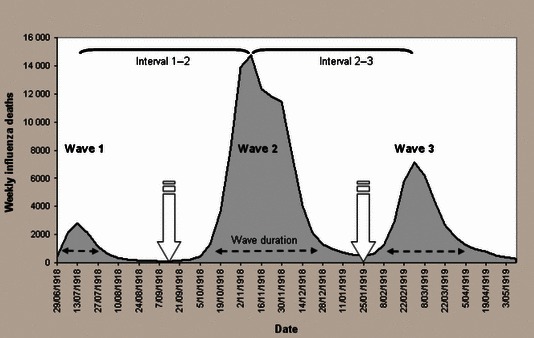
Time series plot of influenza mortality between the weeks ending 29 June 1918 and 10 May 1919 in England and Wales, indicating schematically weeks of overall minimum deaths  , wave duration
  and between‐wave intervals
  for each of 333 administrative units. Source: Johnson 2001a & UK data Archive.
Geographical spread of influenza was assessed by correlating latitude and longitude coordinates for each population with measures of timing and mortality in each wave. Unadjusted analyses used non‐parametric Spearman coefficients. Between‐wave assessments used anova (Friedman’s test) and the Wilcoxon signed‐rank test for matched data. Multivariate linear regression models, by ordinary least squares, 2 used population size as an analytical weight. Quadratic trend surfaces (first‐ and second‐order terms in latitude and longitude, and the interaction of first‐order terms) were fitted in regression models to represent spatial trends (see Table 4). Standardised beta coefficients were reported to allow comparison of contributions of individual explanatory variables. 19 Statistical analyses were performed using Stata * (version 10.1 “intercooled”, Stata Corporation, College Station, TX, USA), and variables describing wave characteristics were derived using MATLAB R2009a (Mathworks, Natwich, MA). Contour plots of cumulative influenza mortality and week of onset, clipped to digitised map boundaries of England and Wales, were produced by applying a radial basis function to a raster generated by applying cubic inverse distance weighted interpolation to the non‐uniformly spaced data points using ArcInfo version 9.3 (Environmental Systems Research Institute, Inc., California, USA).
Table 4.
Weighted regression model output for predictors of cumulative influenza mortality/1000 by wave (N = 329)
| Dependent | Predictors | Degrees of freedom (d.f.) | Proportion variance (R 2) explained | Linear regression model output | |||||
|---|---|---|---|---|---|---|---|---|---|
| Component | Joint | Shared | β (95% CI) | Std. Beta | P‐value | *Likelihood ratio test chi‐squared (P‐value) | |||
| **Wave 1 Cumulative influenza mortality/1000 | Geographical location | 5 | 43·2% | 68·6% (d.f. = 9) | 38·9% | 195·1 (<0·001) | |||
| ***Risk factors | 4 | 64·3% | |||||||
| Pre‐pandemic mortality | 0·10 (0·07–0·13) | 0·38 | <0·001 | ||||||
| Younger age | 3·39 (2·57–4·21) | 0·38 | <0·001 | ||||||
| Week of onset | −0·13 (−0·20 to −0·07) | −0·14 | <0·001 | ||||||
| Population density | −0·06 (−0·10 to −0·02) | −0·15 | 0·001 | ||||||
| **Wave 2 Cumulative influenza mortality/1000 | Geographical location | 5 | 17·5% | 27·8% (d.f. = 9) | −1·2% | 43·9 (<0·001) | |||
| ***Risk factors | 4 | 9·1% | |||||||
| Pre‐pandemic mortality | 0·02 (0·004 – 0·03) | 0·19 | 0·012 | ||||||
| Younger age | −2·95 (−3·83 to −2·06) | −0·87 | <0·001 | ||||||
| **Wave 1 mortality | 1·16 (0·72–1·61) | 3·12 | <0·001 | ||||||
| †Younger age × **Wave 1 mortality | −1·11 (−1·55 to −0·66) | −2·62 | <0·001 | ||||||
| **Wave 3 Cumulative influenza mortality/1000 | Geographical location | 5 | 34·8% | 39·7% (d.f. = 9) | 24·1% | 25·7 (<0·001) | |||
| ***Risk factors | 4 | 29·0% | |||||||
| Pre‐pandemic mortality | 0·04 (0·02–0·05) | 0·25 | <0·001 | ||||||
| Younger age | −0·65 (−1·31 to 0·01) | −0·14 | 0·053 | ||||||
| ††Wave 1 mortality** | 0·07 (−0·01 to 0·15) | 0·13 | 0·076 | ||||||
| ††Wave 2 mortality** | −0·13 (−0·27 to 0·01) | −0·09 | 0·066 | ||||||
*Likelihood ratio test comparing model with quadratic trend surface only with model with additional risk factors.
**Natural logarithmic transform (LN).
***Risk factors adjusted for geographical variation modelled as a quadratic trend surface using latitude and longitude coordinates to represent location.
†Likelihood ratio test (LR) for model with interaction term compared to model without: LR χ2 23·4, P < 0·001.
††Interaction terms **Wave 1 mortality × younger age and **Wave 2 mortality × younger age were not statistically significant; LR χ2 0·49, P = 0·782.
Results
Characteristics of the three waves are summarised in Table 1. Wave duration increased significantly over successive waves (Friedman’s and Wilcoxon signed‐rank tests P < 0·001). Cumulative mortality was significantly higher in wave 2 than in waves 1 and 3 (P < 0·001), and the interval between waves 1 and 2 was significantly longer than between waves 2 and 3 (P < 0·001). Pre‐pandemic mortality was strongly associated with cumulative pandemic influenza mortality in waves 1 and 3 (Table 2, Figure 2), and overall (ρ = 0·44, P < 0·001). Influenza mortality tended to be higher in younger populations in waves 1 and 3, but the age trend was reversed in wave 2. Populations with higher influenza mortality rates in wave 1 also had higher rates in wave 3, although rates in these waves were not significantly correlated with rates in wave 2 (Table 2). Early wave onset was associated with higher wave mortality for wave 1, but not for waves 2 and 3. High wave 1 mortality was also associated with delayed onset of wave 2. Wave 2 had the highest average influenza mortality overall, but for all three waves, duration was shorter in populations with higher influenza mortality (Table 2). Higher wave 1 mortality delayed onset of wave 2, while wave 3 mortality increased in populations with shorter intervals between waves 2 and 3 (Table 2).
Table 1.
Wave characteristics over the 46‐week period of data collection during the 1918–1919 influenza pandemic for individual 333 administrative units in England and Wales
| Wave 1* | Wave 2 | Wave 3 | |
|---|---|---|---|
| Wave timing by administrative unit (earliest week of 10th percentile deaths to last week of 90th percentile deaths) | 29 June 1918 14 September 1918 | 28 September 1918 18 January 1919 | 15 February 1919 10 May 1919 |
| Onset by administrative unit (median, earliest and last weeks of 10th percentile deaths) | 6 July 1918 (29 June – 14 September 1918) | 26 October 1918 (28 September – 23 November 1918) | 15 February 1919 (25 January – 8 March 1919) |
| Duration by administrative unit (weeks from 10th to 90th percentile deaths, inclusive) median (range) | 5 (1, 12) | 7 (4, 17) | 8 (3, 14) |
| Cumulative mortality/1000 by administrative unit median (range) | 0·26 (0·02, 1·42) | 2·80 (0·75, 6·14) | 1·00 (0·18, 3·65) |
| Wave intervals by administrative unit (number of weeks between waves); median (range) | |||
| Waves 1–2 | 17 (8, 23) | – | – |
| Waves 2–3 | – | 16 (12, 22) | – |
Data from: Johnson. 12
*No deaths recorded in 1 administrative unit.
Table 2.
Correlation between cumulative influenza mortality/1000 population and other wave characteristics and potential risk factors investigated for 333 administrative units (Spearman’s correlation coefficient ρ and P‐values)
| Cumulative influenza mortality/1000 | |||
|---|---|---|---|
| Wave 1* | Wave 2 | Wave 3 | |
| Pre‐pandemic mortality** | 0·74 (< 0·001) | 0·07 (0·225) | 0·44 (< 0·001) |
| Younger age**, *** | 0·59 (< 0·001) | −0·16 (0·004) | 0·26 (< 0·001) |
| Population size | −0·06 (0·267) | 0·11 (0·053) | 0·06 (0·270) |
| Population density | 0·16 (0·003) | 0·15 (0·006) | 0·16 (0·003) |
| Cumulative influenza mortality/1000 | |||
| Wave 1 | – | 0·01 (0·930) | 0·42 (< 0·001) |
| Wave 2 | – | – | −0·06 (0·288) |
| Onset | |||
| Wave 1 | −0·15 (0·006) | – | – |
| Wave 2 | 0·32 (<0·001) | 0·09 (0·087) | – |
| Wave 3 | – | −0·10 (0·058) | −0·06 (0·319) |
| Duration | |||
| Wave 1 | −0·16 (0·003) | – | – |
| Wave 2 | – | −0·42 (<0·001) | – |
| Wave 3 | – | – | −0·32 (<0·001) |
| Interval | |||
| Waves 1–2 | 0·50 (<0·001) | 0·03 (0·539) | – |
| Waves 2–3 | – | −0·01 (0·898) | −0·26 (<0·001) |
Figure 2.
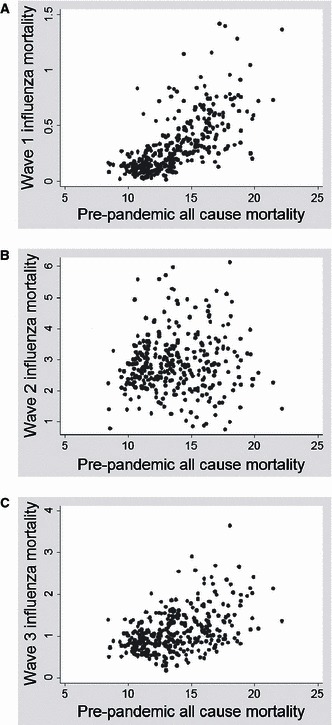
Cumulative influenza mortality/1000 population in waves 1 (A), 2 (B) and 3 (C) plotted against pre‐pandemic all‐cause mortality/1000.
Populations in the north and west tended to be younger in age with higher rates of pre‐pandemic mortality (Table 3). A similar geographical trend was evident for cumulative influenza mortality in waves 1 and 3, with higher mortality evident in largely corresponding geographical locations in the north‐west of England and Wales (Table 3, Figure 3). In contrast, absolute mortality in wave 2 was greater in eastern populations. Complex patterns of onset are evident in all three waves, with a clear directional spread (northward) only in wave 2, notably later in areas where wave 1 mortality was higher, and earlier where wave 1 mortality was lower (2, 3, 3, 4). Wave duration decreased with latitude in all waves. In contrast, the interval between waves 1 and 2 increased northward while the interval between waves 2 and 3 increased southward (Table 3, Figure 5).
Table 3.
Correlations of risk factors and wave characteristics with latitude and longitude (Spearman’s correlation coefficientρ and P‐value)
| Latitude | Longitude | |
|---|---|---|
| Pre‐pandemic mortality* | 0·56 (<0·001) | −0·40 (<0·001) |
| Younger age* | 0·37 (<0·001) | −0·26 (<0·001) |
| Population size | −0·09 (0·123) | 0·06 (0·312) |
| Population density | −0·05 (0·385) | 0·24 (<0·001) |
| Onset | ||
| Wave 1** | 0·003 (0·957) | −0·18 (0·001) |
| Wave 2 | 0·45 (<0·001) | −0·10 (0·064) |
| Wave 3 | 0·08 (0·154) | −0·18 (<0·001) |
| Cumulative influenza mortality | ||
| Wave 1 | 0·60 (< 0·001) | −0·43 (<0·001) |
| Wave 2 | 0·08 (0·166) | 0·28 (<0·001) |
| Wave 3 | 0·43 (< 0·001) | −0·28 (<0·001) |
| Duration | ||
| Wave 1** | −0·21 (<0·001) | 0·01 (0·808) |
| Wave 2 | −0·15 (0·006) | −0·11 (0·040) |
| Wave 3 | −0·18 (0·001) | 0·02 (0·714) |
| Interval | ||
| Waves 1**–2 | 0·47 (<0·001) | −0·06 (0·298) |
| Waves 2–3 | −0·38 (<0·001) | 0·01 (0·878) |
Figure 3.
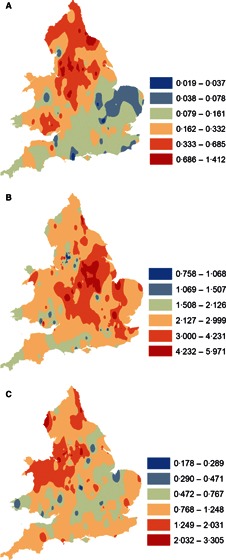
Contour plots of equal ranges of natural logarithmic transforms of cumulative influenza mortality, backtransformed to rates/1000, in waves 1 (A), 2 (B) and 3 (C) in England and Wales.
Figure 4.
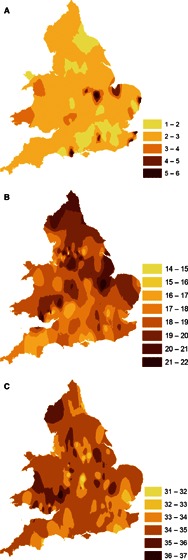
Contour plots of week of onset, numbered by week of data collection, in waves 1 (A), 2 (B) and 3 (C) in England and Wales.
Figure 5.
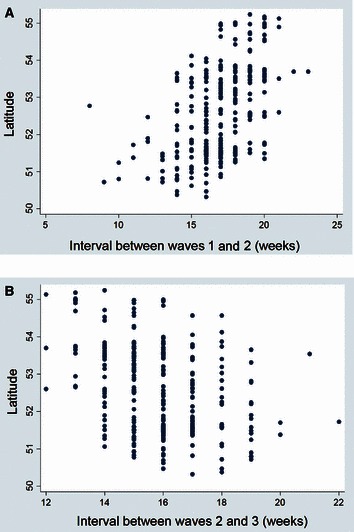
Scatterplots of between‐wave intervals 1–2 (A) and 2–3 (B) against latitude.
Population sizes of administrative units ranged from 10 477 to 1 033 038 (median 50 384) 12 , 13 and areas ranged from 406 to 1 655 571 acres (median 5062). 14 Population density varied from 0·07 to 143 persons/acre (median 9·1 persons/acre). Whereas population size was unrelated to geographical location, population density was significantly correlated with longitude (Table 3). Population density was also correlated with pre‐pandemic all‐cause mortality [ρ (P‐value) 0·37 (<0·001)], but no association was detected with population size [−0·03 (0·625)]. Mortality rates in individual waves were significantly correlated with population density (Table 2), as was overall mortality [0·19 (<0·001)]. However, overall mortality was not correlated with population size [0·03 (0·603)]. For waves 1, 2 and 3, onset occurred earlier in more densely populated areas [−0·25 (<0·001); −0·21 (<0·001); −0·13 (0·020), respectively].
The index of deprivation from the year 2000 for matched areas (n = 62) was correlated with cumulative influenza mortality in waves 1 and 3 in 1918–1919 [ρ (P‐value) 0·41 (0·001) and 0·44 (< 0·001), respectively], but not wave 2 [0·08 (0·516)]. It was also correlated with overall mortality [0·42 (<0·001)], northern latitudes [0·48 (< 0·001)] and, notably, with pre‐pandemic mortality [0·60 (<0·001)].
In the weighted regression analyses for cumulative influenza mortality (Table 4), pre‐pandemic mortality was predictive in all three waves when we fitted a quadratic trend surface (5 d.f.) to extract geographical variance. The model for Wave 1 explains 69% of the variance in influenza mortality, with younger populations at greater risk and the effect of population density modified by covariates. For wave 2 mortality, geographical factors explained much of the variance between populations, with a significant tendency for wave 2 mortality to be reduced in younger populations with higher mortality rates in wave 1 (see discussion). Wave 2 mortality predicted somewhat lower mortality in wave 3. In contrast, wave 1 mortality was positively associated with wave 3 mortality. Population density was not a significant predictor of mortality in waves 2 and 3 when adjusted for the effects of other covariates included in regression models, likely because of shared variance with pre‐pandemic all‐cause mortality in particular.
Discussion
As this study compares data from populations rather than individuals, any conclusions about causal processes involving individuals are subject to ecological bias 20 as were those from earlier related studies. 2 , 5 However, our novel findings from regression analysis used improved measures of wave severity and onset for all three waves, including the milder wave 1, for which, despite the lower mortality rates, we identified previously undocumented social and spatial associations.
A fundamental observation is that influenza mortality during the 1918–1919 pandemic was greater in populations with higher levels of pre‐pandemic all‐cause mortality 3 , 6 (2, 3). This suggests that common factors, most probably linked to social disadvantage 7 , 8 contribute to both influenza mortality and all‐cause mortality. Indeed, Murray et al. 21 found that global mortality from the 1918–1919 pandemic was significantly greater in poorer countries. We thus interpret all‐cause pre‐pandemic mortality as a surrogate for social disadvantage and population vulnerability.
Pre‐pandemic mortality tended to increase in a northerly and westerly direction, so it is not surprising that pandemic influenza mortality showed the same trend in waves 1 and 3 (Table 3). Geographical gradients in wave 2 were inconsistent, possibly because of depletion of the most vulnerable individuals through exposure in wave 1. On this view, the more consistent geographical trend in wave 3 could be because of a waning of protective immunity induced in susceptible individuals in wave 1.
Absolute influenza mortality was greatest in wave 2 (Table 1), possibly because the virus had acquired greater virulence, or because waning humoral immunity, with an inflammatory cytokine response and/or complicating bacterial infections, led to worse clinical outcomes, particularly among young adults. 3 , 22 Wave 3 mortality was reduced compared with wave 2, possibly because of prior immunising exposure, or declining virulence. A decline in virulence over time has been previously invoked to explain why pandemic mortality in Western Samoa in November 1918 was much higher than in nearby American Samoa, where the arrival of the influenza virus was delayed for many months by strict quarantine. 23 Similarly, pandemic mortality was higher in New Zealand, affected from October 1918, than in Australia, where pandemic influenza was excluded until January 1919. 23 , 24 Other factors, including those related to season, could contribute to mortality differences between waves. For example, the winter onset, arguably associated with increased viral exposures, lesser UV exposure, vitamin D deficiency and impaired innate immunity could help to explain why wave 3 mortality was greater than in wave 1. 10 , 25 , 26 Spread and severity of the three waves of the 1918–1919 influenza pandemic were also influenced by wartime privations and changes in population mixing. 2
Spontaneous or imposed social distancing in response to influenza deaths can also limit influenza transmission and bring an outbreak to an earlier end. 6 , 27 Spontaneous, or reactive, social distancing in response to high localised mortality helped to explain the variability in mortality patterns observed across US cities. 6 In our analysis, the onset of wave 2 was somewhat delayed in populations with greater wave 1 mortality (Table 2). Although spontaneous social distancing can explain these findings, they could also be explained by a greater immune protection, as immunising exposures would be expected to increase with population mortality, provided that case fatality did not differ markedly between populations. Although mortality in wave 2 was not predictive of the interval between waves 2 and 3, wave 3 mortality was higher in populations with a shorter interval between waves 2 and 3 (Table 2). This observation is hard to explain in terms of social distancing, whereas it would be expected that populations with lower levels of immunity at the end of wave 2 would have both an earlier onset and higher mortality in wave 3. Within each wave, wave duration was also negatively correlated with wave mortality (Table 2), as might be expected with social distancing. However, the negative correlation is also consistent with greater population immunity leading to slower spread and lesser mortality. The interval between waves 1 and 2 increased with latitude, whereas the wave 2–3 interval decreased with latitude (Figure 5), in part at least because of the south to north spread of wave 2.
At a global level, latitude was not significantly associated with pandemic mortality when adjusted for income. 21 However, at the finer resolution of England and Wales, spatial and temporal dependence of the three waves has been characterised in earlier reports 2 , 5 and in our own analyses (Table 3; 3, 4, 5). Chowell et al. 5 reported that transmissibility was higher and more geographically heterogeneous in wave 2 than in wave 3. The contour plots of onset in successive waves (Figure 4) are consistent with patterns identified by Smallman‐Rayner et al. 2 using 83 London and county boroughs.
Our regression analysis of influenza mortality over 333 populations (Table 4) simplifies highly complex processes depending on social factors, nutrition, environment and co‐morbidities. 8 , 9 , 10 , 21 The best indicator we had for social deprivation and population vulnerability in the 1918–1919 influenza pandemic was all‐cause mortality for the period 1911–1914. We found that the geographical Index of Deprivation, derived as late as 2000, 16 was still strongly correlated with pre‐pandemic mortality, validating our use of it and showing that geographical predictors of social disadvantage and all‐cause mortality have been stable over many decades. 7
Age effects were of particular salience in the regression models. For wave 1, the ‘pandemic signature’ of heightened mortality among younger individuals was observed and younger populations were at greater risk, suggesting that older persons were protected by prior immunity. A more complex scenario during wave 2 is evidenced by the significant negative interaction term between age and wave 1 mortality (Table 4). In areas with lower wave 1 mortality, younger populations were again more severely impacted in wave 2, while the risk of influenza death in the ensuing wave 2 was reduced in areas that experienced higher wave 1 mortality, suggesting that greater exposure in wave 1 served to boost immune protection. Among older populations, however, wave 2 mortality tended to increase with wave 1 mortality, possibly because confounding by population vulnerability overrode any protective effect of prior exposure in this ecological dataset. Wave 1 mortality also predicted increasing wave 3 mortality, again presumably because of confounding owing to increased population vulnerability associated with socioeconomic status, whereas increasing wave 2 mortality predicted lower mortality in wave 3 (Table 4), consistent with the idea of wave‐to‐wave immunological protection. After taking mortality in previous waves into account, the decreased risk of mortality in wave 3 associated with age structure also supports acquired immunity among younger populations. Further, the contour plots (Figure 3) show that the areas with highest absolute mortality in wave 2 tend to differ from wave 3, as would be expected with immune protection.
Although the relatively low mortality rates in wave 1 may not necessarily reflect the severity of this outbreak, our regression model explained a large proportion of the variance across administrative units (Table 4). Further, and despite wave 2 having the highest absolute mortality (Table 1), our regression model explained a lesser proportion of variance in mortality for wave 2 compared with waves 1 and 3 (Table 4). One explanation for this would be that immunity induced by wave 1 tended to neutralise the geographical and social influences on population vulnerability, leaving less real variation between populations to be explained in wave 2. By the time of wave 3, some of the immune protection from wave 1 would have been lost, with populations reverting to their former vulnerable status. An ancillary explanation would be that mortality in wave 2 was dominated more by factors in the virus itself, rather than by factors related to the geography and populations concerned.
Conclusions
These findings build on earlier work 10 , 11 suggesting that population immunity can help to explain the wave‐like behaviour of pandemic influenza in 1918–1919. Although social‐distancing models can also explain some examples of wave‐like behaviour, 28 the very high attack rates seen when influenza reaches previously isolated populations 11 seem to require an immunological explanation. This is not to deny the very important role of social distancing in limiting influenza transmission, particularly in populations that are partially immune, as seen in the 2009 pandemic. 29
We would certainly agree with Barry et al. 30 that immune protection resulting from first‐wave exposure can protect against later pandemic waves. Indeed, we would go further, and suggest that in today’s highly connected world, most populations are partially protected against any future pandemic by the heterosubtypic immunity induced by prior exposure to seasonal strains of influenza. 10 , 11 , 28 In any future pandemics in partially immune populations, high levels of public compliance with social distancing measures, combined with antiviral use, 31 could be sufficient to delay spread sufficiently to allow development and distribution of a targeted vaccine.
The conclusions from this study will inform more definitive modelling of mortality in the three waves of the 1918–1919 pandemic to explore the causal processes generating the data, including the putative effects of immunity from wave to wave, effects of geographical proximity in determining spread, and possible changes in virulence over time. Such model results will greatly enhance our understanding of influenza biology and transmission, and inform the development and implementation of improved interventions.
Acknowledgements
We thank Niall Johnson for advice on urban–rural categorisation of administrative units in the RGdata.XLS dataset. We acknowledge the UK Data Archive for access to the following: the influenza mortality data compiled by Niall Johnson, Crown copyright held jointly with Niall Johnson; and historical boundary data, provided through EDINA UKBORDERS with the support of the ESRC and JISC which uses boundary material which is a copyright of the Great Britain Historic GIS Project (GBHGISP), Portsmouth University, the Crown, the Post Office and the ED‐LINE consortium, while assigning no responsibility to these data providers for further analyses and interpretation. We also acknowledge the GBHGISP for the acreage data (A vision of Britain through time). We acknowledge the Office for National Statistics and the Department of the Environment, Transport and the Regions for access to historical all‐cause mortality data and the Indices of Deprivation, respectively. We also thank the National Health and Medical Research Council (Grant Nos 400588, 454645, and 566908, CDA Grant No 566635, Capacity Building Grant No 358425, and Urgent Research Grant No 628977), the University of Melbourne, and the Murdoch Children’s Research Institute for supporting this research, Christopher McCaw for advice and data access, and Kirsty Bolton for comments on the manuscript.
References
- 1. Taubenberger JK, Morens DM. 1918 Influenza: the mother of all pandemics. Emerg Infect Dis 2006; 12:15–22. [DOI] [PMC free article] [PubMed] [Google Scholar]
- 2. Smallman‐Raynor M, Johnson N, Cliff AD. The spatial anatomy of an epidemic: influenza in London and the county boroughs of England and Wales, 1918–1919. Trans Inst Br Geogr 2002; 27:452–470. [Google Scholar]
- 3. Ministry of Health . Pandemic of Influenza 1918–9. Reports on Public Health and Medical Subjects No 4. London, England: His Majesty’s Stationery Office, 1920. [Google Scholar]
- 4. Nicholson K, Webster R, Hay A. Textbook of influenza. Oxford: Blackwell Science, 1998. [Google Scholar]
- 5. Chowell G, Bettencourt LM, Johnson N, Alonso WJ, Viboud C. The 1918–1919 influenza pandemic in England and Wales: spatial patterns in transmissibility and mortality impact. Proc R Biol Sci 2008; 275:501–509. [DOI] [PMC free article] [PubMed] [Google Scholar]
- 6. Bootsma MC, Ferguson NM. The effect of public health measures on the 1918 influenza pandemic in U.S. cities. Proc Natl Acad Sci USA 2007; 104:7588–7593. [DOI] [PMC free article] [PubMed] [Google Scholar]
- 7. Eames M, Ben‐Shlomo Y, Marmot MG. Social deprivation and premature mortality: regional comparison across England. BMJ 1993; 307:1097–1102. [DOI] [PMC free article] [PubMed] [Google Scholar]
- 8. Mamelund S‐E. A socially neutral disease? Individual social class, household wealth and mortality from Spanish influenza in two socially contrasting parishes in Kristiania 1918–1919 Soc Sci Med 2006; 62:923–940. [DOI] [PubMed] [Google Scholar]
- 9. Miller MA, Viboud C, Balinska M, Simonsen L. The signature features of influenza pandemics – implications for policy. N Engl J Med 2009; 360:2595–2598. Doi: 10.1056/NEJMp0903906. [DOI] [PubMed] [Google Scholar]
- 10. Mathews JD, Chesson JM, McCaw JM, McVernon J. Understanding influenza transmission, immunity and pandemic threats. Influenza Other Respi Viruses 2009; 3:143–149. [DOI] [PMC free article] [PubMed] [Google Scholar]
- 11. Mathews JD, McCaw CT, McVernon J, McBryde ES, McCaw JM. A biological model for influenza transmission: pandemic planning implications of asymptomatic infection and immunity. PLoS ONE 2007; 2:e1220 Doi: 10.1371/journal.pone.0001220. [DOI] [PMC free article] [PubMed] [Google Scholar]
- 12. Johnson N. 1918–1919 Influenza Pandemic Mortality in England and Wales [computer file]. Colchester, Essex: UK Data Archive [distributor], July 2001a. SN: 4350. URL http://www.data‐archive.ac.uk/ (Accessed 29 September 2009).
- 13. Johnson N. User Guide UK Data Archive Study Number 4350. 1918–1919 Influenza Pandemic Mortality in England and Wales. 2001b. URL http://www.data‐archive.ac.uk/ (Accessed 29 September 2009).
- 14. Great Britain Historical GIS Project . A Vision of Britain through time 2009: Census 1931: England and Wales: Series of County Parts, Part I, Table 3: “Population, Acreage, Private Families and Dwellings”. URL http://visionofbritain.org.uk/census/ (Accessed 20 July 2010).
- 15. Office for National Statistics (ONS) . 1911–1914 Births & Deaths by Area, Registrar General’s Annual Statistical Review [CD‐ROM] 2001.
- 16. Department of the Environment, Transport and the Regions . Indices of Deprivation 2000: District Level Presentations. [Communities and Local Government website n.d.] URL http://www.communities.gov.uk/archived/general‐content/communities/indicesofdeprivation/indicesofdeprivation/ (Accessed 30 November 2009).
- 17. Great Britain Historic GIS (GBHGIS) Project . English Local Government Counties, 1921 (AKA Administrative Counties) [computer file]. Edinburgh: EDINA UKBORDERS [distributor]. URL http://borders.edina.ac.uk/ (Accessed 26 November 2009).
- 18. Great Britain Historic GIS (GBHGIS) Project . Welsh Local Government Counties, 1921 (AKA Administrative Counties) [computer file]. Edinburgh: EDINA UKBORDERS [distributor]. URL http://borders.edina.ac.uk/ (Accessed 26 November 2009).
- 19. StataCorp . Stata User’s Guide: Release 10. College Station, TX: StataCorp LP, 2007. [Google Scholar]
- 20. Elliott P, Wartenberg D. Spatial Epidemiology: current approaches and future challenges. Environ Health Perspect 2004; 112:998–1006. [DOI] [PMC free article] [PubMed] [Google Scholar]
- 21. Murray CJL, Lopez AD, Chin B, Feehan D, Hill KH. Estimation of potential global pandemic influenza mortality on the basis of vital registry data from the 1918–20 pandemic: a quantitative analysis. Lancet 2006; 368:2211–2218. [DOI] [PubMed] [Google Scholar]
- 22. Ahmed R, Oldstone MBA, Palese P. Protective immunity and susceptibility to infectious diseases: lessons from the 1918 influenza pandemic. Nat Immunol 2007; 8:1188–1193. [DOI] [PMC free article] [PubMed] [Google Scholar]
- 23. Crosby A. America’s forgotten pandemic: the influenza of 1918. New York: Cambridge University Press, 2003. [Google Scholar]
- 24. Rice G. Black November. The 1918 Influenza Epidemic in New Zealand. Christchurch, New Zealand: Allen and Unwin, 2005. [Google Scholar]
- 25. Cannell JJ, Zasloff M, Garland CF, Scragg R, Giovannucci E. On the epidemiology of influenza. Virol J 2008; 5:29 Doi: 10.1186/1743‐422X‐5‐29. [DOI] [PMC free article] [PubMed] [Google Scholar]
- 26. Lowen AC, Mubareka S, Steel J, Palese P. Influenza virus transmission is dependent on relative humidity and temperature. PLoS Pathog 2007; 3:1470–1476. [DOI] [PMC free article] [PubMed] [Google Scholar]
- 27. Caley P, Philp DJ, McCracken K. Quantifying social distancing arising from pandemic influenza. J R Soc Interface 2008; 5:631–639. [DOI] [PMC free article] [PubMed] [Google Scholar]
- 28. Mathews JD, McBryde ES, McVernon J, Pallaghy PK, McCaw JM. Prior immunity helps to explain wave‐like behaviour of pandemic influenza in 1918–9. BMC Infect Dis 2010; 10:128. [DOI] [PMC free article] [PubMed] [Google Scholar]
- 29. McCaw JM, McVernon J, McBryde ES, Mathews JD. Influenza: accounting for prior immunity. Science (Letters) 2009; 325:1071 Doi: 10.1126/science.325_1071a. [DOI] [PubMed] [Google Scholar]
- 30. Barry JM, Viboud C, Simonsen L. Cross‐protection between successive waves of the 1918–1919 influenza pandemic: epidemiological evidence from US Army camps and from Britain. J Infect Dis 2008; 198:1427–1434. [DOI] [PMC free article] [PubMed] [Google Scholar]
- 31. Balinska M, Rizzo C. Behavioural responses to influenza pandemics: What do we know? PLoS Curr. 2009. September 9; 1: RRN1037. doi:10.1371/currents.RRN1037 [DOI] [PMC free article] [PubMed] [Google Scholar]