

Abstract
Objective Enormous amounts of healthcare data are becoming increasingly accessible through the large-scale adoption of electronic health records. In this work, structured and unstructured (textual) data are combined to assign clinical diagnostic and procedural codes (specifically ICD-9-CM) to patient stays. We investigate whether integrating these heterogeneous data types improves prediction strength compared to using the data types in isolation.
Methods Two separate data integration approaches were evaluated. Early data integration combines features of several sources within a single model, and late data integration learns a separate model per data source and combines these predictions with a meta-learner. This is evaluated on data sources and clinical codes from a broad set of medical specialties.
Results When compared with the best individual prediction source, late data integration leads to improvements in predictive power (eg, overall F-measure increased from 30.6% to 38.3% for International Classification of Diseases, Ninth Revision, Clinical Modification (ICD-9-CM) diagnostic codes), while early data integration is less consistent. The predictive strength strongly differs between medical specialties, both for ICD-9-CM diagnostic and procedural codes.
Discussion Structured data provides complementary information to unstructured data (and vice versa) for predicting ICD-9-CM codes. This can be captured most effectively by the proposed late data integration approach.
Conclusions We demonstrated that models using multiple electronic health record data sources systematically outperform models using data sources in isolation in the task of predicting ICD-9-CM codes over a broad range of medical specialties.
Keywords: data integration, clinical coding, data mining, international classification of diseases, electronic health records
INTRODUCTION
In health care, electronic health records (EHRs) are becoming widely accepted as the de facto standard of storing medical information.1,2 The information contained within these EHRs not only provides direct health information about patients, but is also used to monitor hospital activities for medical billing and population health management. Clinical coding can be defined as the assignment of procedural and diagnostic codes specified in a medical classification system (eg, ICD,3 ICPC-24). ICD-9-CM diagnostic and procedure codes5 are mainly used for reporting and reimbursement purposes of health care providers, but are also a key factor for other research applications such as tracking patients with sepsis through ICD codes.6,7 Currently, clinical codes are often attributed and registered manually by a specialized team of medical coders.
The primary objective of this paper is to assess whether the integration of structured and unstructured EHR data can improve automated predictions of clinical codes. Additionally, we analyze the informativeness of several data sources, both in isolation and combined, for multiple medical specialties. This is demonstrated by predicting procedural and diagnostic ICD-9-CM codes from various input sources (eg, letters, lab results, radiology reports).
BACKGROUND
Current automated clinical coding approaches for patient discharge files and radiology reports can be divided into handcrafted,8,9 machine learning, and hybrid approaches,10,11 with handcrafted and hybrid approaches being the most successful.12 A literature review conducted by Stanfill et al13 concluded that, while some systems show excellent results, most of them are used in controlled settings, often using normalized data and keeping a limited scope (eg, radiology reports). Secondly, many of the current approaches are not easily portable to other medical domains and different languages. Extending these approaches towards real-life EHR data and enabling these approaches to efficiently deal with high degrees of variability in terms of content, structure and language typical of clinical data, is an important challenge.
Perotte et al14 exploited the hierarchy present in the ICD-9-CM classification system to predict diagnosis codes using (English) discharge files. Whereas most approaches focus on a smaller set of diagnosis codes, Perotte et al used the MIMIC-II database,15 which contains a large set of 5030 distinct ICD-9-CM diagnosis codes. They achieved an F-measure of 39% in this specific setting.
Using both structured and unstructured data has already been shown valuable for multiple applications in the medical field. Abhyankar et al16 used structured and unstructured data from the MIMIC-II database to identify a cohort of ICU patients who received dialysis. Their method, applying off-the-shelf information retrieval methods, not only allows for more effective cohort identification in comparison to using data sources in isolation, but is also attractive enough to be used by healthcare practitioners. Our research strengthens that conclusion and shows the value of combining structured and unstructured data for a different application, namely the assignment of clinical codes to an inpatient stay.
Pathak et al 17 employed a different approach by mapping structured and unstructured data from diverse EHR systems onto standardized vocabularies and ontologies to perform high-throughput phenotyping for patient cohort identification. This unified structured data view is a powerful resource to support secondary use and exchange of EHR data in general, and the goals set out by the SHARPn program in particular (ie, enhancing patient safety and improving patient outcome). From a technical point of view; however, there is a substantial dependency on standardized vocabularies or ontologies, which are not always available for every language. The availability of those resources for lesser-resourced languages such as Dutch remains an issue and mapping the (Dutch) hospital data we used onto standardized vocabularies or ontologies would require a substantial research effort. Additionally, some of the used structured data sources in our dataset (such as lab results) currently do not have a mapping onto a code system, which causes mapping to be an error-prone and time-intensive process. As a result, any additional mapping was out of the scope for this paper. The research presented in this paper distinguishes itself from the current state of the art on three different aspects, namely, portability, data integration, and use of real-life EHR data. First of all, our approach is portable towards different medical specialties. This work evaluates experiments on datasets from fourteen different specialties and with a large set of codes unique to each specialty. Portability is improved by using generalizable techniques instead of handcrafted rules and symbolic systems. Secondly, we not only use information found in discharge summaries, but we also maximize the available information in a specific context by means of data integration approaches, which yielded excellent results in other medical tasks.16–19 Our approach can use all available data sources, and can also work with any subset of these sources, depending on their local availability. Finally, our approach is able to use real-life, raw EHR data as its input which greatly increases its practical usability.
METHODS
The very nature of the data used in this study, being real-life data, presents a number of limitations and specific characteristics. First of all, the data cannot be considered to be complete. Medication prescriptions, for instance, are not always registered electronically and do not necessarily lead to actual medication intake. Secondly, the data used in this research originates from disparate data sources, which were created for varying purposes (eg, diagnostics, treatment follow-up, nurse handoff, billing, medical registration, and archiving). This required recreating some of the relations (eg, inpatient stay relations). Finally, the data contains errors (eg, spelling errors) and has missing values.
Dataset
Our dataset is derived from the clinical data warehouse at the Antwerp University Hospital (UZA, Belgium) and consists of a randomized subset of fully anonymized historical data with hospitalized patient stays, covering 2 years of data. Distinct sources in the dataset consist of both structured and unstructured (ie, textual) data. The extracted textual data sources are in Dutch. The dataset is divided into 14 medical specialties, as seen in Figure 1. Only sufficiently represented medical specialties are included in the dataset. Assigned procedure and diagnostic codes are observed to follow a Zipf distribution,20 meaning that a few codes occur very frequently with a long tail of infrequently assigned codes.
Figure 1:

The top graph shows the number of patient records in the available datasets per medical specialty; the bottom graph shows the number of unique ICD-9-CM codes (procedural: left, diagnostic: right) per specialty.
The following types of data sources are used in our study (abbreviations are indicated with brackets):
- Unstructured data sources:
- - Surgery reports (Surgery Rpt): describing the details of a performed surgery.
- - Letters (Letter): discharge letters and letters to direct a patient to a specialist.
- - Notes (Note): day-to-day internal notes concerning a patient (eg, a progress report written by a nurse).
- - Protocols (Protocol): textual representation of the results of certain procedures (eg, the textual interpretation of an Magnetic Resonance Imaging (MRI) scan).
- - Attestations (Attestation): a letter validating a certain claim (eg, a medical leave of absence).
- - Requests (Request): a formal letter asking for a medical appliance or service (eg, a request to receive an electric wheelchair for care at home).
Structured data sources:
- Lab results (Lab results): consisting of a test id, a numeric or categorical value, a unit, and sometimes a conclusion. Lab test naming uses an in-house naming convention.
- Inpatient medication prescriptions (ATC): set of prescribed medications in the form of ATC codes (Anatomical Therapeutic Chemical classification system).21
- Oncological pathology codes (CODAP): in the form of CODAP codes,22 a code system describing abnormal tissue growth, analyzed after biopsy.
- Medical Specialty (DEPT): describing the associated medical specialties for a particular stay. (eg, a patient being treated in the cardiology department is being followed-up by a doctor from the gastroenterology department and is therefore associated with both medical departments).
- Demographic data (DEM): year of birth and gender.
- Procedure codes (RIZIV): describing a medical procedure or intervention (eg, MRI scan). These are registered automatically or manually. The specific nomenclature used is the Belgian RIZIV standard,23 which is strongly linked with ICD-9-CM procedure codes.
The prediction space consists of: (1) ICD-9-CM procedure codes (ICD-9-CM Proc), which describe procedures performed on a patient during his/her hospital stay and (2) ICD-9-CM diagnosis codes (ICD-9-CM Diag), which contain the primary and secondary diagnoses of a patient.5 These codes have been assigned manually by a specialized team of coders, which is a potentially error-prone process.12,24 Additionally, the Belgian government only requires a subset of procedural ICD-9-CM codes to be coded, namely all codes between indices 0 and 87 and a selection of codes in the 87–99 “Miscellaneous diagnostic and therapeutic procedures” range (ICD-9-CM Volume 3). This leads to 1636 unique required codes in our dataset. The not required codes are sometimes but not consistently assigned and were therefore left out of the training data. For diagnostic ICD-9-CM codes, the entire set of codes was included.
Data representation
Linking specific data elements – both structured and unstructured – to one or more procedure or diagnosis codes, requires a process of one-to-many and many-to-one data mapping. This mapping is performed by projecting the data elements to a single level.
An inpatient stay is reported in multiple data elements, originating from a disparate set of databases (Figure 2A). These databases were developed for different purposes, causing them to have different ways of representing inpatient stays. When a patient is transferred from one medical specialty to another during an inpatient stay, we refer to both stays as partial stays. We use this partial stay (linked to a single medical specialty) as the single level to which we link all data elements.
Figure 2:

Visualization of an example set of structured and unstructured data types. (A) The disparate databases. (B) An example structure of a patient medical record, with full lines representing connections of data types and their level and dashed lines to their given date. (C) The mapping on the partial stay level.
In Figure 2B, an example structure of an inpatient stay can be seen. Data elements are linked directly on different levels within the inpatient stay. An indirect link between a more detailed level in the inpatient stay and a data element can be made by looking at the given date linked to these elements. This allows flattening the data elements to a representation on the partial stay level, as seen in Figure 2C.
This approach results in a list of partial stays with a mean of 8 distinct source types and a standard deviation of 2.5 sources. This means that while most patient files have multiple data sources linked to them, they seldom have all sources. An overview of the presence of these sources can be seen in Figure 3.
Figure 3:

Presence (in %) of the different data types over all datasets. The main bar shows the average presence, the error bars show the standard deviation between the different medical specialties. Abbreviations are explained in the “dataset” section.
The classification task this paper focuses on is the assignment of clinical codes to partial stays, which in turn represent EHR data collected during routine clinical processes within a medical specialty, or within the time interval of that partial stay. Fifty-six thousand six hundred and forty-one distinct partial stays can be found in the entire dataset. Figure 1 presents the number of partial stays per specialty. Partial stays that do not have any codes assigned are not excluded from the dataset, since this is the result of human error that we do not expect to cause bias in the results.
Features
Several types of features are derived from data types, separately for structured and unstructured input. For structured input, we have a number of codes assigned to a patient (eg, ATC-codes, codes representing lab results). For lab results, we have a value and unit (eg, 25 mg) or a state (eg, positive, negative, strong reaction) in addition to the code representing a certain test.
A first set of features is derived by counting the number of occurrences of distinct assigned codes. A second set of features is specific to the source itself. For lab results, this consists of the observed absolute values and deviation from the reference range (as derived from reference guides within the hospital for specific tests). For RIZIV codes, we use additional information found in its descriptive thesaurus22 and make counts of specific types of codes occurring (eg, the number of codes that involve a general action, such as “attachment of an infusion”). A third set of features consists of multiple meta-features including the average amount of assigned codes per day and the total amount of (unique) codes per stay.
For unstructured input, we use a combined bag of words (BoW) of all documents of a certain type (eg, notes) associated to a specific partial stay. These individual BoWs are preprocessed with Frog,25 a morpho-syntactic analyzer and dependency parser for Dutch. This natural language processing (NLP) tool uses a pretrained model to perform sentence detection, tokenization, and part-of-speech tagging. From this last set of features, words tagged as nouns and verbs were used as features.
This is a relatively superficial level of NLP, but has the advantage that easy adaptation to other languages is possible, as opposed to using deeper text understanding techniques. Experiments with different text representations based on a BoW (consisting of the words themselves, the lemmas, or the nouns and verbs for each document) yielded comparable results to the chosen approach (results not shown).
Experimental Setup
For each clinical code, a separate classifier is trained. Training is done in parallel, so that a single partial stay can have multiple codes assigned. Ten-fold cross-validation was applied to generate robust models. For each fold, the feature selection (see below) was performed to reduce the feature space.
In the machine learning phase, multiple general classifiers were evaluated to account for differences in performance among certain data types. Naive Bayes26 and Random Forests27 were used for prediction and compared afterward using the WEKA software package.28 The Naive Bayes implementation is multinomial with Laplace smoothing. Random Forest was capped at 100 trees generated.
Feature Selection
The exhaustive list of derived features also generates a large amount of uninformative features. This list is reduced by applying feature selection algorithms.
Feature selection for features originating from unstructured data was performed by Term Frequency - Inverse Document Frequency (TF-IDF).29 TF-IDF is a widely used feature selection method, chosen for its ability to do feature selection in linear time with respect to the number of features. Features from a structured input source were first filtered through a weak gain ratio filter and further filtered via minimum Redundancy - Maximum Relevance (mRMR).30 The mRMR algorithm minimizes redundancy and maximizes relevance of the selected features, but is only computationally feasible for smaller numbers of features. We have compared mRMR to gain ratio and information gain feature selectors, with mRMR selecting less features while yielding a similar F-measure (results not shown). Within a cross-validation fold, the feature selection thresholds were optimized by performing multiple evaluations for different threshold choices.
Data Integration
Two methods for data integration were evaluated for this paper: early and late data integration.31 Early data integration (cf, Figure 4A) consists of integrating the features of different sources before training the model. Model training is then performed on the entire feature space (after feature selection).
Figure 4:

Example of data integration for the ICD-9-CM code “430.” This figure illustrates the difference between early and late data integration. (A) A pipeline for early data integration. (B) A pipeline for late data integration.
Late data integration (Figure 4B) is an ensemble method in which the prediction results from separate models, trained on each distinct source, are used as input for a second (meta-) classifier or by means of composite methods such as voting, weighing, stacking, or averaging. We opted for training a meta-classifier that takes the predictions and class probabilities of the individual models as input for classification within the same fold. This second classifier is a Bayesian network, structured learning is performed with hill climbing.32 This approach proved to perform consistently better than Random Forests and Naive Bayes (results not shown).
Metrics
To evaluate the experiments, micro-averaged F-measure is used (averaged over single codes). F-measure is the harmonic mean of precision and recall and is a good indicator for the overall predictive power of models. Our models return class probabilities, which allows for further tuning between optimizing precision and recall. This tuning was not carried out in this research, as the models were already optimized for F-measure. Micro-averaged F-measure was chosen for our interest in predicting correct codes for as many patients as possible, rather than ensuring good coverage of the different classes.33
Table 1 shows the micro-averaged F-measure for the best performing algorithm for diagnostic ICD-9-CM codes and per combination of input data and medical specialty. Analogously, Table 2 represents the results for procedure codes. Complete performance results of both algorithms can be found in Supplementary Materials.
Table 1:
Micro-averaged F-measure for ICD-9-CM diagnostic codes
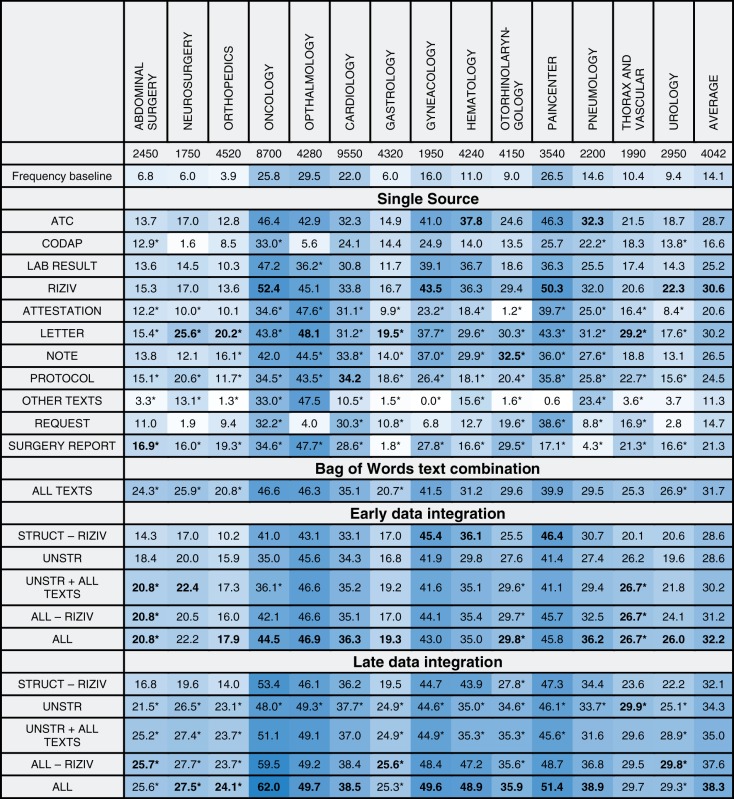 |
Columns show different medical specialties, rows show the various input data sources and combinations. The best results for each group (namely, single source, data integration without meta-learning, data integration with meta-learning) are marked in bold. Only results for the best performing classifier are shown. A trailing asterisk indicates multinomial Naive Bayes, no mark indicates Random Forests. A darker background indicates better results.
Table 2:
Micro-averaged F-measure for ICD-9-CM procedure codes
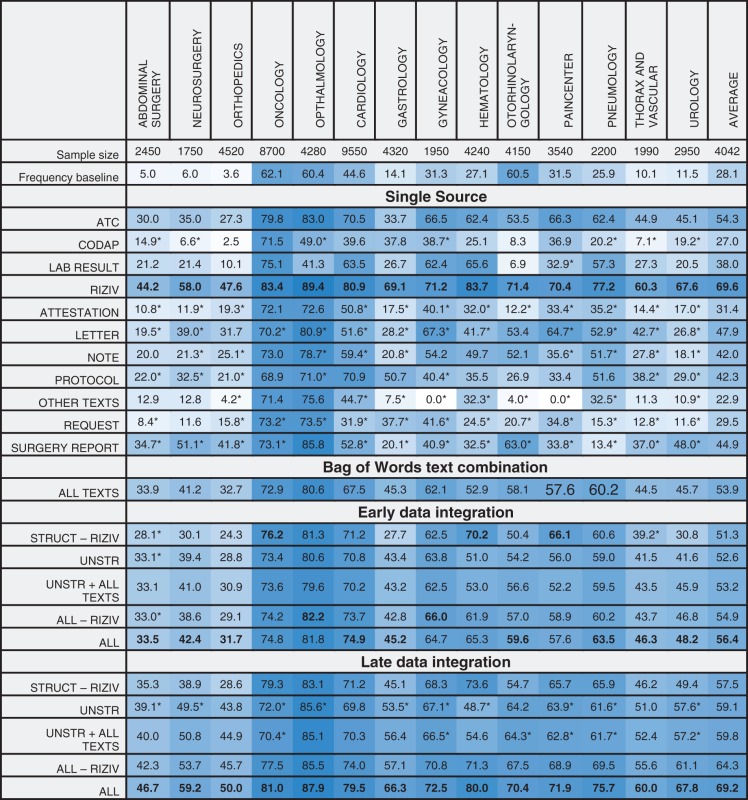 |
Columns show different medical specialties, rows show the various input data sources and combinations. The best results for each group (namely, Single source, data integration without meta-learning, data integration with meta-learning) are marked in bold. Only results for the best performing classifier are shown. A trailing asterisk indicates multinomial naive Bayes, no mark indicates Random Forests. A darker background indicates better results.
We compare these results to a frequency baseline, representing the achieved F-measure when classes present in >50% of the partials stays are assigned to each partial stay in that specific specialty. Data integration is evaluated for several interesting combinations of data sources. These combinations consist of the data types as grouped in the dataset section, with sometimes a specific input type added or removed.
In general, we notice that the F-measure varies significantly over the different specialties. Some sources seem to score better on specific specialties. For instance, both surgery reports and ATC-codes seem to be a good predictor for surgical specialties. The predictiveness of late data integration is superior to that of individual sources. For ICD-9-CM procedure codes, this is not the case, as RIZIV alone often beats late data integration. This can be explained by both RIZIV and ICD-9-CM procedure codes describing similar actions, often causing a one-to-one mapping between those codes. Disregarding the RIZIV data source, the performance increase by using late data integration is also visible for procedure codes.
Bag of Words text combination
The “all texts” combination is composed of a BoW of all different types of unstructured input associated with a stay. This can be considered an early form of data integration, with the difference that features representing the same word in different texts are merged instead of keeping them separated. In specialties such as pneumology, this combination will score better than the individual unstructured types, while for others (eg, gynecology), it will not quite reach the performance of the best text category. Overall, a smoothing effect of the individual unstructured types is seen, with a consistent improvement over the baseline.
Early data integration
For the early data integration approach, a slight decrease in predictiveness is often seen, compared to the best individual source in a certain combination. A combination existing of solely structured sources sometimes has slightly improved results, while a mixed combination with both structured and unstructured sources often shows a performance decrease. Early data integration is always outperformed by late data integration.
Late data integration
The results for late data integration with unstructured sources contain the same data sources as the “all texts” combination, but are based on a separate model for each individual source. This combination outperforms the “all texts” combination on all specialties, showing that the information is better captured when predictions are made individually. Adding predictions made on the “all texts” combination to the unstructured combination (ie, “unstruc + all texts”), we see a small increase in F-measure. Late data integration achieves superior results for other combinations as well.
The “all - RIZIV” combination encompasses all frequently seen sources in hospitals. The combination significantly improves results with respect only to the unstructured combination, showing that there is important and additional information present in structured data that is not captured by models using only unstructured data.
The “RIZIV” source, which is specific to Belgian hospitals, increases performance when added to the combinations for procedural ICD-9-CM codes. For diagnostic codes, they have a significantly smaller impact. An explanation for this is the one-to-one mapping between most RIZIV and ICD-9-CM procedure codes. Excluding RIZIV from the structured combination allows us to get a more objective view for predicting procedure codes.
In Figure 5, extra sources are iteratively added to the predictive model. In most cases, the average F-measure increases when adding sources. Each specialty seems to have different sources triggering a performance improvement.
Figure 5:

Micro-averaged F-measure for increasing number of data sources. From left to right on the X axis, additional data sources are added (using late data integration). (A) ICD-9-CM diagnostic codes, (B) ICD-9-CM procedural codes. Results for specific specialties are in gray, averaged results in black.
DISCUSSION
The results shown above provide interesting insights into the combination of structured and unstructured data sources for automated clinical coding. First of all, individual data sources lead to major performance differences for the different specialties. From a perspective of portability towards other hospitals, countries and languages, the task of finding the most informative sources for each individual specialty would be arduous. Our proposed late data integration approach seems to be able to achieve this task in a scalable manner without the need to select a single best source.
The results show that integrating multiple data sources improves the classification of patient files with ICD-9-CM codes across all medical specialties in a consistent way. This strongly indicates that not all relevant information for assigning clinical codes is available in unstructured data and that adding structured data significantly improves performance. Since we use a relatively basic NLP pipeline, we hypothesize that improving the NLP pipeline will capture additional information from unstructured data that we are currently not able to use in our models. However, the performance impact of using additional structured information sources might be lower as a result of using improved NLP techniques.
Using an ensemble method makes data integration perform more consistently. This mostly shows that in order to get predictive information out of different data sources, deriving similar features and performing feature selection is not an effective approach. This suggests that more tailoring is needed towards selecting (and generalizing) the individual features of different sources to improve early data integration.
When interpreting these results, we need to consider the concerns raised by Lawthers et al 34 and Romano et al 35 about the clinical validity of claims codes. Lawthers et al have shown that ICD-9-CM codes have limited value for the identification of medical complications because of the disconnect between discharge abstracts, which are collected for the sake of clinical processes, and ICD-9-CM codes, which are registered for billing and reimbursement purposes. While the disconnect cannot be denied, we designed a classification task that bears close resemblance to the actual task of clinical coders. When assigning clinical codes, coders are legally obliged to use the patient’s medical record as the only source of information. A clinical coding application would use the same type of information. The implementation of ICD-10 coding systems only increases the need for solutions for the clinical coding task. The use of other measures with proven clinical validity – such as outcome measures, process measures, or SNOMED codes – is a solution to the concerns raised, but they make for a different task.
A limitation of our study lies in the fact that the approaches have not been tested for portability to different hospitals, since the data originated from a single hospital. The factors missed here include local factors, such as hospital-specific aspects, country-specific regulations, goal-specific aspects (eg, clinical or administrative), and the difference between third-line and general hospitals. While using a relatively simple NLP-pipeline is beneficial to show portability across languages, a NLP-pipeline with more complex modules (eg, negation detection) has been shown to have superior performance.12 Finally, the sole use of ICD-9-CM codes as the output space limits the portability to other coding systems.
When applying the algorithms to a computer-assisted clinical coding environment, the most important factor is improving the throughput time while maintaining the coding quality. When suggesting a code to a clinical coder, a model should return codes with a high recall, while limiting the amount of codes returned. When completely automating (a part of) the clinical code assignment, precision is a more important factor, as automatically assigned codes need to be completely correct.
CONCLUSIONS
Current state-of-the-art algorithms for prediction of ICD-9-CM codes are typically built on discharge summaries or radiology reports and are often tailored towards specific medical specialties. We evaluated the effect of integrating additional information sources, both structured and unstructured, and compared early and late data integration approaches for different machine learning algorithms (naive Bayes, Random Forests) and across a wide range of medical specialties. We show that the late data integration approach significantly improves the performance of these algorithms across all investigated medical specialties. All available data sources, independent of their (un) structured origin, can be added to the model without loss of predictive power for each of the different medical specialties. Evaluations have been performed on (Dutch-language) EHR data of a single hospital, but our approach was specifically designed to be portable to different contexts such as medical specialties, hospitals, specific coding systems, and languages.
FUNDING
This work was supported by the Agency for Innovation by Science and Technology in Flanders (IWT) grant number 131137.
COMPETING INTERESTS
The authors report no potential conflicts of interest.
CONTRIBUTORS
All the authors contributed to the design of the study. E.S. collected and analyzed the datasets and performed the experiments. All authors contributed in writing the manuscript. K.L., L.L., W.D., and T.V.dB. provided guidance and contributed from their respective areas of expertise. W.D. and T.V.dB. academically supervised the project. All authors approved the final version of the paper.
SUPPLEMENTARY MATERIAL
Supplementary material is available online at http://jamia.oxfordjournals.org/.
REFERENCES
- 1.Hsiao C-J, Hing E. Use and Characteristics of Electronic Health Record Systems Among Office-Based Physician Practices, United States, 2001-2012. US Department of Health; Human Services, Centers for Disease Control; Prevention, National Center for Health Statistics, United States. [Google Scholar]
- 2.Cimino JJ. Improving the electronic health record—are clinicians getting what they wished for? JAMA. 2013;309(10):991–992. [DOI] [PMC free article] [PubMed] [Google Scholar]
- 3.WHO. International Classification of Diseases. http://www.who.int/classifications/icd/en/. Accessed 25 March 2015. [Google Scholar]
- 4.WHO. International Classification of Primary Care. 2nd edn. 2003. http://www.who.int/classifications/icd/adaptations/icpc2/en/. Accessed 25 March 2015. [Google Scholar]
- 5.WHO. International Classification of Diseases, Clinical Modification (Ninth Revision).http://www.cdc.gov/nchs/icd/icd9cm.htm. Accessed 25 March 2015. [Google Scholar]
- 6.Ramanathan R, Leavell P, Stockslager G, et al. Validity of International Classification of Diseases, Ninth Revision, Clinical Modification (ICD-9-CM) Screening for Sepsis in Surgical Mortalities Surg Infect. 2014;15 (5):513–516. [DOI] [PubMed] [Google Scholar]
- 7.Carroll RJ, Bastarache L, Denny JC. R PheWAS: data analysis and plotting tools for phenome-wide association studies in the R environment. Bioinformatics. 2014;30(16):2375–2376. [DOI] [PMC free article] [PubMed] [Google Scholar]
- 8.Goldstein I, Arzumtsyan A, Uzuner Ö. Three Approaches to Automatic Assignment of ICD-9-CM Codes to Radiology Reports. AMIA Ann Symp Proc. 2007:279–283. [PMC free article] [PubMed] [Google Scholar]
- 9.Kevers L, Medori J. Symbolic classification methods for patient discharge summaries encoding into ICD. In Advances in Natural Language Processing. Springer; 2010:197–208. [Google Scholar]
- 10.Pakhomov SVS, Buntrock JD, Chute CG. Automating the assignment of diagnosis codes to patient encounters using example-based and machine learning techniques. JAMIA. 2006;13 (5):516–525. [DOI] [PMC free article] [PubMed] [Google Scholar]
- 11.Farkas R, Szarvas G. Automatic construction of rule-based ICD-9-CM coding systems. BMC Bioinformatics. 2008;9(3):S10. [DOI] [PMC free article] [PubMed] [Google Scholar]
- 12.Pestian JP, Brew C, Matykiewicz P, et al. A shared task involving multi-label classification of clinical free text. Assoc Computational Linguistics, In Proceedings of the Workshop on BioNLP 2007: Biological, Translational, and Clinical Language Processing. 2007;97–104. [Google Scholar]
- 13.Stanfill MH, Williams M, Fenton SH, et al. A systematic literature review of automated clinical coding and classification systems. JAMIA. 2010;17(6):646–651. [DOI] [PMC free article] [PubMed] [Google Scholar]
- 14.Perotte A, Pivovarov R, Natarajan K, et al. Diagnosis code assignment: models and evaluation metrics. JAMIA. 2014;21(2):231–237. [DOI] [PMC free article] [PubMed] [Google Scholar]
- 15.Saeed M, Villarroel M, Reisner AT, et al. Multiparameter intelligent monitoring in intensive care II (MIMIC-II): a public-access intensive care unit database. Crit Care Med. 2011;39(5):952. [DOI] [PMC free article] [PubMed] [Google Scholar]
- 16.Abhyankar S, Demner-Fushman D, Callaghan FM, McDonald CJ. Combining structured and unstructured data to identify a cohort of ICU patients who received dialysis. JAMIA. 2014;21(5):801–807. [DOI] [PMC free article] [PubMed] [Google Scholar]
- 17.Pathak J, Bailey KR, Beebe CE, et al. Normalization and standardization of electronic health records for high-throughput phenotyping: the SHARPn consortium. JAMIA. 2013;20(e2):e341–e348. [DOI] [PMC free article] [PubMed] [Google Scholar]
- 18.Pletscher-Frankild S, Pallejá A, Tsafou K, et al. DISEASES: Text mining and data integration of disease--gene associations. Methods. Elsevier; 2014;74: 83–89. [DOI] [PubMed] [Google Scholar]
- 19.Daemen A, Gevaert O, Ojeda F, et al. A kernel-based integration of genome-wide data for clinical decision support. Genome Med. 2009;1(4):39. [DOI] [PMC free article] [PubMed] [Google Scholar]
- 20.Brookes BC. The derivation and application of the Bradford-Zipf distribution. J Document. 1968;24(4):247–265. [Google Scholar]
- 21.WHO. Anatomical Therapeutic Chemical (ATC) Classification System. 2015. http://www.whocc.no/atc/structure_and_principles/. Accessed 25 March 2015. [Google Scholar]
- 22.BDSP. Cahier d Observation Descriptif de L Activité Palliative (CODAP). http://www.bdsp.ehesp.fr/Base/327741/. Accessed 25 March 2015. [Google Scholar]
- 23.RIZIV. Rijksintituut Voor Ziekte- En Invaliditeitsuitkeringen Nomenclature. http://www.riziv.fgov.be/NL/nomenclatuur/Paginas/default.aspx#.VOX1TzU2x0x. Accessed 25 March 2015. [Google Scholar]
- 24.Nouraei SAR, O’Hanlon S, Butler CR, et al. A multidisciplinary audit of clinical coding accuracy in otolaryngology: financial, managerial and clinical governance considerations under payment-by-results. Clin Otolaryngol. 2009;34 (1):43–51. [DOI] [PubMed] [Google Scholar]
- 25.Bosch AVd, Busser B, Canisius S, Daelemans W. An efficient memory-based morphosyntactic Tagger and Parser for Dutch. LOT Occasional Series. 2007;7:191–206. [Google Scholar]
- 26.McCallum A, Nigam K. A comparison of event models for Naive Bayes text classification. In AAAI-98 Workshop on ’Learning for Text Categorization’ . 1998. [Google Scholar]
- 27.Breiman L. Random forests. Mach Learn. 2001;45 (1):5–32. [Google Scholar]
- 28.Hall M, Frank E, Holmes G, et al. The WEKA Data Mining Software: an Update. SIGKDD Explorations. 2009;11(1):10–18. [Google Scholar]
- 29.Salton G, Buckley C. Term weighting approaches in automatic text retrieval. Inform Process Manag. 1988;24(5):513–523. [Google Scholar]
- 30.Peng H, Long F, Ding C. Feature selection based on mutual information criteria of max-dependency, max-relevance, and min-redundancy. Pattern Analysis and Machine Intelligence, IEEE Transactions on 2005;27(8):1226–1238. [DOI] [PubMed] [Google Scholar]
- 31.Hamid JS, Hu P, Roslin NM, et al. Data integration in genetics and genomics: methods and challenges. Hum Genom Proteomics. 2009;1:1 [DOI] [PMC free article] [PubMed] [Google Scholar]
- 32.Cooper G, Herskovits E. A Bayesian method for the induction of probabilistic networks from data. Mach Learn. 1992;9(4):309–347. [Google Scholar]
- 33.Jackson P, Moulinier I. Natural Language Processing for Online Applications: Text Retrieval, Extraction and Categorization. John Benjamins Publishing; 2007:5. [Google Scholar]
- 34.Lawthers AG, McArtney RG, Davis RB. Identification of in-hospital complications from claims data: is it valid? Med Care. 2000;38:785–795. [DOI] [PubMed] [Google Scholar]
- 35.Romano PS, Chan BK, Schembri M, Rainwater J. Can administrative data be used to compare postoperative complication rates across hospitals? Med Care. 2002;40:856–867. [DOI] [PubMed] [Google Scholar]