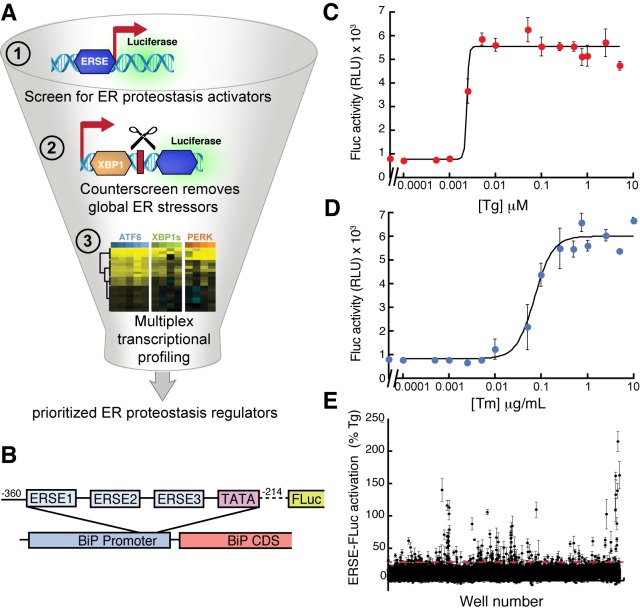
Figure 1. High-throughput screen to identify small molecule ER proteostasis regulators.
(A) Illustration showing the three-tiered screening strategy implemented to identify small molecules that preferentially activate the ATF6 transcriptional program. (B) Schematic of the ERSE-firefly luciferase (FLuc) reporter used in our HTS approach. (C) Activation of FLuc luminescence in HEK293T-Rex cells stably expressing ERSE-FLuc treated with the indicated concentrations of thapsigargin (Tg) for 18 hr. Error bars represent standard deviation for n = 3 replicates. (D) Activation of FLuc luminescence in HEK293T-Rex cells stably expressing ERSE-FLuc treated with the indicated concentrations of tunicamycin (Tm) for 18 hr. Error bars represent standard deviation for n = 3 replicates. (E) Plot showing ERSE-FLuc activation in HEK293T-Rex cells stably expressing ERSE-FLuc treated with the 13,748 small molecule ER proteostasis activators identified in the primary screen (6.8 µM; 18 hr). Luminescence is shown as % signal relative to Tg treatment (500 nM; 18 hr). Error bars show standard deviation for n = 3 replicates. The dashed red line shows 25.1% Tg activity.


