Abstract
For centuries tissue palpation has been an important diagnostic tool. During palpation, tumors are felt as tissues harder than the surrounding tissues. The significance of palpation is related to the relationship between mechanical properties of different tissue lesions. The assessment of tissue stiffness through palpation is based on the fact that mechanical properties of tissues are changing as a result of various diseases. A higher tissue stiffness translates into a higher elasticity modulus. In the 90's, ultrasonography was extended by the option of examining the stiffness of tissue by estimating the difference in backscattering of ultrasound in compressed and non-compressed tissue. This modality is referred to as the static, compression elastography and is based on tracking the deformation of tissue subjected to the slowly varying compression through the recording of the backscattered echoes. The displacement is estimated using the methods of cross-correlation between consecutive ultrasonic lines of examined tissue, so calculating the degree of similarity of ultrasonic echoes acquired from tissue before and after the compression was applied. The next step in the development of ultrasound palpation was to apply the local remote tissue compression by using the acoustic radiation force generated through the special beam forming of the ultrasonic beam probing the tissue. The acoustic radiation force causes a slight deformation the tissue thereby forming a shear wave propagating in the tissue at different speeds dependent on the stiffness of the tissue. Shear wave elastography, carries great hopes in the field of quantitative imaging of tissue lesions. This article describes the physical basis of both elastographic methods: compression elastography and shear wave elastography.
Keywords: elastography, static sonoelastography, dynamic sonoelastography, ultrasonography
Abstract
Od stuleci badanie palpacyjne tkanek stanowi ważne narzędzie diagnostyczne. Nowotwory są zazwyczaj wyczuwane palpacyjnie jako tkanki twardsze od otoczenia. Istotność palpacji związana jest z zależnością wielu zmian tkankowych od ich własności mechanicznych. Palpacyjna ocena twardości lub sztywności tkanek opiera się na fakcie, że wiele chorób powoduje zmiany ich własności mechanicznych. Zwiększona sztywność tkanki oznacza zwiększony moduł sprężystości. W latach 90. ultrasonografia została rozszerzona o opcję badania sztywności tkanek, polegającą na ocenie różnicy w rozproszeniu ultradźwięków na tkance nieuciśniętej i uciśniętej. Jest to statyczna metoda elastografii kompresyjnej. Polega ona na wolnozmiennym ucisku badanego obszaru tkanki i ocenie jej odkształcenia poprzez śledzenie zmian w echach ultradźwiękowych rejestrowanych w kolejnych chwilach uciskania. Wielkość przemieszczenia wyznacza się metodami korelacji wzajemnej pomiędzy następującymi po sobie liniami obrazowymi, a więc obliczając stopień podobieństwa ech ultradźwiękowych przed uciskiem i po ucisku. Kolejnym krokiem w rozwoju palpacji ultradźwiękowej było zastosowanie do lokalnego, zdalnego ucisku tkanki, akustycznej siły promieniowania generowanej przez odpowiednie formownie wiązki ultradźwiękowej sondującej badany narząd. Akustyczna siła promieniowania powoduje niewielkie odkształcenie lub przemieszczenie się tkanki, w wyniku czego powstaje fala ścinania rozchodząca się w tkance z różną prędkością, zależną od sztywności tkanki. Elastografia fali ścinania niesie ogromne nadzieje w zakresie ilościowego obrazowania lokalnych zmian własności tkanki. W artykule opisane zostały podstawy fizyczne obu typów elastografii: kompresyjnej i fali ścinania.
Introduction
Palpation of organs lying superficially as well as the abdominal cavity, chest percussion and auscultation with a stethoscope are standard diagnostic procedures. During palpation, a physician, by pressing the patient's skin and internal organs lying beneath, senses their location, hardness, mobility and pulsation. Tissue strain is merely an approximation of its stiffness felt by a physician during palpation: low tissue strain corresponds to high stiffness and vice versa. For internal organs with simple geometric shapes, the stress-strain ratio, assuming that both values are known, is the modulus of elasticity. At present, physicians keep a record of what is characteristic for the elasticity of different tissues, determined as displacement caused by the applied pressure, either internal one resulting from the propagation of the pressure wave in arteries, or external one resulting from pressing.
Elastographic procedures are described in the guidelines of EFSUMB(1).
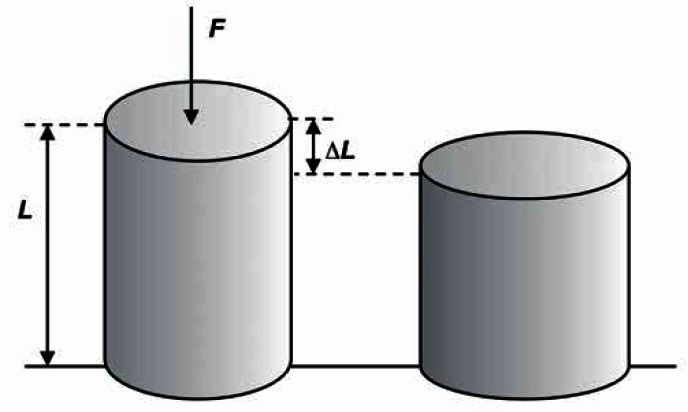
The elasticity of a material describes its ability to return to balance – its original shape – after being subjected to a deforming force or stress. Fluids resist a change in their volume, but not in shape, therefore they possess only volume elasticity. Solids resist changes both in shape and volume therefore they possess rigidity (or shear elasticity), as well as volume elasticity. The change in size or shape is referred to as the strain. The strain is produced the force acting on a particular surface – this force is known as the stress (Fig. 1).
Fig. 1.
A change in the shape of material under external force F, strain ɛ = ΔL/L
For a homogeneous isotropic solid, the stress/strain ratio is a constant, and called the modulus of elasticity [N/m2]. Below are the basic values describing the elasticity of materials:
Young's modulus, E = (stress)/(strain).
Young's modulus E describes the longitudinal elasticity of a material (tissue) ΔL/L (the percentage change in its length) in response to stress σ which equals the action of a contraction force F on the material's surface A.
| 1 |
where ɛ = ΔL/L
Shear modulus, µ
Shear modulus µ describes the relationship between transverse stress and strain. Shear modulus µ is related to the propagation of shear wave in a uniform system.
Bulk modulus, B
Bulk modulus B describes the change in the material's volume under external stress.
Poisson's ration
When stressed, a material may contract to the direction of stretching or may expand in direction transverse to the direction of compression. This is described by Poisson's ratio γ.
| 2 |
The four constant values are linked to one another by the following three equations:
| 3 |
| 4 |
| 5 |
For biological tissues, Poisson's ratio is usually between 0.490 and 0.499, which means that tissue is almost incompressible (for an incompressible liquid Poisson's ratio γ = 0.5).
One can see in eq. 4 that modulus of elasticity and shear modulus of tissue are linked by a simple scale ratio that equals 3 (E = 3µ).
The difference between bulk moduli B of most soft tissues is not greater than 15% in relation to bulk modulus of water. As biological tissues contain large amounts of water, their shape can be easily changed as a result of compression, yet their volume remains unchanged.
Shear modulus µ varies over several orders of magnitude. Therefore, shear and Young's moduli with the widest dynamic ranges are the most optimal parameters for the assessments of tissue stiffness and are close to what is felt by a physician during palpation.
The propagation velocities of ultrasonic longitudinal wave cl, and transverse wave cs in a solid are as follows:
| 6 |
| 7 |
Velocity cl varies from 1410 m/s in fat to approximately 1630 m/s in muscles. The corresponding values for ρ are from 916 to 1060 kg/m3. Substituting these values in the equation for the bulk modulus B gives us: from 1800 MPa for fat tissue to 2800 MPa for muscles.
The shear wave velocity cs in tissues is several hundred times lower than the longitudinal wave speed cl,, thus shear moduli µ for different tissues are lower by several orders of magnitude than the corresponding bulk moduli B.
The relation between stress and strain in soft tissues is different in the compressional and stretching processes. As the stress increases from 0, the strain increases rapidly as fluids are “extruded”, and only then is the stress/strain ratio (Young's modulus) considered to be linear for small changes (for strain of less than a few per cent). If tissue is subjected to further stress, the strain decreases rapidly until the tissue breaks. For results to be repeatable, tissue must be subjected to slight stress in the first place, and measurements must be carried out for small increases in stress(2).
Ultrasound elastogrpahy may be divided into two groups depending on the stimulation method and measurements:
- static elastography:
- compression elastography – tissue is pressed at a low pace, the distribution of tissue displacements is defined based on the function of correlation (similarity) between subsequent ultrasound images of the compressed tissue,
- tissue Doppler imaging, (TDI) – the measurement of shear velocity of tissue under low-frequency “sinusoidal” compression and relaxation;
- dynamic elastography – tissue deformation caused by acoustic radiation force:
- acoustic radiation force imaging, ARFI,
- shear wave elastography, SWE – shear wave is produced by a highly focused ultrasound radiation (acoustic radiation force); shear wave propagation velocity depends on the stiffness of tissue.
So called shear wave transient elastography applied in FibroScan apparatus is a type of the aforementioned imaging method.
Static (compressive) elastography
Elastography is a method for imaging the elasticity in biological tissues. Ophir et al. have described a new method for imaging the displacement of tissues subjected to an external pressure. They called it compression elastography. It constists in compressing an area of tissue at a low-frequency and assessing its strain by means of tracking the changes in ultrasound echoes measured as stresses increases. A physician applies stress by moving a transducer slightly axially upwards and downwards (according to Ophir, the pressure depth should be 1–2 mm, and the area should be compressed 1–2 times per second)(3).
The assessment of strain involves tracking speckles in the ultrasound image. The extent of displacement is measured based on cross-correlations between successive images, i.e. by calculating the degree of similarity between pre- and post-compression ultrasound echoes.
Acquisition of the echo signals from the tissues is performed in two steps – before and after a controlled compression of the investigated organ. The two obtained images are then compared by processing pairs of respective echoes, usually based on the cross-correlation method, i.e. by calculating the degree of similarity between pre- and post-compression ultrasound echoes. The applied force of compression allows to determine local stress values, which depend on local tissue stiffness.
The relative average values of strain are inversely correlated with tissue stiffness. Harder tissues deform under compression less than softer tissues, and their pre- and post- compression ultrasonographic images are similar, and thus better correlated. Soft tissues undergo greater deformation under compression and their pre- and postcompression images differ, indicating a lower degree of correlation. The stiffness of the investigated tissue can be assigned different color-coded or gray scales, depending on ultrasound producer.
A few percent compression to remove the excess cellular fluid from the investigated area is needed to linearize the relationship between Young's modulus and compression(4). It should be noted that as a result of non-linear behavior of various issues, their stiffness, and thus the Young's modulus, increases with compression. Excessive compression can reduce the difference in the effective stiffness between tumor and the surrounding tissue. Therefore, the initial compression should be very lightweight!
Young's modulus E can be calculated from formula 1 provided that both, the stress σ acting on the tissue and the strain ɛ are known. Although only the axial strain is determined in vivo (assuming its homogeneity), even a quantitative assessment of Young's modulus gives a picture of the relative tissue stiffness in a given region.
Itoh et al. suggested encoding tissue stiffness using a color-coded scale known as the Tsukuba University Score. This is a 5-point scale for the classification of lesions from completely deformable (typically benign lesions), partially deformable (benign lesions in most cases) to those non- deformable (malignancies in most cases)(5).
The image of stiffness (elastogram) is overlaid on B-mode image of an organ and may be seen next to the classic B-mode image.
The strain in soft tissues is coded in red and green. Minor strain typical of stiff tissues is coded in shades of blue. Significantly deformable tissue (e.g. adipose tissue) is coded in shades of red. Changes in stiffness are also coded in shades of grey: from black for stiff tissues to bright-grey for soft tissues.
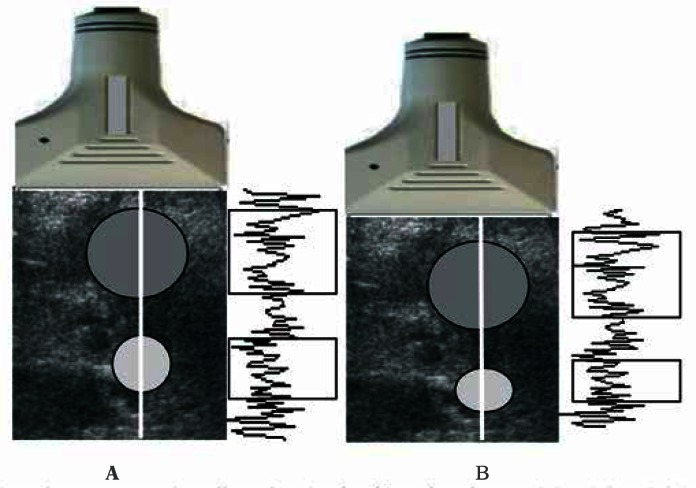
Figure 2 shows the principle for generating ultrasono-graphic echoes prior to and after tissue compression. Two circular areas (white and grey) were marked on the ultrasonogram before compression. After compression, the grey area relocated downwards together with the tissue –its shape was neither changed nor compressed, indicating hard tissue. The bright area is deformed, indicating rather soft tissue. Echoes from both these structures differed. The echoe signals from the hard area were only dislocated, whereas the echoe signals from the deformed area have changed. There will be difference in the correlation coefficient between the respective segments of both recorded echo series. For dislocated echoes, the correlation coefficient will be close to one, and it will decrease with increasing tissue deformity. The grey scale ranges from black for a complete correlation to white, when there is no correlation between the echoes, indicating a soft tissue.
Fig. 2.
The principle of estimation compression-induced tissue strain. The time segments of echoes indicated with rectangles correspond (on the left edge) to echoes from before compression (A) and (on the right curve) to echoes after compression (B). The echoes in the upper rectangles are very similar (only deeper located), whereas the lower rectangles contain echoes that are significantly altered due to deformation. Unchanged echo signals come from stiff tissue areas, whereas changed echo signals come from soft tissue areas. Strain is determined based on comparison of pre- and post-compression echoes. The higher the similarity, and thus the correlation coefficient for the echoes, the stiffer the tissue. The position of maxima in the cross-correlation function is an estimate of echo time shift between both lines.
The risk of malignancy increases with increasing Tsukuba score (Tab. 1). The sensitivity and specificity are the highest for the cut-off value between benign and malignant lesion (Tsukuba score 3/4)(6).
Tab. 1.
Tsukuba classification of breast neoplastic lesions
| Grade | Image | Description |
|---|---|---|
| 1 | 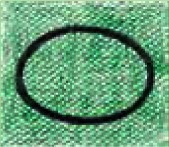 |
Strain is present in the entire hypoechoic area – the entire lesion and the surrounding tissues are green-coded Benign lesion |
| 2 | 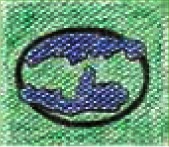 |
Strain is present in most of the hypoechoic area of the lesion – a mosaic pattern of green and blue can be seen in the lesion Benign lesion (image typical of adenofibromas) |
| 3 | 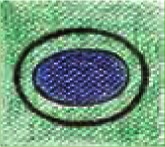 |
Strain visible only on the edges of the lesion – blue-coded centre and green-coded edges Difficult to differentiate lesion falling between benign and malignant |
| 4 | 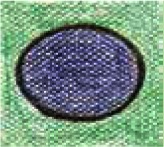 |
Strain is absent in the entire hypoechoic area of the lesion – the entire lesion is blue-coded Suspected malignancy |
| 5 |  |
Strain is absent in the entire hypoechoic area of the lesion and the surrounding tissues – the lesion and the surrounding tissues are bluecoded Serious suspicion of malignancy |
Technique:
In the first step, line A is registered with a light compression of the tissue.
The compression is increased by ‘slightly’ moving the probe (by a small dz section).
The line of echo signals is divided into short overlapping segments. The second line is shorter than the line from before compression by dz segment.
The cross-correlation between the two lines is calculated.
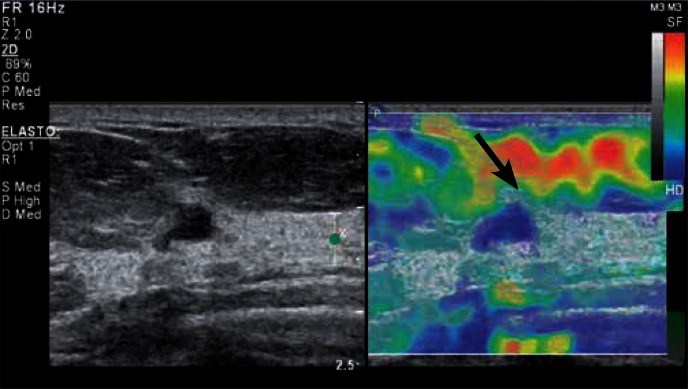
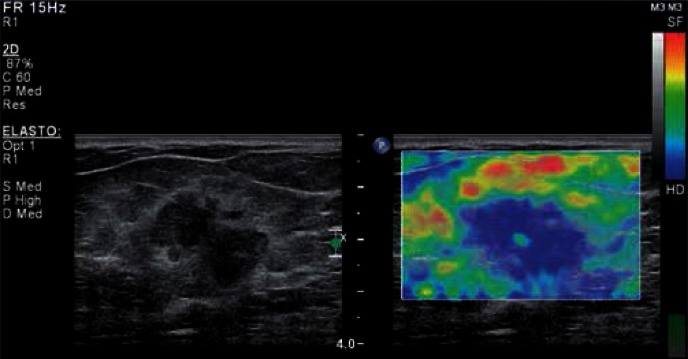
The position of maxima in the cross-correlation function is an estimate of echo time shift between both lines. If the elasticity modulus is similar only in certain tissue areas, the correlation coefficient will be increased only in those sections. Figures 3 and 4 show examples of lesion registration in compression elastography.
Fig. 3.
Evaluation of a focal lesion in the breast based on static elastography using breathing motion. BIRADS category 4 lesion (Breast Imaging-Reporting and Data System) confirmed by histopathological findings as invasive ductal carcinoma G1. In the B-mode (left), the lesion appears as hypoechoic with irregular margin and shape, with the dominance of lateral-lateral size over the anterior-posterior size. An enhancement (increased brightness due to wave propagation through the tissue with reduced attenuating effects). In the elastogram (on the right), the entire lesion and the adjacent tissues are blue-coded (the blue encodes non-deformable tissues) – Tsukuba score 5. The deformable adipose tissue (an arrow) located in the preglandular area is coded in red, yellow and green.
Fig. 4.
BIRADS category 5 lesion confirmed by postoperative histopathological findings as carcinoma mixtum (G2) in static elastography using breathing motion. In the B-mode (left) the lesion appears as hypoechoic with irregular, angular edges and irregular shape, with a hyperechoic rim around the lesion and with the dominance of lateral-lateral size over the anterior-posterior size. In the elastogram (on the right), the entire lesion is blue-coded (the blue encodes non-deformable tissues) – Tsukuba score 4.
Another compression elastography method involves the measurement of the velocity gradient for tissue displacement over a known distance under external compression. The technique uses tissue Doppler imaging. Since hard tissue dislocates as a whole, its velocity gradient will be close to zero. Soft tissue deforms with different velocity in function of depth and the local velocity gradient has a finite value. With appropriate scaling of Doppler velocities, their gradient is related to tissue elasticity modulus.
Tissue shear wave
Sarvazyan et al. showed the possibility of remote generation of shear waves induced by the acoustic radiation force(7). The acoustic radiation force is due to the phenomenon of absorption – it is directed towards radiation.
For total absorption:
| 8 |
where: F – radiation force, W – ultrasonic power, c – the speed of sound
In ARFI method, the push pulse deforms the tissue. The size of deformation is traced based on the cross-correlation between subsequent ultrasonic echoes in the registered ultrasound images. Both parameters – tissue strain (spatial derivative of the displacement) and displacement are inversely proportional to the stiffness of the tissue(8, 9).
In subsequent years, Bercoff et al. described and constructed an ultrasound for the detection of phenomena related to shear wave propagation in tissues. The authors have shown, based on modeling, that the shear wave induced by the radiation force depends on the visco-elastic properties of the tissue(10).
Shear wave propagation in tissues is much slower (1–10 m/s) compared to longitudinal waves. Shear waves propagate well in elastic media, and therefore not in water, where they are very quickly attenuated. Their propagation distance does not exceed dozen or so millimeters.
If a shear wave travels at the speed of 2 m/s, the wave front will travel 2 cm after 10 ms. With a resolution of 0.5 mm, at least 40 images of the area with a transverse dimension of 2 cm should be recorded, which results in 4000 frames per second (FR = 4000). In standard ultrasound, FR does not exceed a few dozen. The significantly higher speed of imaging requires new techniques based on synthetic apertures, image reconstruction from plane wave transmitting/ receiving processing in particular.
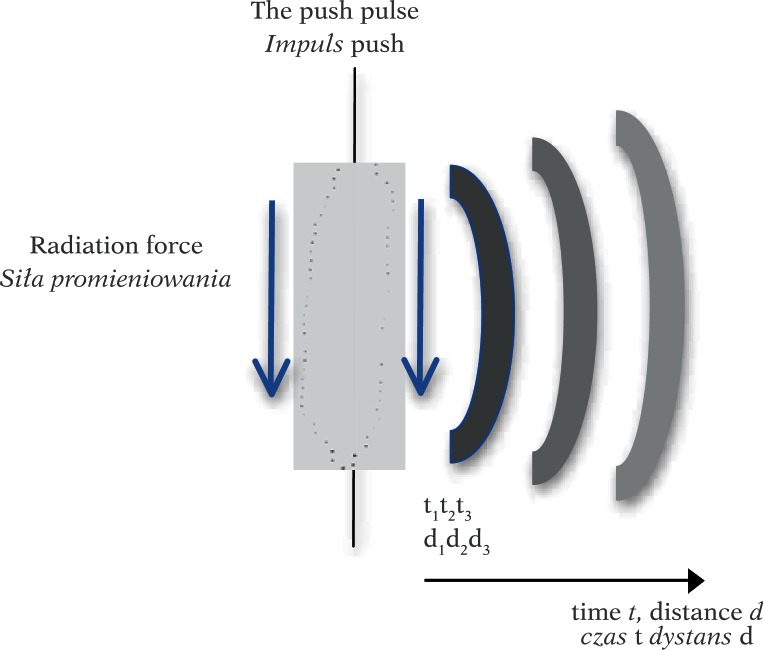
A plane wave is formed, e.g. in the new technology of synthetic aperture. In the SuperSonic Aixplorer, push pulses are produced by highly focused ultrasounds. Then, shear wave velocity is determined based on a 2D image reconstructed with a very high FR. The push pulses are generated by a strongly focused wave in the form of long impulses (tens of microseconds) with a center frequency of 4 MHz. The sequence of the next few pulses is sent by a linear array transducer. Each subsequent push pulse is focused slightly deeper – the velocity of the displacement of the focal depth is faster by at least a few meters per second compared to shear wave velocity. Local radiation force is formed in each focus, displacing the tissue by a few to several micrometers. Local, longitudinal tissue displacement induces a shear wave that propagates perpendicular to the direction where subsequent push pulses are generated (Fig. 5).
Fig. 5.
Radiation force generated by a long push pulse causes tissue dislocation and generates a spherical shear wave. The wave disappears with depth d (time t) as a result of attenuation (increasingly brighter wavefronts in the drawing)
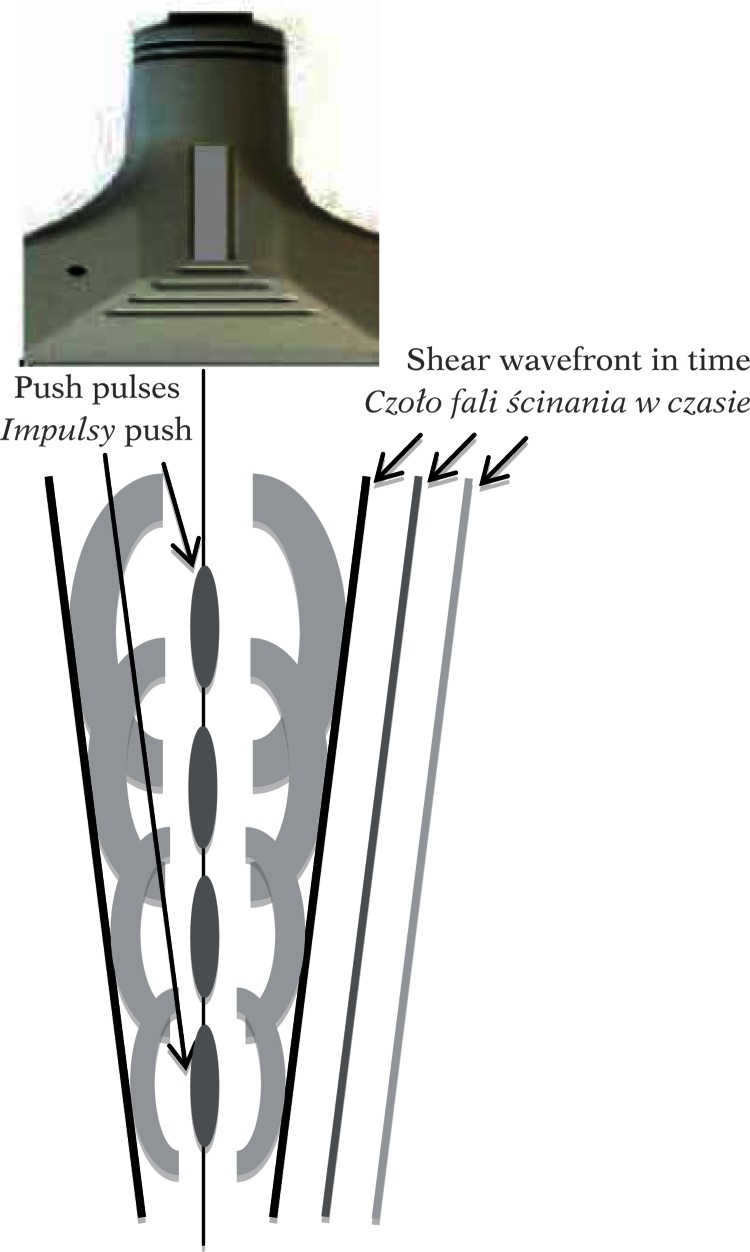
The front of the shear wave resembles a Mach cone moving at supersonic speed. The source of the shear wave, i.e. push pulses, is moved in the area of a few centimeters (4–6 cm) over about 6–8 ms (repetition frequency of about 500 Hz – thus the source of the wave travels at 6–7 m/s, i.e. a few times faster than the generated shear wave; hence the name supersonic) (Fig. 6). This is followed by a sequence of registration, e.g. 50 ultrasound images with FR >5000 and the process is repeated.
Fig. 6.
Shear wave generated by acoustic radiation force for subsequent push pulse locations. The inclination of the wavefront is proportional to the velocity of the shear wave, which depends on medium stiffness
Shear wave velocity is determined based on the correlation between subsequent images. Then, shear modulus and Young's modulus are calculated.
Shear wave propagates in the tissues at a velocity of a few meters per second, and the following relationship is observed assuming that the medium is purely elastic, the relation between the shear modulus and velocity is equal:
| 9 |
where: cs – shear wave velocity, ρ – tissue density. The assumption is also important for the visco-elastic model if the dispersion due to viscosity is to be neglected.
Therefore, if the elasticity modulus is much higher than the shear modulus B > > µ (up to 106 times in soft tissues), the relationship between the Young's modulus and the elasticity is as follows:
| 10 |
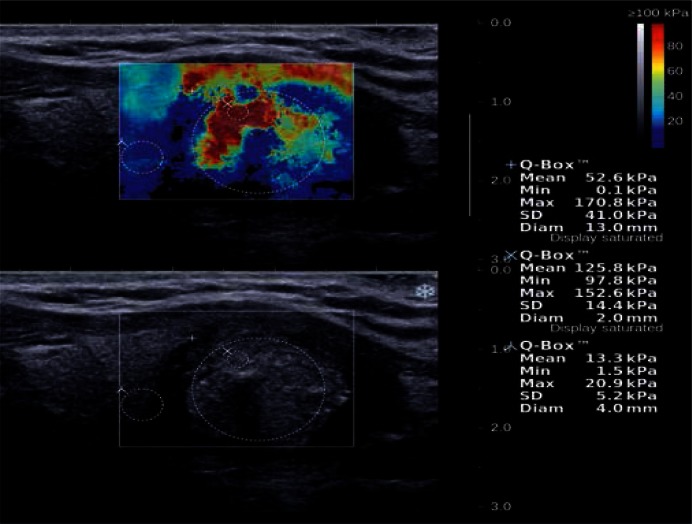
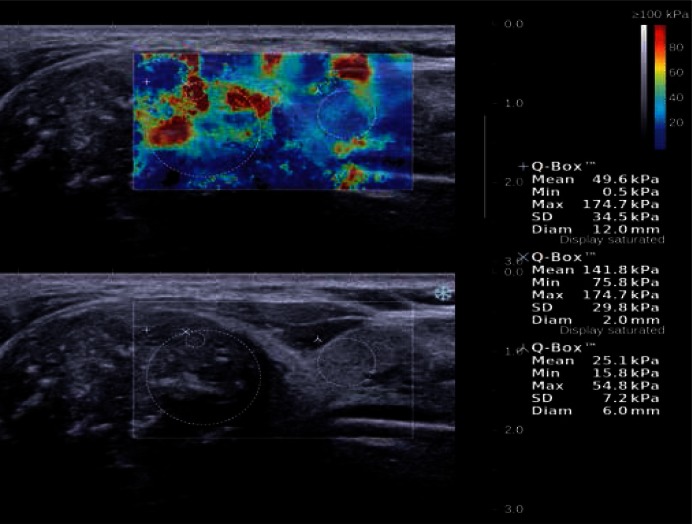
Shear wave velocity is also determined in transient elastography, where tissue is displaced/deformed after a short and rapid hit by vibrating, piston-like activator through an opening in the ultrasound transducer. Shear wave velocity and, as a result, the Young's modulus are determined based on the M-mode image of the tissue(11, 12). The technique is of clinical significance in liver diagnostics. Figures 7 and 8 show examples of elastic thyroid lobe image registration.
Fig. 7.
A solid-liquid lesion with microcalcifications, postoperatively classified as classic papillary carcinoma, is visible in the lower center of the left thyroid lobe in the longitudinal section. SWE elasticity image (the top image) shows three regions of interest (ROIs): „+” refers to the area comprising the largest portion of lesion, „x” refers to a 2-milimeter area from the stiffest part of lesion, „λ” refers to an area of the surrounding tissues with normal thyroid parenchyma. The maximum E value is 152.6 kPa in the ROI of the stiffest part of the lesion (coded in red – tissues with Young's modulus E > 80 kPa), and 20.9 kPa in the surrounding tissues.
Fig. 8.
A solid hypoechoic lesion with microcalcifications (B-mode), classified as papillary carcinoma in the postoperative assessment, located in the upper pole of the right thyroid lobe. SWE elasticity image (the top image) shows maximum E values of 174.7 kPa in the 2 mm ROI in the stiffest part of the lesion and 54.8 kPa in the surrounding tissues.
It is assumed that Young's modulus is about 10 kPa for parenchymal tissue, about 20 kPa for muscles and 50 kPa for the connective tissue. For the rubber, which intuitively appears to be similar to a tissue, the Young's modulus ranges between 900 and 3000 kPa. In the breast, the elasticity modulus is close to 2000 Mpa for various types of tissue, while the shear modulus ranges from 20 kPa for adipose tissue to 100 kPa for cancer (Tab. 2).
Tab. 2.
Elasticity modulus for breast and prostate tissue(4)
| Body part | Type of tissue | Elasticity modulus [kPa] | |
|---|---|---|---|
| 5% initial compression | 20% initial compression | ||
| Breast | adipose tissue | 19 ± 7 | 20 ± 6 |
| healthy glandular tissue | 33 ± 11 | 57 ± 19 | |
| fibromas | 107 ± 31 | 233 ± 59 | |
| ductal carcinoma | 25 ± 4 | 301 ± 58 | |
| invasive carcinoma | 93 ± 33 | 490 ± 112 | |
| Prostate | healthy tissue | 69 ± 17 | 70 ± 14 |
| benign prostatic hyperplasia | 36 ± 9 | 36 ± 11 | |
| cancer | 100 ± 20 | 221 ± 32 | |
Conclusions
Shear wave elastography, which is based on tissue displacement due to remotely generated acoustic radiation force, bears great promises for the quantitative imaging of local tissue stiffness changes. However, the assumed linear, isotropic behavior of tissues as well as their incompressibility and homogeneity are far from reality. Various effects associated with wave refraction and reflection are disregarded in standard ultrasonography despite the fact that they significantly alter the image of transverse wave propagation. While differences in the longitudinal wave velocities do not exceed 10%, transverse wave velocity may vary up to 10-fold: from 1 m/s to 10 m/s. This results in significant reflective effects (different acoustic impedances for transverse wave). Even greater effects are associated with shear wave refraction on the border between tissues that significantly differ in cs velocities.
The mechanical tissue response to external loading basically depends on its viscoelastic properties, which were well-described in the Kelvin-Voigt model. Elastic materials are subject to Hooke's law – there is a general relationship between stress σ and strain ɛ: σ=Eɛ. In viscous materials, stress is proportional to dislocation velocity and it equals σ=mdɛ/dt where µ is the viscosity coefficient of the material. For the Kelvin-Voigt model, the viscosity component and the elasticity component are connected in parallel. If the deformation proceeds slowly, as in compressive elastography, the time derivative of displacement is low and the viscosity may be neglected. In this case, the Kelvin- Voigt model can be approximated based merely on the elastic component.
Conflict of interest
Authors do not report any financial or personal connections with other persons or organizations, which might negatively affect the contents of this publication and/or claim authorship rights to this publication.
References
- 1.Bamber J, Cosgrove D, Dietrich CF, Fromageau J, Bojunga J, Calliada F, et al. EFSUMB guidelines and recommendations on the clinical use of ultrasound elastography. Part 1: Basic principles and technology. Ultraschall Med. 2013;34:169–184. doi: 10.1055/s-0033-1335205. [DOI] [PubMed] [Google Scholar]
- 2.Wells PN, Liang HD. Medical ultrasound: imaging of soft tissue strain and elasticity. J R Soc Interface. 2011;8:1521–1549. doi: 10.1098/rsif.2011.0054. [DOI] [PMC free article] [PubMed] [Google Scholar]
- 3.Ophir J, Céspedes I, Ponnekanti H, Yazdi Y, Li X. Elastography: a quantitative method for imaging the elasticity in biological tissues. Ultrasonic Imaging. 1991;13:111–134. doi: 10.1177/016173469101300201. [DOI] [PubMed] [Google Scholar]
- 4.Krouskop TA, Wheeler TM, Kallel F, Garra BS, Hall T. Elastic moduli of breast and prostate tissues under compression. Ultrasonic Imaging. 1998;20:260–274. doi: 10.1177/016173469802000403. [DOI] [PubMed] [Google Scholar]
- 5.Itoh A, Ueno E, Tohno E, Kamma H, Takahashi H, Shiina T, et al. Breast disease: clinical application of US elastography for diagnosis. Radiology. 2006;239:341–350. doi: 10.1148/radiol.2391041676. [DOI] [PubMed] [Google Scholar]
- 6.Cho N, Jang M, Lyou CY, Park JS, Choi HY, Moon WK, et al. Distinguishing benign from malignant masses at breast US: combined US elastography and color Doppler US-influence on radiologist accuracy. Radiology. 2012;262:80–90. doi: 10.1148/radiol.11110886. [DOI] [PubMed] [Google Scholar]
- 7.Sarvazyan AP, Rudenko OV, Swanson SD, Fowlkes JB, Emelianov SY. Shear wave elasticity imaging: a new ultrasonic technology of medical diagnostics. Ultrasound Med Biol. 1998;24:1419–1435. doi: 10.1016/s0301-5629(98)00110-0. [DOI] [PubMed] [Google Scholar]
- 8.Nightingale K, Bentley R, Trahey G. Observations of tissue response to acoustic radiation force: opportunities for imaging. Ultrason Imaging. 2002;24:129–138. doi: 10.1177/016173460202400301. [DOI] [PubMed] [Google Scholar]
- 9.Nightingale K, McAleavey S, Trahey G. Shear-wave generation using acoustic radiation force: in vivo and ex vivo results. Ultrasound Med Biol. 2003;29:1715–1723. doi: 10.1016/j.ultrasmedbio.2003.08.008. [DOI] [PubMed] [Google Scholar]
- 10.Bercoff J, Tanter M, Fink M. Supersonic shear imaging: a new technique for soft tissue elasticity mapping. IEEE Trans Ultrason Ferroelect Freq Contr. 2004;51:396–409. doi: 10.1109/tuffc.2004.1295425. [DOI] [PubMed] [Google Scholar]
- 11.Sandrin L, Fourquet B, Hasquenoph JM, Yon S, Fournier C, Mal F, et al. Transient elastography: a new noninvasive method for assessment of hepatic fibrosis. Ultrasound Med Biol. 2003;29:1705–1713. doi: 10.1016/j.ultrasmedbio.2003.07.001. [DOI] [PubMed] [Google Scholar]
- 12.Sandrin L, Tanter M, Catheline S, Fink M. Shear modulus imaging with 2-D transient elastography. IEEE Trans Ultrason Ferroelectr Freq Control. 2002;49:426–435. doi: 10.1109/58.996560. [DOI] [PubMed] [Google Scholar]


