Abstract
In this paper, the authors attempt to concisely present the anatomical and pathophysiological bases as well as the principles for echocardiographic evaluation of mechanical aspects of cardiac function based on speckle tracking method. This technique uses a phenomenon involving the formation of characteristic image units, referred to as speckles or acoustic markers, which are stable during cardiac cycle, on a two-dimensional echocardiographic picture. Changes in the position of these speckles throughout the cardiac cycle, which are monitored and analyzed semi-automatically by a computer system, reflect deformation of both, cardiac ventricle as a whole as well as its individual anatomical segments. The values of strain and the strain rate, as well as the range and velocity of the movement of these markers, which are in close relationship with multiple hemodynamic parameters, can be visualized as various types of charts – linear, two- and three-dimensional – as well as numerical values, enabling deeper insight into the mechanical and hemodynamic aspects of cardiac function in health and disease. The use of information obtained based on speckle tracking echocardiography allows to understand previously unclear mechanisms of physiological and pathophysiological processes. The first part of the study discusses the formation of a two-dimensional ultrasound image and the speckles, as well as the technical aspects of tracking their movement. The second part presents in more detail the methodology of speckle-tracking echocardiography, the characteristic abnormalities of cardiac mechanics presenting in different clinical entities, and the limitations related to given clinical and technical issues.
Keywords: ventricular function, myocardial strain, myocardial strain rate, speckle tracking echocardiography
Abstract
W niniejszej pracy autorzy podejmują próbę zwięzłego przedstawienia anatomicznych i patofizjologicznych podstaw oraz zasad echokardiograficznej oceny mechanicznych aspektów pracy serca w oparciu o metodę śledzenia markerów akustycznych. Metoda ta wykorzystuje zjawisko powstawania w dwuwymiarowym obrazie echokardiograficznym charakterystycznych, niezmieniających się w czasie jednostek obrazowych, określanych mianem plamek lub markerów akustycznych. Zmiany położenia plamek, obserwowane i analizowane półautomatycznie w trakcie całego cyklu serca przez system komputerowy, odzwierciedlają odkształcenie zarówno całej komory, jak i jej poszczególnych segmentów anatomicznych. Wartości odkształcenia, tempa odkształcenia oraz zakresu i prędkości ruchu markerów, pozostające w ścisłym związku z różnorodnymi parametrami hemodynamicznymi, mogą być prezentowane graficznie jako różnego rodzaju wykresy (liniowe, dwu- i trójwymiarowe) oraz wartości liczbowe, co umożliwia pogłębiony wgląd w mechaniczne i hemodynamiczne aspekty funkcji serca w stanach zdrowia i choroby. Wykorzystanie informacji płynących ze śledzenia markerów akustycznych umożliwia zrozumienie dotychczas niejasnych procesów fizjologicznych i patofizjologicznych. W pierwszej części pracy omówiono powstawanie ultrasonograficznego obrazu dwuwymiarowego i markerów akustycznych oraz techniczne aspekty analizy ich ruchu. W drugiej części przedstawiono bardziej szczegółowo metodykę badania za pomocą techniki śledzenia markerów akustycznych, omówiono charakterystyczne zaburzenia mechaniki mięśnia serca w różnych stanach klinicznych, a także wskazano ograniczenia metody spowodowane kwestiami technicznymi oraz problemami występującymi specyficznie w niektórych chorobach.
Introduction
The heart is a complex, three-dimensional structure performing continuous, cyclic mechanical work to maintain blood circulation in the cardiovascular system. The performance of the cardiac pump primarily depends on myocyte efficiency, however, ventricular geometry, heart valve and vascular efficiency, loading conditions as well as heart rate are important, mutually dependent factors determining cardiac efficiency. An analysis of heart function should consider both, the contraction-relaxation cycle with alternate shortening and lengthening of cardiac myocytes (its strength and dynamism), as well as all aspects of global ventricular strain as a whole, determining the volume of blood pumped by the ventricle and delivered to tissues. At the cellular level, contraction is characterized by two coexisting phenomena: contractility and inotropism. The maximum velocity of sarcomere shortening, which results from the rate of actin-myosin cross-bridge formation, which in turn depends on the degree of contractile protein phosphorylation, is a measure of contractility. Inotropism, expressing the maximum force of contraction, depends (at the level of sarcomere) on the number of myosin bridges and the availability of calcium ions enabling interactions between the bridges. In healthy myocardial contraction, the basic functional element, i.e. myocyte, is shortened by nearly 15% of its initial length, resulting in left ventricular (the highest mechanical efficiency) wall thickening by 35–40% and reduction in its volume by 55–65%(1–5). This unusually beneficial correlation between a relatively small shortening of cells and a major change in the global volume is possible due to specific, three-layer arrangement of muscle fibers, promoting interactions and mutual reinforcement of changes in the shape of the individual cells, as well as a significant involvement of the extracellular matrix in the process of well-organized deformation of cardiac structures(1–5). Muscle cell contraction leads to a change in the shape of cardiac chambers and generation of force necessary to pump the blood from ventricles to arteries despite their resistance. Contractility – the primary feature of myocytes determining cardiac output, can be directly assessed only based on the generated loop of pressure-volume relationship under changing preload conditions. However the use of this method is limited to laboratory experimental studies. Even in case of cardiac catheterization and measuring a number of parameters, such as the rate of blood pressure rise or the stroke volume, information is obtained on the resultant contractility, the force of contraction, preload and afterload(1, 2, 5).
Ultrasound examination provides non-invasive data on the myocardial functional status in a given patient. The information is obtained by analyzing the degree and the dynamics of the change in ventricular shape as a whole, e.g. by calculating the ejection fraction, or its fragments – segmental systolic function, by measuring cardiac and vascular blood flow velocity in sub-periods of the cardiac cycle. None of the diagnostic methods used so far (with the exception of magnetic resonance imaging) allowed for a quantitative assessment of an impaired function of different ventricular segments and layers as well as their involvement in global cardiac dysfunction or for a simultaneous quantitative analysis of the kinetics of all segments in a working ventricle(5–8).
A novel echocardiographic technique utilizing the process of acoustic marker tracking, i.e. speckle-tracking echocardiography (STE), based on the analysis of the movement of selected myocardial fragments, is a successful attempt to meet the need for a global assessment of mechanical cardiac function. Advanced computation technique allows for a simultaneous monitoring of both velocity and direction of the movement of all ventricular wall segments visible on the image as well as changes in the dynamics of this movement during the subsequent phases of the cardiac cycle (5–8).
The use of STE requires a deeper understanding of the principles underlying the formation of an ultrasound image, the anatomy of myocardial walls translating into the mechanics of their work, the knowledge on the sub-periods of cardiac cycle, the ability to integrate various aspects of a simultaneous movement of different segments and, finally, understanding the meaning and the method of the assessment of this movement dynamics.
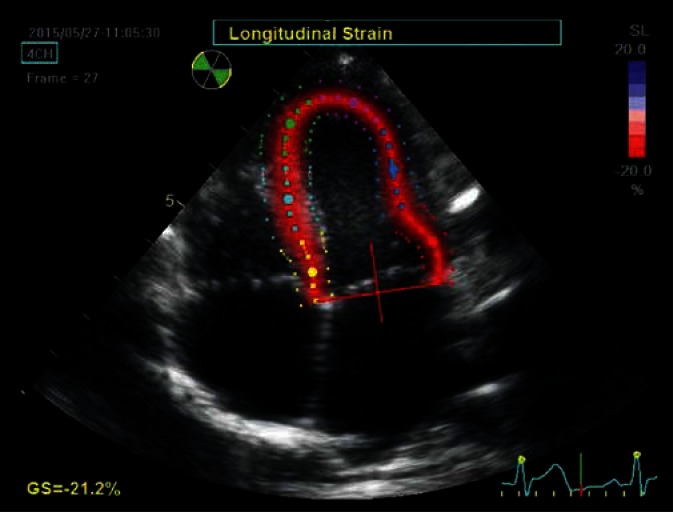
How is a two-dimensional moving image of the heart formed? How can we quantitatively assess the dynamics of heart structure movement based on a two-dimensional image? What are speckles? Ultrasound waves, a carrier of information in the process of ultrasound image formation, are emitted into the examined tissue, where they partially bounce back from the tissue layers and return to crystals, from which they were emitted. The mechanical energy of the bounced wave results in another crystal deformation and generation of electric current directly proportional to the amplitude of bounced ultrasound waves, which in turn is proportional to the density of the tissue acting as a barrier for the spreading ultrasounds. The intensity of the formed electrical impulses is measurable and their numerical value, after appropriate transformation, can be expressed as the intensity of image pixels brightness on ultrasound screen: low amplitudes – poor shining – dark pixels, high amplitudes – bright pixels. In this way, low density tissue areas, which do not prevent wave propagation, are visualized as dark areas, while high density regions, from which a substantial portion of ultrasound wave is bounced back, are presented as bright areas. Usually a 256-step grayscale, with 0 corresponding to the maximum blackness (no bounced wave), and 255 corresponding to maximum whiteness (maximum bouncing) is used. Since the speed at which the wave spreads through the body tissues is constant, the time at which a bounced signal reaches the ultrasound transducer, i.e. the time needed for an impulse to travel from the probe to the barrier and come back, can be calculated using a formula for velocity, distance and time, in order to precisely determine the distance from which a given signal bounces back to the probe and place its reference point on the imaging line. Summing multiple lines emitted by a single, moving crystal in the case of mechanical transducer or multiple crystals lined up side by side in the case of phased array probes on the surface of the imaging sector results in the formation of a two-dimensional image, which represents a grey-scale map reflecting the differences in tissue echogenicity, i.e. differences in the ability of tissue to reflect the ultrasound wave. This is a highly reliable real-time image used for an assessment of all aspects of heart movement. Pixel, i.e. a square whose size depends on technical parameters of the equipment used, is the smallest unit of an image. The echogenicity of the smallest area of tissue in a single pixel is expressed numerically as a certain degree in the grey-scale (0 to 255). Individual pixels make up slightly larger groups corresponding to different microelements (their size approximately corresponds to the ultrasound wavelength), referred to as speckles. Since the tissue structure in a given region does not change significantly during cardiac cycle, pixel configuration for a given fragment, which forms a speckle, is also stable, highly specific for a given tissue fragment, thus compared to a finger-print. Each pixel corresponds to a specific number, therefore, the use of a special software allows for a rapid analysis of pixel configuration in the field of vision as well as for tracking changes in speckle location on subsequent image frames, so that they serve as acoustic markers of myocardial strain. This phenomenon is used for the analysis of the complex cardiac mechanics based on the novel method of speckle tracking echocardiography(5–10). A change in the position of larger groups of speckles (e.g. ventricular wall segments) can be tracked on subsequent frames simultaneously for the whole surface of the two-dimensional image owing to a manual delineation of the region of interest using an appropriate software (Fig. 1). The reliability of the evaluation of speckle movement was assessed by comparison with sonomicrometry using microcrystal implantation into the ventricular muscle in experimental animals, as well as MRI and Doppler tissue imaging (DTI)(9, 10). The possibility to observe speckle movement in all directions on the surface of the investigated plane allows to avoid limitations typical of Doppler methods, such as DTI, where only velocity vector component directed towards the probe is analyzed. STE allows for an assessment of the distance travelled by a given myocardial segment in a given time frame as well as the dynamics of this movement, while a simultaneous analysis of a number of areas allows to evaluate the synchrony of the movement of different segments, etc.(5–10)
Fig. 1.
Apical four-chamber view, late systolic phase. The image is used to determine the longitudinal strain. The internal – endocardial border of the left ventricle was outlined manually by an investigator, then the system generated the external line delineating the epicardial border and the RV endocardial septal surface as well as the midline, delineating the middle myocardial layer. This was followed by a manual adjustment of the external border to the actual epicardial border and the septum. Furthermore, the system automatically ‘smoothed’ the ROI image borders during strain analysis. The region of interest was automatically divided into six equal segments corresponding to anatomical segments, each represented by a different color. Line charts for segmental strain generated as a result of analysis are in colors corresponding to the individual segments in the 2D image. The longitudinal strain component is analyzed along directions tangential to the above described lines defining the ROI (arrows). The points move closer to each other during systole and move away from each other during diastole. The degree of this deformation is expressed as strain. The shortening of the individual segments is coded red (negative strain), while their extension is coded blue (positive strain). The intense red color distributed uniformly along the entire analyzed region indicates advanced, final phase of the process of shortening of the investigated segments. Uniform color intensity in all segments indicated normal synergistic systolic LV function in a given patient
The architecture of the left ventricle and the exponents of myocardial mechanics
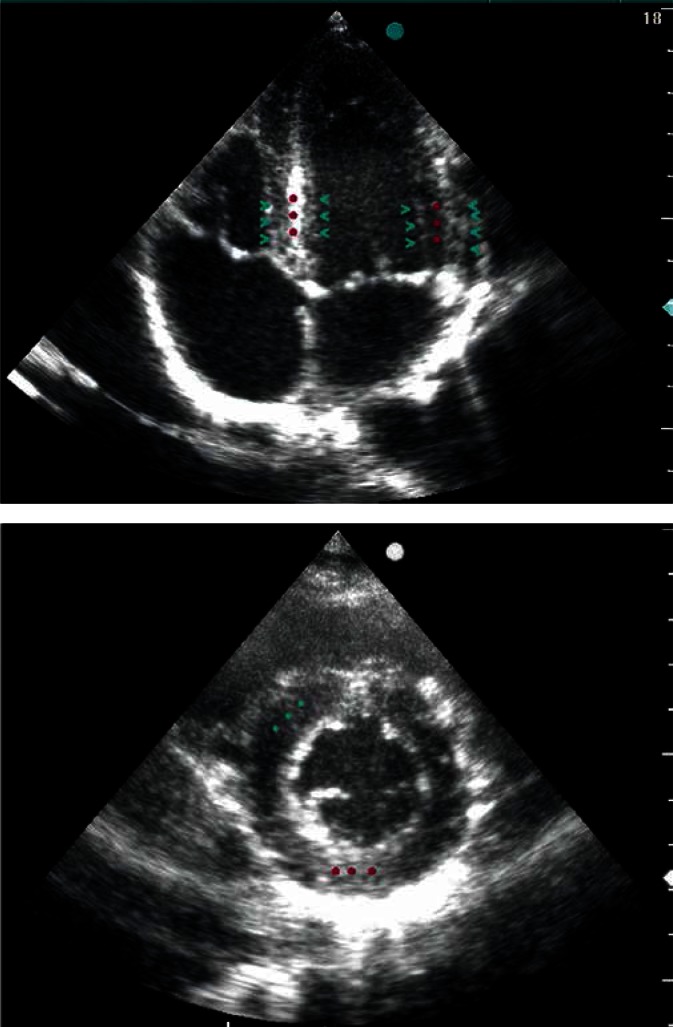
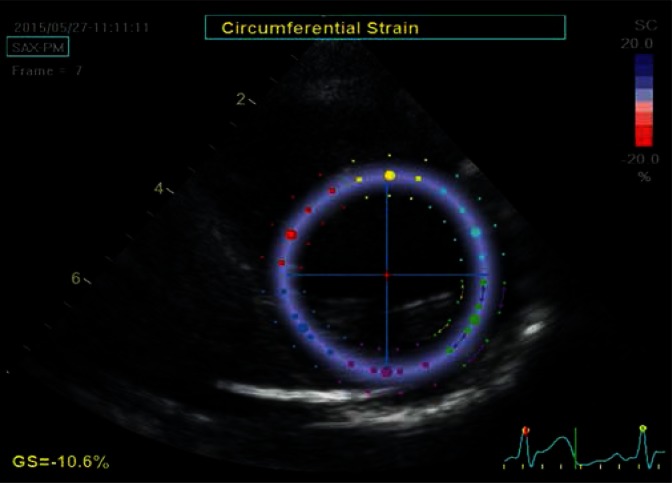
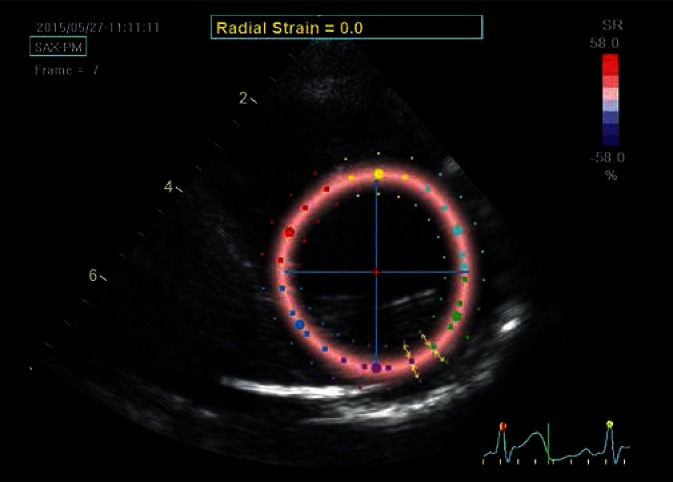
Knowledge on cardiac micro and macro architecture is useful in understanding the complex mechanics of this organ as the individual layers of the ventricular muscle behave differently during both diastole and systole, thus determining the exceptional pattern of the complex movement of the whole organ observed using STE. Architectural differences in the structure of the left and the right ventricle are also important for a full analysis of cardiac mechanics. The left ventricle has a regular shape of an ellipsoid. Its walls are composed of muscle fiber bundles arranged in three layers: subendocardial and subepicardial with spirally oriented muscle bundles, as well as midmyocardial layer with circular arrangement of fibers. In the subendocardial layer, the cells are arranged almost longitudinally, at an angle close to 80° relative to LV transverse plane; this angle gradually decreases towards the epicardium. The angle is close to 0° relative to transverse plane in the midmyocardial layer with a circular arrangement of fibers, and –60° in the subendocardial layer(1–5, 11–13). This structural anisotropy of the LV walls affects ultrasonic wave propagation in the myocardium, and thus the appearance of the muscle tissue seen on echocardiographic images(6). Stronger signals and brighter speckles occur when the fibers are aligned perpendicular to the ultrasound beam, whereas weaker signals – if they are parallel. Therefore, the bright speckles visible in the middle layer of the interventricular septum in the apical four-chamber view represent circularly arranged fibers, whereas darker speckles in the subendocardial layers (from LV and RV) – obliquely oriented fibers. In the short axis, brighter speckles are seen in the anteroseptal segment and the posterior wall, where circular fibers run perpendicular to the ultrasonic beam, and darker speckles in the septum and the lateral wall – fibers are substantially parallel to the beam direction in these segments(14, 15). This relationship between echo intensity and the muscle fiber arrangement is crucial for ventricular wall motion analysis using the speckle tracking method (Fig. 2). The above described three LV wall layers determine the myocardial strain components. As a result of fiber arrangement, the subendocardial layer is primarily responsible for the longitudinal component of LV motion, whereas the midmyocardial and subepicardial layers – for circular and radial component. The longitudinal component, which is expressed in systolic shortening of the base-to-apex length, should be observed in apical projections; the radial component – centripetally (perpendicular to the walls of the left ventricle) – and the circular component – tangentially to LV walls – in transverse projections(6–8) (Figs. 3 and 4). Usually, the behavior of the ventricular walls throughout the cardiac cycle is considered as a homogeneous phenomenon. However, the individual layers of the LV wall show significant time differentiation in electrical stimulation and deformation. In the presystolic phase, the excitation wave first reaches the subendocardial layer, while the subepicardial layer is the last one to be stimulated. Therefore, the early shortening of the subendocardial fibers is accompanied by a secondary extension of the inactive subepicardial fibers, resulting in an early, presystolic change in the ventricular shape(5, 11, 16). During ejection, both subendocardial and subepicardial layers shorten simultaneously, therefore, no time differentiation is observed in the motion of the individual layers and segments under normal conditions. Differences in the extent of the individual components of left ventricular deformation are seen: the degree of circular strain during systole is higher than the degree of longitudinal LV strain. The distribution of the deformity in different ventricular regions is also non-uniform: muscle shortening is higher in the apical region and in the middle portion compared to the base, which can be observed as a strain gradient in the base-apex axis(13, 16, 17). The post ejection period is also characterized by significant time differentiation in the course of relaxation of different groups of myocytes; this process, as opposed to contraction, first occurs in the subepicardial layer and proceeds to the endocardium. As a result, fiber elongation in the subepicardial layer accompanied by an opposing shortening of the subendocardial fibers is initially observed(11, 13, 17). This transient differentiation is responsible for postsystolic shortening of the myocardial segments, which may also occur in healthy individuals(5).
Fig. 2.
Two-dimensional four-chamber view (A) and a cross section of the left ventricle at the level of the papillary muscles (B), reflecting LV muscle fiber arrangement. Circumferentially oriented muscle fibers (perpendicular to the ultrasonic beam), located in the middle layer, reflect the ultrasonic waves more intensely than the oblique fibers, located in the external LV wall layers, which is expressed in the formation of intense, linear echo in the middle layer (red stars) and weaker echogenicity of the subendocardial and subepicardial layers (green arrow heads)
Fig. 3.
Parasternal transverse view of the left ventricle at the level of the papillary muscles. The image is used to determine the circumferential strain. The strain is analyzed in the tangential direction to the lines delineating the borders of the ROI (arrows) laid on the image in a similar manner as in Fig. 2. Similarly, the ROI was automatically divided into six equal color-coed segments corresponding to anatomical segments. The image was captured at late diastole, at a time point when speckles move away from each other, therefore the whole analyzed region is coded in a uniform blue color, indicating a homogeneous contraction throughout all analyzed segments
Fig. 4.
Parasternal transverse view of the left ventricle at the level of the papillary muscles; determination of the radial strain. Although the ROI is the same as for the circumferential strain, the strain is now analyzed perpendicular to lines delineating LV borders (arrows). In the case of systolic radial strain – as a result of ventricular wall thickening – speckles move away from each other and move closer during diastole, unlike the other strain components, which are brought closer to each other during systole. In order to maintain imaging uniformity, red color always codes for the expected direction of systolic strain, i.e. the color will indicate positive systolic radial strain values. The presented image was captured in the initial systolic phase, hence the uniform pale-pink color of the strain map
Radial component
According to the principle of mass conservation, longitudinal and circular myocyte contraction causes an appropriate thickening of the wall formed by these cells. However, the increase in the LV wall thickness secondary to its contraction is not a direct consequence of myocyte shortening, but it also results from the movement of a group of cells relative to each other due to specific effects of the scaffold formed by the extracellular matrix. As a result, about 15% shortening of myocytes translates, under normal conditions, into more than 40% increase in muscle thickness and more than 60% reduction in the left ventricular volume(3–5). Higher degree of radial strain is observed in the subendocardial compared to subepicardial layer. This difference does not result from the differences in the contractility between the layers, but is a consequence of tissue geometry and incompressibility – the subendocardial layer has a smaller radius, therefore the increase in its thickness during systole is higher compared to the subepicardial layer(10, 11).
Rotational movement mechanics
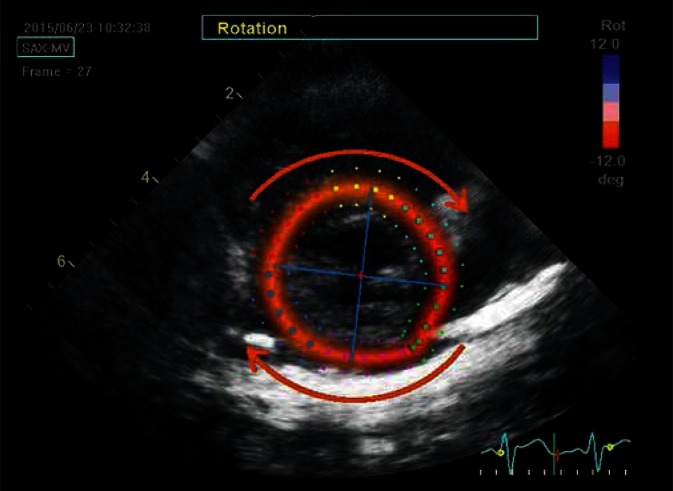
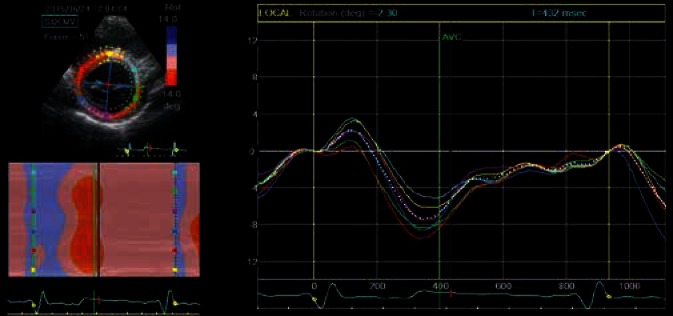
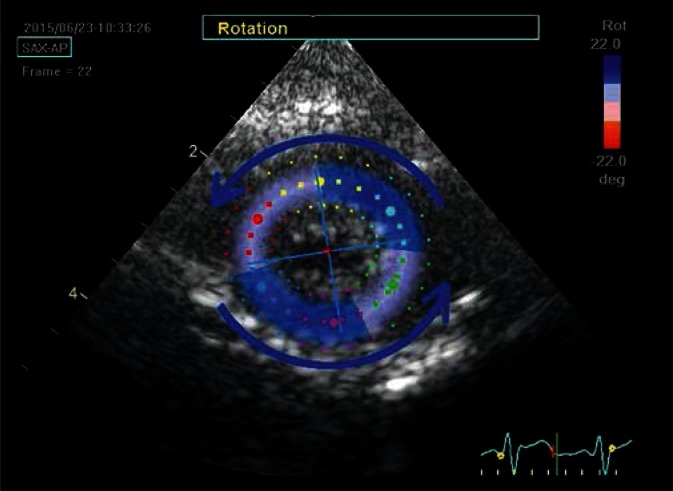
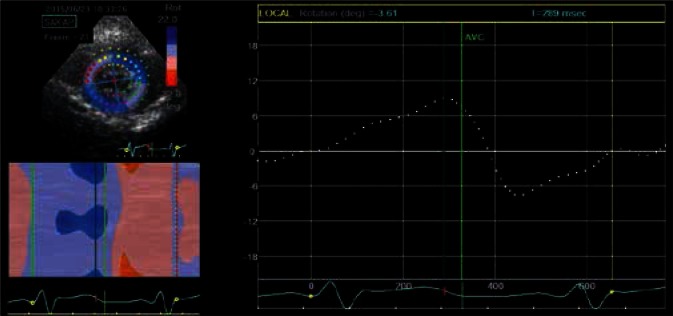
Spiral and lamellar arrangement of muscle fibers accounts for yet another component of left ventricular mechanics, i.e. its rotation. Basal region rotation is secondary to clockwise contraction, while the apical rotation is counter clockwise (with the observation point located at the apex)(10, 18). In a normal heart, subendocardial shortening occurs, as already mentioned, earlier than subepicardial shortening. In the presystolic period, the subendocardial shortening accompanied by subepicardial elongation results in a short-lasting, clockwise apical rotation. During ejection, stimulation and contraction of the subepicardial layer, which has a larger radius, generate greater rotational moment and determine rotational direction: counter clockwise in the apical region, clockwise in the basal region. Twisting and shortening of muscle fibers result in extracellular matrix deformation, thus storing potential energy used in the diastole. The energy is released during the subsequent untwist of the ventricle, allowing for a diastolic sucking up of the venous blood and an early ventricular filling. Time differentiation in the individual layers is also observed during diastole. Myofiber relaxation occurs earlier in subepicardium than subendocardium, therefore during early diastole, both subepicardial fiber elongation and the opposite subendocardial shortening facilitate clockwise untwisting. It is worth noting that 50–70% of the ventricular untwisting occurs during isovolumetric relaxation, and the rest – at the stage of early ventricular filling. Therefore, as opposed to systolic phase, when the twisting and shortening occur simultaneously, during diastole, the untwisting clearly precedes elongation and ventricular enlargement. Consequently, a linear correlation between twisting and a change in left ventricular systolic volume as well as a non-linear during diastole are observed(10, 18–20). The above described phase changes in the shape of the individual myocardial elements can be assessed in detail based on STE (Figs. 5, 6, 7, 8).
Fig. 5.
Rotational movement of the heart base in a clockwise direction as well as apical rotation in the opposite direction are observed during contraction from the side of the LV apex. STE allows for quantitative and qualitative tracking of the parameters of this movement. Parasternal transverse view shows the left ventricle at the level of mitral valve. The ROI was delineated according to the same principles. The red color indicates clockwise rotational movement, whereas the blue indicates the opposite direction (arrows). The two intersecting lines represent axes delineating the horizontal and vertical direction at the onset of the cardiac cycle; their rotation illustrates the rotation of the whole left ventricle around the long axis. The image was captured in the late systolic phase, hence the red color and axis deviation to the right (clockwise)
Fig. 6.
An analysis of the rotational movement of the individual segments allows to present its parameters in time in the form of line graphs (each segment in different color) or in the form of a two-dimensional ribbon graph. The figure shows an example of such graphs, illustrating basal left ventricular rotation. The analysis relates to the same ROI as in the previous figure. Clockwise rotation has negative values and is red-coded, counterclockwise rotation has positive values and is blue-coded. Line graph colors correspond to the individual segments in the two-dimensional image. The white dotted line represents a diagram for the average value for all analyzed segments. Early systolic short-lasting basal counterclockwise rotation, which is blue-coded in the ribbon diagram, and represented as positive curve deflection on line graphs, can be observed in the initial, early systolic phase of the cardiac cycle. This is followed by the main part of basal LV rotation – an intense red color and negative deflection of segmental curves. Restoration of baseline values takes place in the initial diastolic phase, prior to ventricular filling
Fig. 7.
Parasternal transverse view of the left ventricle at the apical level; late systolic phase. During systole, the apex rotates counterclockwise, hence the blue color of ROI map and the deviation of main direction axes to the left
Fig. 8.
The direction and the range of this movement is expressed in degrees and can be read from line and ribbon graphs. The presented figure only shows an averaged graph, describing global apical rotation
Conflict of interest
Authors do not report any financial or personal connections with other persons or organizations, which might negatively affect the contents of this publication and/or claim authorship rights to this publication.
References
- 1.Fogel MA. Ventricular Function and Blood Flow in Congenital Heart Disease. Blackwell Publishing Ltd; 2005. Ventricular Function – the Basics of the Discipline. [Google Scholar]
- 2.Beręsewicz A, Mączewski M. Biofizyka serca. In: Beręsewicz A, editor. Patofizjologia niewydolności serca. Warszawa: CMKP; 2010. [Google Scholar]
- 3.Buckberg GD, Hoffman JI, Coghlan HC, Nanda NC. Ventricular structure – function relations in health and disease. Part I: The normal heart. Eur J Cardiothorac Surg. 2015;47:587–601. doi: 10.1093/ejcts/ezu278. [DOI] [PubMed] [Google Scholar]
- 4.Lunkenheimer PP, Redmann K, Kling N, Jiang X, Rothaus K, Cryer CW, et al. Three-dimensional architecture of the left ventricular myocardium. Anat Rec A Discov Mol Cell Evol Biol. 2006;288:565–578. doi: 10.1002/ar.a.20326. [DOI] [PubMed] [Google Scholar]
- 5.Sengupta PP, Korinek J, Belohlavek M, Narula J, Vannan MA, Jahangir A, et al. Left ventricular structure and function: basic science for cardiac imaging. J Am Coll Cardiol. 2006;48:1988–2001. doi: 10.1016/j.jacc.2006.08.030. [DOI] [PubMed] [Google Scholar]
- 6.Leitman M, Lysyansky P, Sidenko S, Shir V, Peleg E, Binenbaum M, et al. Two-dimensional strain – a novel software for real-time quantitative echocardiographic assessment of myocardial function. J Am Soc Echocardiogr. 2004;17:1021–1029. doi: 10.1016/j.echo.2004.06.019. [DOI] [PubMed] [Google Scholar]
- 7.Mor-Avi V, Lang RM, Badano LP, Belohlavek M, Cardim NM, Derumeaux G, et al. Current and evolving echocardiographic techniques for the quantitative evaluation of cardiac mechanics: ASE/EAE consensus statement on methodology and indications endorsed by the Japanese Society of Echocardiography. J Am Soc Echocardiogr. 2011;24:277–313. doi: 10.1016/j.echo.2011.01.015. [DOI] [PubMed] [Google Scholar]
- 8.Voigt JU, Pedrizzetti G, Lysyansky P, Marwick TH, Houle H, Baumann R, et al. Definitions for a common standard for 2D speckle tracking echocardiography: consensus document of the EACVI/ASE/Industry Task Force to standardize deformation imaging. J Am Soc Echocardiogr. 2015;28:183–193. doi: 10.1016/j.echo.2014.11.003. [DOI] [PubMed] [Google Scholar]
- 9.Amundsen BH, Helle-Valle T, Edvardsen T, Torp H, Crosby J, Lyseggen E. Noninvasive myocardial strain measurement by speckle tracking echocardiography: validation against sonomicrometry and tagged magnetic resonance imaging. J Am Coll Cardiol. 2006;47:789–793. doi: 10.1016/j.jacc.2005.10.040. [DOI] [PubMed] [Google Scholar]
- 10.Korinek J, Wang J, Sengupta PP, Miyazaki C, Kjaergaard J, McMahon E, et al. Two-dimensional strain – a Doppler-independent ultrasound method for quantitation of regional deformation: validation in vitro and in vivo. J Am Soc Echocardiogr. 2005;18:1247–1253. doi: 10.1016/j.echo.2005.03.024. [DOI] [PubMed] [Google Scholar]
- 11.Ashikaga H, van der Spoel TI, Coppola BA, Omens JH. Transmural myocardial mechanics during isovolumic contraction. JACC Cardiovasc Imaging. 2009;2:202–211. doi: 10.1016/j.jcmg.2008.11.009. [DOI] [PMC free article] [PubMed] [Google Scholar]
- 12.Covell JW. Tissue structure and ventricular wall mechanics. Circulation. 2008;118:699–701. doi: 10.1161/CIRCULATIONAHA.108.797399. [DOI] [PubMed] [Google Scholar]
- 13.Smiseth OA, Remme EW. Regional left ventricular electric and mechanical activation and relaxation. J Am Coll Cardiol. 2006;47:173–174. doi: 10.1016/j.jacc.2005.10.039. [DOI] [PubMed] [Google Scholar]
- 14.Crosby J, Hergum T, Remme EW, Torp H. The effect of including myocardial anisotropy in simulated ultrasound images of the heart. IEEE Trans Ultrason Ferroelectr Freq Control. 2009;56:326–333. doi: 10.1109/TUFFC.2009.1041. [DOI] [PubMed] [Google Scholar]
- 15.Wickline SA, Verdonk ED, Miller JG. Three-dimensional characterization of human ventricular myofiber architecture by ultrasonic back-scatter. J Clin Invest. 1991;88:438–446. doi: 10.1172/JCI115323. [DOI] [PMC free article] [PubMed] [Google Scholar]
- 16.Remme EW, Lyseggen E, Helle-Valle T, Opdahl A, Pettersen E, Vartdal T, et al. Mechanisms of preejection and postejection velocity spikes in left ventricular myocardium: interaction between wall deformation and valve events. Circulation. 2008;118:373–380. doi: 10.1161/CIRCULATIONAHA.107.748491. [DOI] [PubMed] [Google Scholar]
- 17.Sengupta PP, Khandheria BK, Korinek J, Wang J, Jahangir A, Seward JB, et al. Apex-to-base dispersion in regional timing of left ventricular shortening and lengthening. J Am Coll Cardiol. 2006;47:163–172. doi: 10.1016/j.jacc.2005.08.073. [DOI] [PubMed] [Google Scholar]
- 18.Sengupta PP, Tajik AJ, Chandrasekaran K, Khandheria BK. Twist mechanics of the left ventricle: principles and application. JACC Cardiovasc Imaging. 2008;1:366–376. doi: 10.1016/j.jcmg.2008.02.006. [DOI] [PubMed] [Google Scholar]
- 19.Notomi Y, Lysyansky P, Setser RM, Shiota T, Popović ZB, Martin-Miklovic MG, et al. Measurement of ventricular torsion by two-dimensional ultrasound speckle tracking imaging. J Am Coll Cardiol. 2005;45:2034–2041. doi: 10.1016/j.jacc.2005.02.082. [DOI] [PubMed] [Google Scholar]
- 20.Pirat B, Khoury DS, Hartley CJ, Tiller L, Rao L, Schulz DG, et al. A novel feature-tracking echocardiographic method for the quantitation of regional myocardial function: validation in an animal model of ischemia-reperfusion. J Am Coll Cardiol. 2008;51:651–659. doi: 10.1016/j.jacc.2007.10.029. [DOI] [PMC free article] [PubMed] [Google Scholar]


