Abstract
The studies on the identification of the genetic basis for sexual dimorphism in peak bone mass are obviously important toward providing novel therapeutic approaches to prevent or treat metabolic bone diseases. Our goal in this study is to identify the bone microstructure that could lead to differences in volumetric (v) bone mineral density (BMD) and identify new candidate genes that regulate the gender effect on bone. Therefore, we used a congenic line of mice that carry the BMD1-4 locus from CAST/EiJ (CAST) mice in a C57BL/6J (B6) background and show greater vBMD in female but not male congenics compared to age and gender matched B6 mice. To assess the vBMD variations between the two lines of mice, we performed micro-CT measurements and found no difference in cortical bone volume by tissue volume (BV/TV) between congenics and B6 mice. However, trabecular BV/TV was significantly greater in female but not male congenics compared to corresponding B6 mice which was due to increased trabecular thickness but not reduced trabecular separation suggesting that a bone formation but not a bone resorption is responsible for the trabecular bone phenotype observed in the female but not male congenics. To identify the gender candidate genes, we have determined the polymorphisms between B6 and CAST within the BMD1-4 locus and performed gene expression profiling. We have identified ef-hand calcium binding domain (Efcab2), consortin, connexin sorting protein (Cnst) and presenilin 2 (Psen2) as potential candidate genes that regulate bone mass by influencing trabecular thickness in a gender specific manner.
Keywords: Bone mineral density, congenic mice, chromosome 1, gender candidate genes, trabecular bone thickness
Introduction
Osteoporosis is a condition associated with decreased bone strength and increased fracture risk. Bone fractures are an important public health problem costing more than 17 billion dollars each year [1]. It is estimated that 1 of 3 women and 1 of 6 men over the age of 50 years are expected to have bone fractures [2]. Thus, the prevalence of osteoporotic fractures is severalfold higher in women than in men. Therefore, an understanding of the mechanisms that contribute to increased fracture risk in women is important for establishing approaches to strengthening the bones in women in conditions when bone strength is compromised. The key factors that determine bone strength include BMD, material properties, microarchitecture and bone size [3-8]. Furthermore, several studies have identified considerable variations in peak BMD among individuals and found that women with low peak BMD are more susceptible to osteoporosis than women with high peak BMD [9]. It is also now well established that the variation in peak BMD in both humans and experimental animals is largely determined by genetic factors. The heritable component for peak BMD variation was estimated to range between 50-90% in humans and mice [10-13]. Therefore, genetic studies on the identification of the genes involved in regulating peak BMD have recently received considerable attention based on the rationale that elucidation of genes and genetic pathways involved in the regulation of peak BMD could lead to the identification of novel targets for both diagnosis and treatment of osteoporotic patients.
Skeletal development which is similar between males and females takes a gender specific course during puberty. Gender specific differences in various skeletal parameters have been identified in both humans and experimental animals [14-16]. Accordingly, recent studies in humans have revealed a gender difference in the degree of heritability of BMD at specific skeletal sites [17, 18]. Studies in humans [19, 20] and both recombinant inbred strains of mice [21, 22] and congenic strains of mice [23, 24] have revealed several quantitative trait loci (QTL) that exert gender specific effects on femoral structure and peak BMD. Although these and other data provide convincing experimental evidence for the gender specific effects of genetic loci on peak BMD, the identity of the gene/s that confer the gender specificity remains to be established. In this regard, we have used an intercross between high vBMD CAST and low vBMD B6 mice to identify a QTL, namely BMD1-4 QTL in Chromosome (Chr) 1, which regulates femur vBMD in the female mice but not in male mice [24]. The presence of a gene that confers a gender specific effect on femur vBMD has been confirmed using congenic mice in which the QTL region from CAST was transferred onto a B6 background [24]. Then, by superimposing the CAST chromosomal regions carried by three B6-CAST congenic lines of mice [24, 25], we have been able to narrow down the location of the BMD1-4 QTL which has enabled us to screen for candidate gene(s) that are responsible for the gender effect on bone mass and microarchitecture.
Materials and Methods
Animals
In this study we have used a subcongenic line of mice; C175-185 that have been generated previously [24] from congenic lines of mice derived from two inbred strains of mice; the low vBMD B6 and the high vBMD CAST mice. B6 and CAST mice have been previously shown to differ widely in total femur vBMD at 16 weeks of age [11]. These inbred strains of mice are highly polymorphic for genetic differences at more than 95% of their genomes [26], which made the fine mapping easy.
All animals were housed and maintained within the Veterinary Medical Unit of the Jerry L. Pettis Memorial VA Medical Center. All procedures were performed under humane conditions and were approved by the Institutional Animal Care and Use Committee at the Jerry L. Pettis Memorial VA Medical Center, Loma Linda, CA.
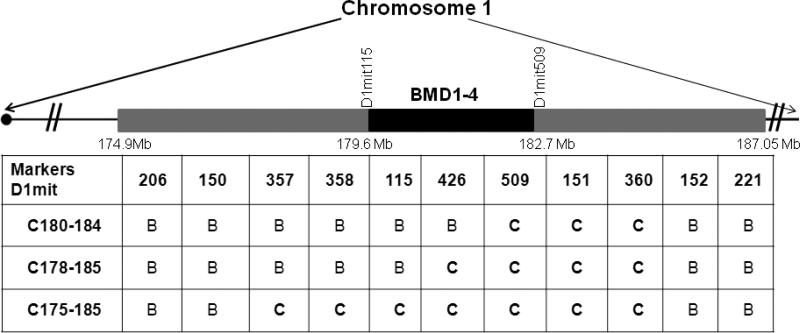
The comparison of the genotyping data between two subcongenic lines of mice and the C175-185 used in this study are displayed in Fig. 1.
Figure 1.
The regions of CAST Chr 1 transferred onto a B6 background for the three congenic sublines used to locate the BMD1-4 locus. The genotyping data for every marker are represented with “B” referring to homozygous b6/b6, “C” referring to cast/cast. We only presented some of the polymorphic markers used for genotyping. The names of the congenic sublines of mice are on the left. We used a letter “C” followed by the proximal and distal limits of CAST alleles carried by the congenic sublines in megabases (NCBI built 36). C180-184 did not show any difference in vBMD between congenic and B6 control mice [25]. C175-185 and C178-185 showed high vBMD in females but not males [24]. Subcongenic C180-184 and C178-185 lines of mice that have been previously generated [25, 24] are used here only to delimit the BMD1-4 QTL region, while C175-185 was used for all experiments in the study.
Micro-CT measurements
Cortical and trabecular bone microarchitectures of the femurs isolated from 16-week-old mice were assessed using micro-computed tomography (μ-CT) (VivaCt 40, μ-CT scanner, SCANCO, Switzerland). Femurs were scanned by X-ray and the scanned image was then contoured to either include or exclude cortical bone. For trabecular bone parameters, slices chosen for analysis were based on the location of the growth plate and adjusted based on bone length so the regions of interest chosen for trabecular and cortical bone parameters were anatomically the same between the congenics and the wild type B6 control mice. An axial length of 180 - 190 slices (10.5 μm/slice) was analyzed at 0.336 – 0.399 mm proximal to the growth plate for distal femur trabecular bone using the threshold setting of 200-1,000 mg/cm3. 100 slices at the femur mid-diaphyseal region were analyzed for cortical bone using the threshold setting of 260-1,000 mg/cm3. After image post-processing, the bone volume-to-total volume ratio (BV/TV), trabecular thickness (Tb. Th), trabecular separation (Tb. S), and trabecular number (Tb. N) were calculated in the morphologic analysis.
Sixteen week old female and male mice were used in this study. Broken bones or bone that lost their growth plates were removed from the analyses. Thus, the number of animals that were used in micro-CT measurements; for female B6, n= 13, female congenics, n = 11; male B6, n = 10, male congenics, n = 8.
Gene expression
The quantification of mRNAs was performed by real time RT-PCR using 500 ng total RNA derived from bone with bone marrow. RNA was extracted from femurs isolated from 14-week old female congenics and age and gender-matched B6 control mice. Trizol (Invitrogen by Life Technologies, Carlsbad, CA, USA) was used for RNA extraction following the manufacturer's protocol. The relative differences in expression between the groups have been determined by RT-PCR using cycle time (Ct) values as follows: The Ct value of each gene of interest was normalized by the Ct values of two control genes of same sample; 18S and peptidylprolyl isomerase A (PPIA). Then, the relative differences between groups were calculated and expressed as relative increases or decreases (fold change). Only the genes that showed the same difference trends between B6 and congenic mice after normalization by 18S and PPIA control genes were considered as candidate genes. The primers used in this study are listed in table 1.
Table 1.
Primer sequence used in mRNA expression analyzes
| Gene Symbol | Forward | Reverse |
|---|---|---|
| Gm9982 | GTTCCATCCCAGCACTGTTT | ATGGTGGTCCTCTTCTGGTG |
| Fam36a | TTTAGGATGCTGGTTCCACTG | GCTGCTGTTGTTGGTCTTCA |
| Hnrnpu | AGAGCTTCCTACGGTGTGTCAAA | AGATTCCAGTAAGACACTTAT |
| Efcab2 | AACCCACTGGCTACATTCGAT | GGATCCAAAACCTCGAAAGC |
| Kif26 | TGACGGTGAGGACCAGGAA | CCACCAGTGTGAAGACCAACTC |
| Smyd3 | ACTTGCAATGACTTTTCAACATTTCA | AGAAGGCGGCAGCTGAGA |
| Tfb2m | TTTGGAGCCCTTACAGAGGA | ACACCTGCTGACCAAGGAAC |
| Cnst | AGGGCTGGTGTCCATACTGAA | TCTTGCTCCAGGTTGTCGTCTAT |
| Sccpdh | ATGCTGCTTATGTGACGGTG | GCTGCTCCAGGTGTAAAGACA |
| Ahctf1 | TGGATGGAATCGTGCCTATTG | TTCAGAGGTAACCGGGCACTT |
| Cdc42bpa | CAGAGGAGGGAGATGCTACG | TGGAGGGAATACTGACGGAG |
| Cabc1 | GACTTCGGCGCAACTAGAGAA | TTGACCTCATAACCGGTAAGGAA |
| Psen2 | TCGGCCTGGGAGACTTCAT | AGGGTGAGACACAAGCCAATG |
| Itpkb | ACTGGAGCGCTTTGGAACTA | AGCTCACAGCCTGTCTCCAT |
| Lin9 | TGAGCCTCATGAGACAATGC | GTGACTGCCCCAGTAAAGGA |
| Mixl1 | CCTGGGACTGAAGCTAGGTG | CCAGGAGTCCAACTTTGAGC |
Statistical analyses
We compared different skeletal parameters between male and females of the same line of mice and between B6 and the congenic C175-185 mice in both genders using GraphPad Prism 5 and IBM SPSS statistic 19 software. We computed the difference between congenic and B6 in both male and female mice using a Generalized Linear Model, with identity and log Link, and Gaussian, Gamma, and inverse Gaussian distribution to account for both skewness in the data and the difference in variance between the groups. For each outcome variable, the model with the best fit based on the finite sample corrected Akaiki Information Criteria (AIC), or AICc, was selected in order to make the computations for that outcome variable. The AICc was used to take into account the small sample size of this study and the number of free parameters to estimate. We used the best model to measure the effect of gene type on the dependent outcome variable for all males and all females and to determine the gene and gender differences. P<0.05 indicated statistical significance.
Results
Micro-CT data
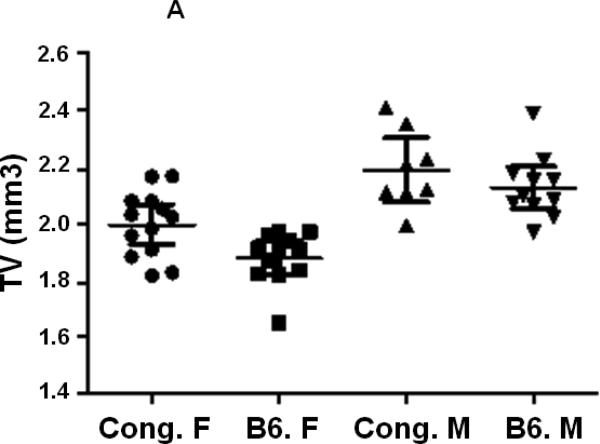
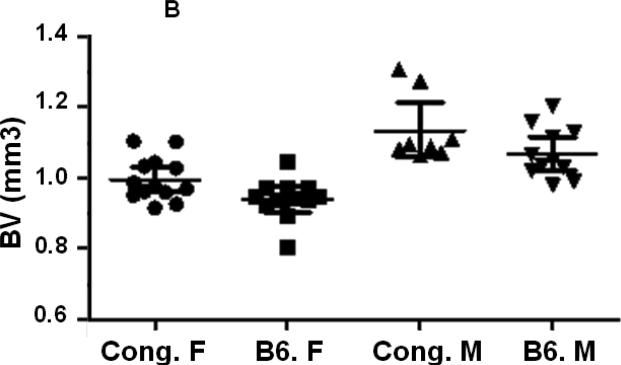
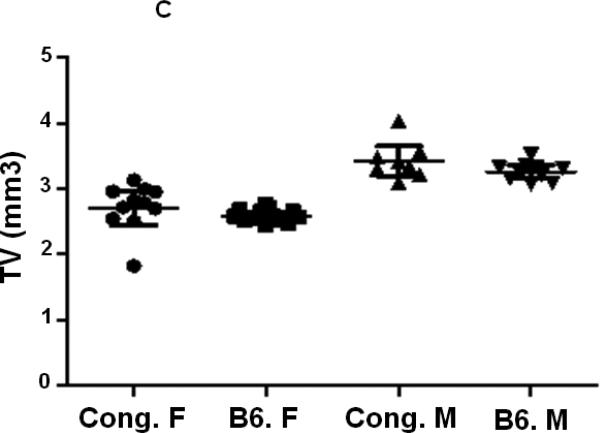
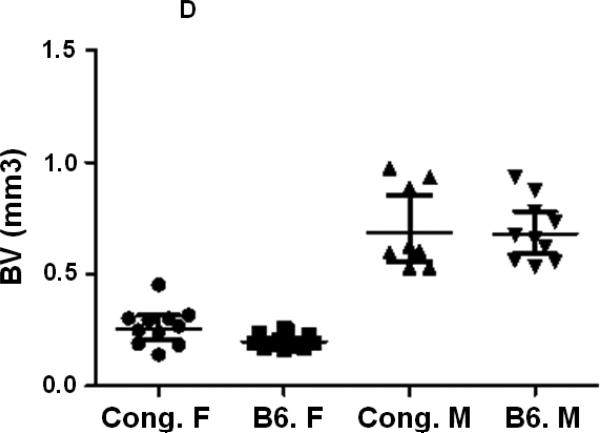
In our previous studies, using peripheral quantitative computed tomography (pQCT), we found that female congenic C175-185 mice that carry the BMD1-4 locus from CAST mice show a greater total femur vBMD compared to age and gender matched B6 control mice while male congenics did not show a difference in vBMD compared to corresponding B6 control mice [24]. In this study, we have used the congenic C175-185 mice and the B6 control mice to investigate the sexual dimorphism in femur bone parameters. We first compared bone parameters between males and females of same line of mice using micro-CT measurements at femur mid-diaphysis and at the distal femur metaphysis. Since total femur vBMD variations have been identified in 16-week old mice [24], the micro-CT measurements were also performed at 16 weeks of age. As expected, total volume (TV) as well as bone volume (BV) at both the mid-diaphysis and the distal femur metaphysis were significantly reduced in females compared to male mice for both B6 and congenic mice (Figs. 2. A, B, C, D, Table 2). While a significant difference in TV and BV was found at both femur mid-diaphysis and metaphysis between female congenics and corresponding B6 control mice, no differences were found between the two lines of male mice (Figs. 2. A, B, C, D, Table 2).
Figure 2.
Cortical and trabecular bone volume and tissue volume from both male and female congenic and B6 control mice. A. Tissue volume at the femur mid-diaphysis and B. Cortical bone volume for individual Congenic and B6 control mice. C. Tissue volume at the femur metaphysis region and D. Trabecular bone volume for individual congenic and B6 control mice. Data are presented as the values of individual animals ± 95% Confidence interval. n = 8-13.
Table. 2.
Estimate significance between genders and between B6 and congenic mice
| Mid. TV | Cr. BV | Cr. BV/TV | Tb. TV | Tb. BV | Tb. BV/TV | Tb.Th | Tb. N | Tb. S | |
|---|---|---|---|---|---|---|---|---|---|
| B6.F vs B6.M | <0.001 | <0.001 | 0.19 | <0.001 | <0.001 | <0.001 | <0.001 | <0.001 | <0.001 |
| Cong.F vs Cong. M | 0.039 | 0.003 | 0.10 | <0.001 | <0.001 | <0.001 | 0.7 | <0.001 | <0.001 |
| B6.F vs Cong. F | 0.018 | 0.04 | 0.61 | 0.214 | 0.005 | 0.003 | <0.001 | 0.957 | 0.792 |
| B6. M vs Cong. M | 0.6 | 0.13 | 0.65 | 0.109 | 0.526 | 0.83 | 0.982 | 0.703 | 0.636 |
Mid. TV, for tissue volume at the femur mid-diaphysis; Cr. BV, for cortical bone volume; Cr. BV/TV, for cortical BV/TV; Tb. TV, for trabecular TV. Identity/Gaussian model was the best model for TV and Tb. S. Log inverse Gaussian model was the best model for Tb. BV, Tb. BV/TV, Tb. Th, Tb. N. The best model for each parameter was used to determine the significance in the difference between genders and between the two lines of mice.
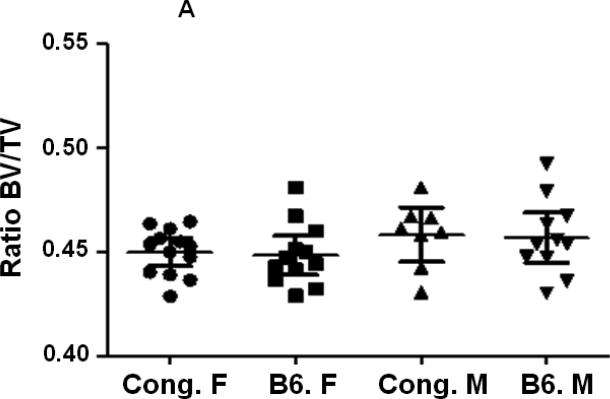
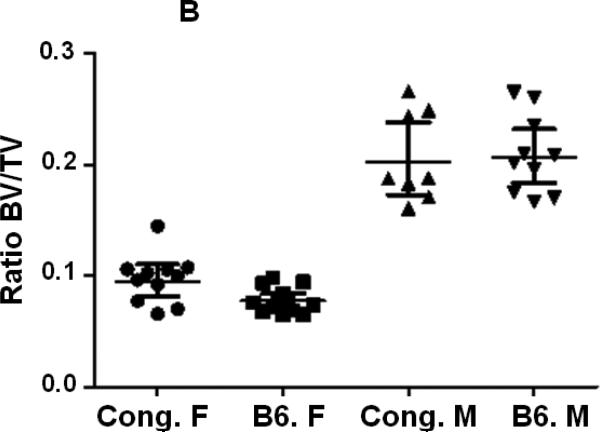
BV/TV was similar in both male and female mice of both strains of mice at the femur middiaphysis (Fig. 3A, Table 2). However, at the metaphysis, the ratio Tb. BV/TV was significantly reduced in B6 female mice compared to corresponding male mice (Fig. 3B, Table 2). Comparison of trabecular bone parameters between congenics and B6 control mice revealed a significant increase in Tb. BV/TV at the distal femur metaphysis in female congenics (Fig. 3B, P=0.003) compared to age and gender-matched B6 control mice. Within male mice, no significant difference in Tb. BV/TV was observed between congenic mice and corresponding B6 mice (Fig. 3B, Table. 2).
Figure 3.
Cortical and trabecular bone volume on tissue volume of congenic and B6 control mice from both genders. A. Cortical BV/TV of congenic and B6 control mice. B. Trabecular BV/TV of congenic and B6 control mice. Data are presented as the values of individual animals ± 95% Confidence interval. n = 8-13.
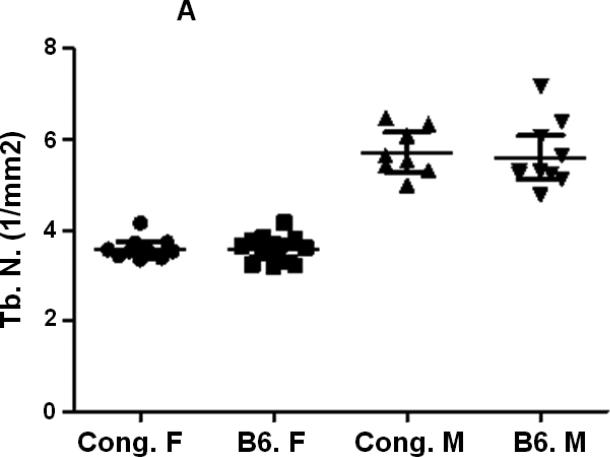
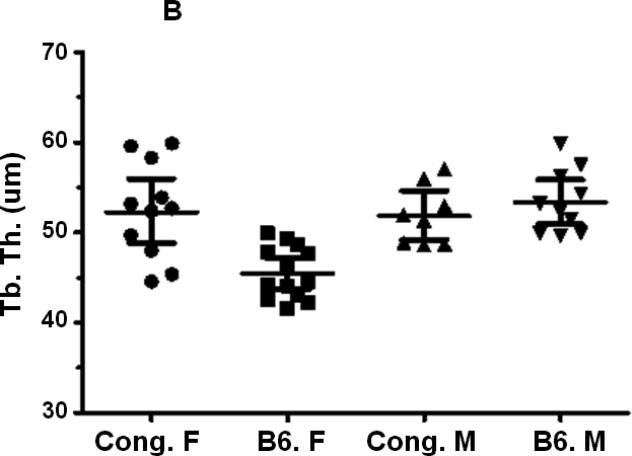
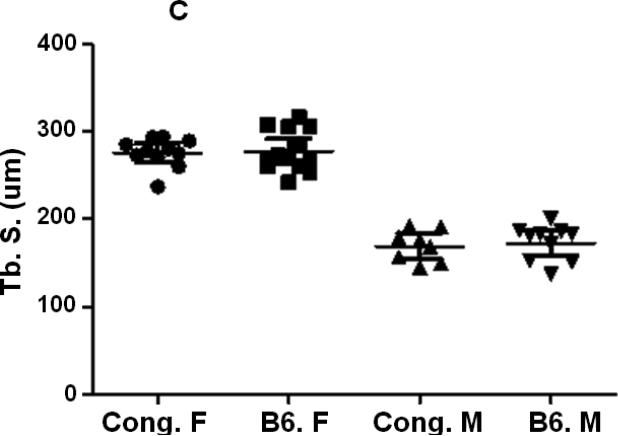
A reduction in Tb. N (Fig. 4A, Table 2) and a significant increase in Tb. S (Fig. 4C, Table 2) were observed in female mice compared to corresponding male mice for both B6 and congenic mice. However, no difference in Tb. N or Tb. S. was observed between congenic mice and B6 control mice in both genders (Figs. 4A, C, Table 2). Tb. Th was significantly reduced (Fig. 4B, Table 2) in femurs derived from female B6 mice compared to male mice but not between males and females within the congenic line of mice (Fig. 4B, table 2). While congenic female mice showed significantly greater Tb. Th compared to corresponding B6 control mice, no difference was observed between of within the two lines of mice (Fig. 4B, Table. 2).
Figure 4.
Femur trabecular bone parameters of the congenic and B6 control mice. A. Tb. N. of congenic and B6 mice from both male and female mice. B. Tb. Th. of congenic and B6 mice from both male and female mice. C. Tb. S. of congenic and B6 mice from both male and female mice. Data are presented as the values of individual animals ± 95% Confidence interval. n = 8-13.
Screen for the gender candidate genes
By superimposing the CAST chromosomal regions carried by three B6-CAST congenic lines of mice [24, 25], we have been able to narrow down the location of the BMD1-4 QTL to a small region of ~ 3.1 Mb in the region D1mit115 - D1mit509 (Fig.1). In order to identify the candidate gene(s) that might be responsible for the gender difference in BV and Tb. Th. between congenics and the B6 control mice, we first used the mouse genome database from National Center Biotechnology Information (NCBI) to identify the genes that underlie the BMD1-4 locus region. Our search revealed evidence for the presence of 34 genes/ESTs in this region (Table 3). We next searched the Phenome Database to identify the sequence variations between B6 and Cast within the BMD1-4 locus. We chose in this dataset since it includes SNP information from not only Sanger1 but also from other sources including Perlegen2, Broad2 and 1, Merck etc. This search led to the identification of 16 genes and predicted genes that showed non synonymous (n) SNPs between the two strains of mice (Table 4). We next compared mRNA expression between B6 and congenic female mice of the genes that show nSNPs between B6 and CAST mice (Table 5). Among the 16 genes, only 3 genes showed differential expression between female congenic and corresponding B6 mice. Ef-hand calcium binding domain (Efcab2) and presenilin 2 (Psen2) genes were down regulated in femurs derived from female congenics (0.45 and 0.2-fold, respectively) compared to age and gender matched B6 mice (Table 5), while consortin, connexin sorting (Cnst) gene expression was greater (1.6-fold, P <0.05) in femurs derived from female congenic mice compared to age and gender matched B6 mice (Table 5).
Table.3.
List of the genes that underlie BMD1-4 QTL
| Gene Description | Symbol |
|---|---|
| RIKEN cDNA 1700016C15 gene | 1700016C15Rik |
| Adenylosuccinate synthetase, non muscle | Adss |
| Ribosomal protein S8 | Rps8 |
| Predicted gene 7068 | Gm7068 |
| Predicted gene 16432 | Gm16432 |
| Translin-associated factor X | Tsnax |
| PPPDE peptidase domain containing 1 | Pppde1 |
| H3 histone, family 3B | H3f3b |
| RIKEN cDNA 4930527J03 gene | 4930527J03Rik |
| Heterogeneous nuclear ribonucleoprotein U | Hnrnpu |
| Family with sequence similarity 36, member A | Fam36a |
| Predicted gene 6485 | Gm6485 |
| Predicted gene 7536 | Gm7536 |
| EF-hand calcium binding domain 2 | Efcab2 |
| Kinesin family member 26B | Kif26b |
| SET and MYND domain containing 3 | Smyd3 |
| Predicted gene 8759 | Gm8759 |
| Ribosomal protein L29 | Rpl29 |
| Transcription factor B2, mitochondrial | Tfb2m |
| Consortin, connexin sorting protein | Cnst |
| Saccharopine dehydrogenase (putative) | Sccpdh |
| Predicted gene 1305 | Gm1305 |
| AT hook containing transcription factor 1 | Ahctf1 |
| Ribosomal protein L21 | Rpl21 |
| CDC42 binding protein kinase alpha | Cdc42bpa |
| AarF domain containing kinase 3 | Cabc1 |
| Presenilin 2 | Psen2 |
| Inositol 1,4,5-trisphosphate 3-kinase B | Itpkb |
| RIKEN cDNA 6330403A02 gene | 6330403A02Rik |
| Poly (ADP-ribose) polymerase family, member 1 | Parp1 |
| Lin-9 homolog (C. elegans) | Lin9 |
| Mix1 homeobox-like 1 (Xenopus laevis) | Mixl1 |
| Acyl-Coenzyme A binding domain containing 3 | Acbd3 |
| H3 histone, family 3A | H3f3a |
The region displayed is located at 179,610K-182,730K bp (Build 37.2).
Table 4.
Non synonymous SNPs found between B6 and CAST mice in the region D1mit115 - D1mit509.
| Location in Chr. 1 | Ensembl 64 | dbSNP 132 | C57BL/6J | CAST/EiJ | rs. number |
|---|---|---|---|---|---|
| Build 37 (bp) | Gene symbol | Gene symbol | |||
| Amino acid change | Amino acid change | ||||
| 180186650 | Gm9982: Cn EK | G | A | rs3022875 | |
| 180186783 | Gm9982: Cn SI | G | T | - | |
| 180252737 | Fam36a: Cn NS | A | G | - | |
| 180267366 | Hnrnpu: Cn GS | C | T | - | |
| 180336247 | Efcab2: Cn RK | G | G | - | |
| 180367541 | Efcab2: Cn IV | A | A | - | |
| 180405089 | Efcab2: Cn RK | G | G | - | |
| 180411494 | Efcab2: Cn DN | G | G | - | |
| 180685982 | Kif26b: I | Ccdc121: Cn RQ | A | G | rs37434451 |
| 180686017 | Kif26b: I | Ccdc121: Cn EQ | C | A | rs38100658 |
| 180847317 | Kif26b: Cn GS | Kif26b: Cn GS | G | A | rs36996694 |
| 180847897 | Kif26b: Cn AV | Kif26b: Cn AV | C | T | rs36357639 |
| 180973992 | Smyd3: Cn ND | T | C | rs13459055 | |
| 181084048 | Smyd3: I |
Smyd3: I Rpl31: Cn KI |
T | A | rs37486662 |
| 181341881 | Smyd3: Cn SR | A | C | rs13465358 | |
| 181448046 | Smyd3: Cn ND | T | C | - | |
| 181476217 | Tfb2m: Cn AT | C | T | - | |
| 181476227 | Tfb2m: Cn IM |
Tfb2m: Cn IM LOC100040874: Cn IM 9630058J23Rik: Cn IM |
G | C | rs32633261 |
| 181476229 | Tfb2m: Cn IL | T | G | - | |
| 181509875 | Cnst: Cn SG | A | G | rs32593810 | |
| 181539934 | Cnst: Cn SG | A | G | - | |
| 181540005 | Cnst: Cn ED | G | C | - | |
| 181540132 | Cnst: Cn GW | G | T | rs32641224 | |
| 181540270 | Cnst: Cn GS | G | H | - | |
| 181540271 | Cnst: Cn GD | G | A | - | |
| 181613323 | Sccpdh: I,Cn,SS | A | G | - | |
| 181682607 | Ahctf1: Cn AT | C | T | - | |
| 181682696 | Ahctf1: Cn RK | Ahctf1: Cn RK | C | T | rs13471303 |
| 181683077 | Ahctf1: Cn LS | A | G | - | |
| 181683195 | Ahctf1: Cn PT | G | T | - | |
| 181683587 | Ahctf1: Cn NS | Ahctf1: Cn NS | T | C | rs30904605 |
| 181683594 | Ahctf1: Cn SR | Ahctf1: Cn SR | T | G | rs31659605 |
| 181683614 | Ahctf1: Cn HR | Ahctf1: Cn HR | T | C | rs32302393 |
| 181683675 | Ahctf1: Cn SP | Ahctf1: Cn SP | A | G | rs32575544 |
| 181683897 | Ahctf1: Cn,U3 CS | Ahctf1: Cn CS | A | T | rs32655867 |
| 181683904 | Ahctf1: Cn,U3 KN | T | G | - | |
| 181683930 | Ahctf1: Cn,U3 MV | Ahctf1: Cn MV | T | C | rs32655872 |
| 181688086 | Ahctf1: Cn LP | Ahctf1: Cn LP | A | G | rs32653441 |
| 181693726 | Ahctf1: Cn FL | Ahctf1: Cn FL | A | G | rs32653803 |
| 182060954 | Cdc42bpa: I,Cn RW | Cdc42bpa: I | C | T | rs32676166 |
| 182097310 | Adck3: Cn GA | Cabc1: Cn GA | C | G | rs32681538 |
| 182109097 | Adck3: Cn,I SP | A | G | - | |
| 182109117 | Adck3: Cn,I SF | Cabc1: Cn SF | G | A | rs32686560 |
| 182171042 | Psen2: Cn DG | T | C | - | |
| 182175753 | Psen2: Cn AS | C | A | - | |
| 182263472 | Itpkb: Cn KR | A | G | - | |
| 182263660 | Itpkb: Cn PS | C | T | - | |
| 182598925 | Lin9: Cn SA | Lin9: Cn SA | T | G | rs30908592 |
| 182611383 | Lin9: Cn,I WC | G | C | - | |
| 182611454 | Lin9: Cn,I AV | C | H | - | |
| 182611490 | Lin9: Cn,I RH | G | A | - | |
| 182611495 | Lin9: Cn,I FL | T | C | - | |
| 182611613 | Lin9: Cn,I KR | Lin9: Cn KR | A | G | rs47571581 |
| 182624875 | Mixl1: Cn TA | Mixl1: Cn TA | T | C | rs6273045 |
Ensembl 64 for Ensembl release 64 and dbSNPs 132 for SNPs data build 132 (dbsnp_mouse_132). “H” in nucleotide column means heterozygous. Cn for coding region and non synonymous SNP. “-” for data not available.
Table 5.
Gene expression profile of the gender candidate genes in femurs isolated from 14-week old female mice.
| Gene ID | Fold change Female congenic vs Female B6 mice |
|---|---|
| Gm9982 | 0.6 ± 0.4 |
| Fam36a | 0.8 ± 0.3 |
| Hnrnpu | 0.95 ± 0.1 |
| Efacb2 | 0.45* ± 0.1 |
| Kif26 | 0.9 ± 0.2 |
| Smyd3 | 1.0 ± 0.4 |
| Tfb2m | 0.9 ± 0.3 |
| Cnst | 1.6* ± 0.1 |
| Sccpdh | 0.7 ± 0.3 |
| Ahctf1 | 0.93 ± 0.2 |
| Cdc42bp | 1.1 ± 0.2 |
| Cabc1 | 0.7 ± 0.3 |
| Psen2 | 0.2* ± 0.05 |
| Itpkb | 0.7 ± 0.3 |
| Lin9 | 0.85 ± 0.4 |
| Mixl1 | 0.6 ± 0.4 |
Data are presented as fold change between female congenic and gender and age-matched B6 mice and are mean ± SD.
P<0.05 vs. corresponding B6 mice. n = 6-7.
Discussion
Studies in humans have revealed a higher heritability of BMD in mother-daughter and father-son pairs than across sexes [17, 27, 28]. However, only a few studies in humans have recently identified gender specific BMD QTLs [19, 20]. In contrast, several studies using recombinant inbred strains of mice [21] and congenic mice [22, 24] have revealed QTLs that exert gender effects on femoral structure and peak BMD. In our previous studies, using molecular genetic approaches, we narrowed the size of a gender specific QTL in Chr 1 to a region small enough that allowed us to proceed with the gene identification process. Because this region is syntenic to human Chr 1 which contains a BMD QTL [29], there is a high likelihood that the gene identified in mice may also be relevant to humans. In this report, we have used a congenic that carries a CAST chromosomal region that covers the BMD1-4 locus [24] to identify the candidate genes responsible for the gender effect on trabecular bone volume and thickness between female congenics and gender matched B6 control mice.
Previous bone studies have demonstrated that ovariectomy reduced trabecular BMD but estrogen substitution of ovariectomized (ovx) mice restored this effect [30-32]. Furthermore, using high resolution 3-T MRI in healthy people, Alberich-Bayarri et al. [33] demonstrated that Tb. BV/TV and Tb. Th are influenced by gender in humans. In the present study, as expected, B6 mice showed a gender effect on all trabecular bone parameters. However, in congenic mice, the gender effect on Tb. BV/TV and Tb. Th. was significantly reduced compared to B6 mice which suggests that the CAST gene(s) carried by congenic mice alters the effect of gender on trabecular bone architecture resulting in a greater trabecular bone volume phenotype in female congenic mice compared to gender matched B6 control mice.
In order to identify the candidate genes that mediate gender effects on Tb. BV and Tb. Th, we prioritized the genes that show nSNPs between CAST and B6 mice because SNPs that change amino acid sequence could affect both the function as well as the expression of the gene/protein. We identified 16 genes that show nSNPs between B6 and CAST mice. Then, we compared the expression of the 16 candidate genes between B6 and congenic female mice. The following three genes showed differential expression between the two lines of mice. Efcab2, a potential candidate gene, represents the largest family within the superfamily of proteins that carry the Ca-binding EF-hand motif and was shown to be a mechanoresponsive gene in human osteoblast cells [34]. In the present study, Efcab2 was found to be down-regulated in female congenic mice (Table 5). The difference in the expression could be due to the nSNPs that were found in the Efcab2 functional domain and could affect the conformation and the chemical properties of the protein and consequently its function as well as the expression of the gene. If the observed genetic variation in Efcab2 is the cause for the gender difference in Tb. BV and microarchitecture in the congenic mice that means that Efcab2 participates in mediating the sex hormone effect which needs to be investigated in future studies. Psen2, a potential candidate gene is expressed in osteoblast cells and has been found to be up-regulated during late stage osteoblast differentiation [35]. Engin et al., [36] showed that mice lacking both presenilin-1 (Psen1) and Psen2 exhibited impaired Notch signaling in osteoblasts and late-onset, age-related osteoporosis. Psen1−/− and Psen2−/− mice showed an increase in osteoblast-dependent osteoclastic activity in part due to decreased osteoprotegerin mRNA expression in osteoblast cells and a reduction in Tb.N. compared to wild type control mice [36]. However congenic C175-185 mice with reduced Psen2 expression compared to gender matched B6 control mice exhibited greater Tb. Th. but no difference in Tb. N. The issue of whether the difference in skeletal phenotype of congenic mice compared Psen1−/− and Psen2−/− mice is to due to a compensatory increase in Psen1 expression remains to be examined.
Cnst is an integral membrane protein that acts as a binding partner of connexins, the building blocks of gap junctions, and acts as a trans-golgi network receptor involved in connexin targeting to the plasma membrane and recycling from the cell surface. Cnst gene is expressed in preosteoblast cells [37]. It was to be down regulated in mutants lacking estrogen-related receptor alpha (Erralpha) [38], thus suggesting that the Cnst gene is involved in the Erralpha pathway. The nSNPs in the Cnst gene that have been found between B6 and CAST could affect the conformation of the protein and cause the difference in the expression found between B6 and congenic mice. Thus, analyzing the role of Cnst on bone volume and microarchitecture variations could provide more insight on how Erralpha regulates bone strength.
A potential limitation of this study is that in our first screen for gender candidate genes, we only considered genes that show nSNPs between B6 and CAST mice. However, since SNPs at the intervening sequence may also affect the gene expression and consequently affect protein function, it is still necessary to investigate the SNPs at the promoters and intervening sequences as well as the expression of the remaining BMD1-4 genes that are highly expressed in bone to determine if the BMD1-4 locus carries additional candidate genes that contribute to trabecular variations between female congenics and female B6 control mice. Analyzing the interactions between all of the candidate genes is critical in understanding the mechanisms that contribute to gender effects on bone mass.
Conclusions
Our first screen for gender specificity candidate genes within the BMD1-4 locus led to the identification of three candidate genes, Efcab2, Cnst and Psen2, that exhibit differential expression between female congenic mice and corresponding B6 mice and nSNPs that distinguish B6 from CAST mice. These data suggest that one or more genes and their interaction could be responsible for the increase in Tb. BV/TV and Tb. Th observed in congenic female mice compared to gender matched B6 mice. Further studies are needed to determine the mechanism by which the candidate gene(s) affect trabecular thickness.
Acknowledgements
The authors thank Jomana Bashir who did the micro-CT measurements and Dr. Michael Kashner for his assistance in the statistical analyses.
The project described was supported by Grant Number 1R03AR056106-01A1 from NATIONAL INSTITUTE OF ARTHRITIS AND MUSCULOSKELETAL AND SKIN DISEASES under American Reinvestment and Recovery Act of 2009. Its contents are solely the responsibility of the authors and do not necessarily represent the official views of the NIAMS or NIH. All work was performed using facilities provided by the Veterans Administration.
Footnotes
Disclosure
No conflicts of interest are declared by the authors.
References
- 1.Burge R, Dawson-Hughes B, Solomon DH, Wong JB, King A, Tosteson A. Incidence and economic burden of osteoporosis-related fractures in the United States, 2005-2025. J Bone Miner Res. 2007;22(3):465–475. doi: 10.1359/jbmr.061113. [DOI] [PubMed] [Google Scholar]
- 2.Huddleston JM, Whitford KJ. Medical care of elderly patients with hip fractures. Mayo Clin Proc. 2001;76(3):295–298. doi: 10.4065/76.3.295. [DOI] [PubMed] [Google Scholar]
- 3.Ferretti JL, Capozza RF, Mondelo N, Zanchetta JR. Interrelationships between densitometric, geometric, and mechanical properties of rat femora: inferences concerning mechanical regulation of bone modeling. J Bone Miner Res. 1993;8(11):1389–1396. doi: 10.1002/jbmr.5650081113. [DOI] [PubMed] [Google Scholar]
- 4.Gilsanz V, Loro ML, Roe TF, Sayre J, Gilsanz R, Schulz EE. Vertebral size in elderly women with osteoporosis. Mechanical implications and relationship to fractures. J Clin Invest. 1995;95(5):2332–2337. doi: 10.1172/JCI117925. [DOI] [PMC free article] [PubMed] [Google Scholar]
- 5.Vega E, Ghiringhelli G, Mautalen C, Rey Valzacchi G, Scaglia H, Zylberstein C. Bone mineral density and bone size in men with primary osteoporosis and vertebral fractures. Calcif Tissue Int. 1998;62(5):465–469. doi: 10.1007/s002239900462. [DOI] [PubMed] [Google Scholar]
- 6.Dalle Carbonare L, Giannini S. Bone microarchitecture as an important determinant of bone strength. J Endocrinol Invest. 2004;27(1):99–105. doi: 10.1007/BF03350919. [DOI] [PubMed] [Google Scholar]
- 7.Earnshaw SA, Cawte SA, Worley A, Hosking DJ. Colles' fracture of the wrist as an indicator of underlying osteoporosis in postmenopausal women: a prospective study of bone mineral density and bone turnover rate. Osteoporos Int. 1998;8(1):53–60. doi: 10.1007/s001980050048. [DOI] [PubMed] [Google Scholar]
- 8.Kanterewicz E, Yanez A, Perez-Pons A, Codony I, Del Rio L, Diez-Perez A. Association between Colles' fracture and low bone mass: age-based differences in postmenopausal women. Osteoporos Int. 2002;13(10):824–828. doi: 10.1007/s001980200114. [DOI] [PubMed] [Google Scholar]
- 9.Riggs BL, Melton LJ. Involutional osteoporosis. N Engl J Med. 1986;314(26):1676–1686. doi: 10.1056/NEJM198606263142605. [DOI] [PubMed] [Google Scholar]
- 10.Beamer WG, Shultz KL, Donahue LR, Churchill GA, Sen S, Wergedal JR, Baylink DJ, Rosen CJ. Quantitative trait loci for femoral and lumbar vertebral bone mineral density in C57BL/6J and C3H/HeJ inbred strains of mice. J Bone Miner Res. 2001;16:1195–1206. doi: 10.1359/jbmr.2001.16.7.1195. [DOI] [PubMed] [Google Scholar]
- 11.Beamer WG, Shultz KL, Churchill GA, Frankel WN, Baylink DJ, Rosen CJ, Donahue LR. Quantitative trait loci for bone density in C57BL/6J and CAST/EiJ inbred mice. Mamm Genome. 1999;10:1043–1049. doi: 10.1007/s003359901159. [DOI] [PubMed] [Google Scholar]
- 12.Eisman JA. Genetics of osteoporosis. Endocr Rev. 1999;20(6):788–804. doi: 10.1210/edrv.20.6.0384. Review. [DOI] [PubMed] [Google Scholar]
- 13.Krall EA, Dawson-Hughes B. Heritable and life-style determinants of bone mineral density. J Bone Miner Res. 1993;8(1):1–9. doi: 10.1002/jbmr.5650080102. [DOI] [PubMed] [Google Scholar]
- 14.Lu PW, Cowell CT, LLoyd-Jones SA, Briody JN, Howman-Giles R. Volumetric bone mineral density in normal subjects, aged 5-27 years. J Clin Endocrinol Metab. 1996;81(4):1586–1590. doi: 10.1210/jcem.81.4.8636372. [DOI] [PubMed] [Google Scholar]
- 15.Ruff CB, Hayes WC. Sex differences in age-related remodeling of the femur and tibia. J Orthop Res. 1988;6(6):886–896. doi: 10.1002/jor.1100060613. [DOI] [PubMed] [Google Scholar]
- 16.Sode M, Burghardt AJ, Kazakia GJ, Link TM, Majumdar S. Regional variations of gender-specific and age-related differences in trabecular bone structure of the distal radius and tibia. Bone. 2010;46(6):1652–60. doi: 10.1016/j.bone.2010.02.021. [DOI] [PMC free article] [PubMed] [Google Scholar]
- 17.Duncan EL, Cardon LR, Sinsheimer JS, Wass JA, Brown MA. Site and gender specificity of inheritance of bone mineral density. J Bone Miner Res. 2003;18(8):1531–1538. doi: 10.1359/jbmr.2003.18.8.1531. [DOI] [PubMed] [Google Scholar]
- 18.Ng MY, Sham PC, Paterson AD, Chan V, Kung AW. Effect of environmental factors and gender on the heritability of bone mineral density and bone size. Ann Hum Genet. 2006;70(Pt 4):428–438. doi: 10.1111/j.1469-1809.2005.00242.x. [DOI] [PubMed] [Google Scholar]
- 19.Ioannidis JP, Ng MY, Sham PC, Zintzaras E, Lewis CM, Deng HW, Econs MJ, Karasik D, Devoto M, Kammerer CM, Spector T, Andrew T, Cupples LA, Duncan EL, Foroud T, Kiel DP, Koller D, Langdahl B, Mitchell BD, Peacock M, Recker R, Shen H, Sol-Church K, Spotila LD, Uitterlinden AG, Wilson SG, Kung AW, Ralston SH. Meta-analysis of genome-wide scans provides evidence for sex- and site-specific regulation of bone mass. J Bone Miner Res. 2007;22(2):173–183. doi: 10.1359/jbmr.060806. [DOI] [PMC free article] [PubMed] [Google Scholar]
- 20.Peacock M, Koller DL, Fishburn T, Krishnan S, Lai D, Hui S, Johnston CC, Foroud T, Econs MJ. Sex-specific and non-sex-specific quantitative trait loci contribute to normal variation in bone mineral density in men. J Clin Endocrinol Metab. 2005;90(5):3060–3066. doi: 10.1210/jc.2004-2143. [DOI] [PubMed] [Google Scholar]
- 21.Orwoll ES, Belknap JK, Klein RF. Gender specificity in the genetic determinants of peak bone mass. J Bone Miner Res. 2001;16:1962–1971. doi: 10.1359/jbmr.2001.16.11.1962. [DOI] [PubMed] [Google Scholar]
- 22.Turner CH, Sun Q, Schriefer J, Pitner N, Price R, Bouxsein ML, Rosen CJ, Donahue LR, Shultz KL, Beamer WG. Congenic mice reveal sex-specific genetic regulation of femoral structure and strength. Calcif Tissue Int. 2003;73:297–303. doi: 10.1007/s00223-002-1062-1. [DOI] [PubMed] [Google Scholar]
- 23.Beamer WG, Shultz KL, Ackert-Bicknell CL, Horton LG, Delahunty KM, Coombs HF, Donahue LR, Canalis E, Rosen CJ. Genetic Dissection of Mouse Distal Chromosome 1 Reveals Three Linked BMD QTL With Sex Dependent Regulation of Bone Phenotypes. J Bone Miner Res. 2007;22(8):1187–96. doi: 10.1359/jbmr.070419. [DOI] [PubMed] [Google Scholar]
- 24.Edderkaoui B, Baylink DJ, Beamer WG, Shultz KL, Wergedal JE, Mohan S. Genetic regulation of femoral bone mineral density: Complexity of sex effect in chromosome 1 revealed by congenic sublines of mice. Bone. 2007;41(3):340–5. doi: 10.1016/j.bone.2007.05.013. [DOI] [PubMed] [Google Scholar]
- 25.Edderkaoui B, Baylink DJ, Beamer WG, Wergedal JE, Dunn NR, Shultz KL, Mohan S. Multiple genetic loci from CAST/EiJ chromosome 1 affect vBMD either positively or negatively in a C57BL/6J background. J Bone Miner Res. 2006;21(1):97–104. doi: 10.1359/JBMR.051008. 2006. [DOI] [PubMed] [Google Scholar]
- 26.Dietrich WF, Miller J, Steen R, Merchant MA, Damron-Boles D, Husain Z, Dredge R, Daly MJ, Ingalls KA, O'Connor TJ. A comprehensive genetic map of the mouse genome. Nature. 1996;380:149–52. doi: 10.1038/380149a0. [DOI] [PubMed] [Google Scholar]
- 27.Lutz J, Tesar R. Mother-daughter pairs: spinal and femoral bone densities and dietary intakes. Am J Clin Nutr. 1990;52(5):872–877. doi: 10.1093/ajcn/52.5.872. [DOI] [PubMed] [Google Scholar]
- 28.Van Pottelbergh I, Goemaere S, Zmierczak H, De Bacquer D, Kaufman JM. Deficient acquisition of bone during maturation underlies idiopathic osteoporosis in men: evidence from a three-generation family study. J Bone Miner Res. 2003;18(2):303–311. doi: 10.1359/jbmr.2003.18.2.303. [DOI] [PubMed] [Google Scholar]
- 29.Devoto M, Specchia C, Li HH, Caminis J, Tenenhouse A, Rodriguez H, Spotila LD. Variance component linkage analysis indicates a QTL for femoral neck bone mineral density on chromosome 1p36. Hum Mol Genet. 2001;10(21):2447–2452. doi: 10.1093/hmg/10.21.2447. [DOI] [PubMed] [Google Scholar]
- 30.Daci E, Verstuyf A, Moermans K, Bouillon R, Carmeliet G. Mice lacking the plasminogen activator inhibitor 1 are protected from trabecular bone loss induced by estrogen deficiency. J Bone Miner Res. 2000;15:1510–1516. doi: 10.1359/jbmr.2000.15.8.1510. [DOI] [PubMed] [Google Scholar]
- 31.Turner RT. Mice, estrogen, and postmenopausal osteoporosis. J Bone Miner Res. 1999;14:187–191. doi: 10.1359/jbmr.1999.14.2.187. [DOI] [PubMed] [Google Scholar]
- 32.Windahl SH, Vidal O, Andersson G, Gustafsson JA, Ohlsson C. Increased cortical bone mineral content but unchanged trabecular bone mineral density in female ERbeta(−/−) mice. J Clinic Invest. 1999;104:895–901. doi: 10.1172/JCI6730. [DOI] [PMC free article] [PubMed] [Google Scholar]
- 33.Alberich-Bayarri A, Marti-Bonmati L, Sanz-Requena R, Belloch E, Moratal D. In vivo trabecular bone morphologic and mechanical relationship using high-resolution 3-T MRI. AJR Am J Roentgenol. 2008;191(3):721–6. doi: 10.2214/AJR.07.3528. [DOI] [PubMed] [Google Scholar]
- 34.Pardo SJ, Patel MJ, Sykes MC, Platt MO, Boyd NL, Sorescu GP, Xu M, van Loon JJ, Wang MD, Jo H. Simulated microgravity using the Random Positioning Machine inhibits differentiation and alters gene expression profiles of 2T3 preosteoblasts. Am J Physiol Cell Physiol. 2005;288(6):C1211–21. doi: 10.1152/ajpcell.00222.2004. [DOI] [PubMed] [Google Scholar]
- 35.Kitching R, Qi S, Li V, Raouf A, Vary CP, Seth A. Coordinate gene expression patterns during osteoblast maturation and retinoic acid treatment of MC3T3-E1 cells. J Bone Miner Metab. 2002;20(5):269–80. doi: 10.1007/s007740200039. [DOI] [PubMed] [Google Scholar]
- 36.Engin F, Yao Z, Yang T, Zhou G, Bertin T, Jiang MM, Chen Y, Wang L, Zheng H, Sutton RE, Boyce BF, Lee B. Dimorphic effects of Notch signaling in bone homeostasis. Nat Med. 2008;14(3):299–305. doi: 10.1038/nm1712. [DOI] [PMC free article] [PubMed] [Google Scholar]
- 37.Schroeder TM, Nair AK, Staggs R, Lamblin AF, Westendorf JJ. Gene profile analysis of osteoblast genes differentially regulated by histone deacetylase inhibitors. BMC Genomics. 2007;9(8):362. doi: 10.1186/1471-2164-8-362. [DOI] [PMC free article] [PubMed] [Google Scholar]
- 38.Dufour CR, Wilson BJ, Huss JM, Kelly DP, Alaynick WA, Downes M, Evans RM, Blanchette M, Giguère V. Genome-wide orchestration of cardiac functions by the orphan nuclear receptors ERRalpha and gamma. Cell Metab. 2007;5(5):345–56. doi: 10.1016/j.cmet.2007.03.007. [DOI] [PubMed] [Google Scholar]


