Abstract
Currently, optical coherence tomography (OCT), is not capable of obtaining molecular information often crucial for identification of disease. To enable molecular imaging with OCT, we have further developed a technique that harnesses transient changes in light absorption in the sample to garner molecular information. A Fourier-domain Pump-Probe OCT (PPOCT) system utilizing a 532 nm pump and 830 nm probe has been developed for imaging hemoglobin. Methylene blue, a biological dye with well-know photophysics, was used to characterize the system before investigating the origin of the hemoglobin PPOCT signal. The first in vivo PPOCT images were recorded of the vasculature in Xenopus laevis. The technique was shown to work equally well in flowing and non-flowing vessels. Furthermore, PPOCT was compared with other OCT extensions which require flow, such as Doppler OCT and phase-variance OCT. PPOCT was shown to better delineate tortuous vessels, where nodes often restrict Doppler and phase-variance reconstruction.
Keywords: molecular contrast, optical coherence tomography, hemoglobin, pump-probe spectroscopy
Graphical Abstract
1. Introduction
Optical Coherence Tomography (OCT) is a non-invasive imaging modality that acquires micron-scale resolution morphological tissue images up to 2 millimeters in depth (1). Applications of OCT encompass many aspects of biology and medicine, including developmental biological studies, small animal imaging, neural imaging, elastography, and endoscopy (2–6). The primary clinical application of OCT has been structural imaging of the retina and anterior segment of the eye, as well as imaging and analysis of atherosclerotic plaques in coronary arteries (7, 8); however, emerging applications in dermatology, dentistry, and surgery are currently under investigation.
OCT gains its contrast by probing variations in the refractive index of tissue. While conventional OCT is highly sensitive to structural changes, it lacks access to molecular information because the index of refraction variation between different types of biomolecules is insignificant. Molecular-sensitive imaging modalities enable functional imaging of local biochemistry of tissue and better visualization of pathological and physiological processes. Merging molecular sensitivity with structural imaging at micron-scale resolution creates a unique toolkit for more fully characterizing tissue. Unfortunately, due to its interferometric detection scheme, OCT is incompatible with many common methods for obtaining molecular contrast. Incoherent processes, such as fluorescence emission and Raman scattering, are incompatible with the coherent detection utilized in OCT. Regardless, introducing molecular contrast to OCT provides several advantages when compared to existing microscopic molecular imaging techniques, such as larger working distances and increased penetration depths. More importantly, adding molecular contrast to OCT enables specific imaging of notable biomolecules, such as hemoglobin and melanin, as well as exogenous chromophores, such as dyes or nanoparticles, alongside the structural images through which OCT has garnered widespread use.
Previous efforts to introduce molecular contrast into OCT include second harmonic generation (SHG) OCT (9–12), which took advantage of intrinsic second harmonic generation of collagen fibers. Another technique, spectroscopic OCT, allows for spectroscopic analysis of molecular signatures present in the backscattered spectrum (13, 14), while photothermal OCT exploits the photothermal effect using endogenous or exogenous chromophores to detect thermally-induced changes in refractive index (15–17).
Pump-probe OCT (PPOCT) merges pump-probe spectroscopy, a molecular-sensitive technique employed in chemical physics, with OCT. Pump-probe spectroscopy measures the change in absorption of one light field (probe) induced by molecular excitation through a second light field (pump). If the pump is amplitude modulated, transference of the modulation to the probe via a pump-probe mechanism is considered a pump-probe signal. There are a variety of physical mechanisms which could lead to a pump-probe signal including transient absorption, stimulated emission, photo-degredation and photoisomerization (18). As an example, consider methylene blue (MB), one of the chromophores investigated in these studies. The photophysics of MB have been well studied and unambiguously indicate transient absorption as the physical origin of the PPOCT signal at the pump and probe wavelengths used in this study.
MB is an FDA approved dye that has been used for various purposes (19, 20) since the early 20th century when it was used as an antimalarial drug (21). In MB, the singlet ground state to singlet excited state transition (S0 → S1) has a broad absorption with a peak at 660 nm. Strong spin-orbit coupling leads to an intersystem crossing to the triplet state manifold with a quantum yield of 0.51 (in water (22)) with some characteristic lifetime τ1-1. The triplet state has a broad absorption band centered at 830 nm. When the pump is off, MB is transparent at 830 nm. However, when the pump is on, T1 is populated and MB has a strong absorption band centered at 830 nm. A 532 nm pump excitation beam that has been amplitude modulated at some frequency f will produce amplitude modulation (through a modulated absorption coefficient) in an 830 nm probe at the same frequency. In PPOCT, we expect the MB pump-probe signal to be 180 degrees out of phase with the pump, since pump-induced absorption results in a loss of OCT/probe backscatter.
The transient absorption mechanism gives rise to two physical properties that may be used to gain molecular specificity: the transient absorption spectrum and ground state recovery time. The transient absorption spectrum may be obtained by varying either the pump or probe wavelengths and recording the resulting transient absorption signal as a function of wavelength. The ground state recovery time, which describes the time taken for electrons to relax back to the ground state after photoexcitation, may be measured by observing the transient absorption signal while varying the time delay between pump and probe light pulses (interpulse delay).
The first demonstration of PPOCT measured signal due to MB in intralipid tissue phantoms utilizing a pump wavelength at the blue end (530 nm) of the 660 nm band and a probe wavelength at 830 nm (23). Later work demonstrated the viability of ex vivo vasculature PPOCT imaging by employing a degenerate 530 nm pump-probe scheme to measure the efferent filament arteries in an adult zebra danio. (24) The same work also demonstrated ex vivo imaging of the fluorescent protein DsRed expressed in the zebrafish, and measured the ground state recovery time of Rhodamine 6G and hemoglobin. More recent work demonstrated PPOCT imaging of melanin using a Fourier-domain OCT system (18), as opposed to previous PPOCT implementations which were restricted to time-domain. Advantages of Fourier domain PPOCT over its time-domain counterpart include higher sensitivity, leading to faster imaging speeds.
In this manuscript, we report the use of Fourier domain PPOCT for in vivo imaging of microvasculature for the first time. Other functional extensions of OCT have previously been developed for such an application. Namely, Doppler OCT (DOCT) merges Doppler velocimetry with OCT to measure the velocity of moving scatterers by calculating the Doppler shift at each pixel in an OCT dataset (25, 26). DOCT has been reported to image and calculate bi-directional blood flow in the human retina in vivo (27), to image cardiac flow dynamics in vivo in Xenopus laevis embryos (28), and to assess cardiac mechanical properties in chick embryos in vivo by calculating radial strain from blood velocity distributions (29). Other functional extensions of OCT targeting vasculature imaging include phase-variance optical coherence tomography (pvOCT), which calculates the phase variance between successive b-scans to identify areas of motion, e.g. blood flow (30). Furthermore, laser speckle imaging (31) and optical microangiography (OMAG) (32) utilize speckle variance to delineate vasculature.
However, the aforementioned techniques lack access to molecular information, such as the absorption coefficient of hemoglobin. Photoacoustic microscopy (PAM) is another optical imaging modality well suited to imaging hemoglobin. PAM can produce 3D reconstructions of microvasculature, but lacks the structural information accessible through OCT-based techniques (33).
This work utilizes a novel two-color Fourier-domain PPOCT scheme with a 532 nm pump wavelength and a 830 nm probe wavelength to target hemoglobin and methylene blue. Due to its poor quantum yield, hemoglobin is difficult to image with conventional molecular contrast imaging techniques. However, hemoglobin has been shown to be sensitive to transient absorption in pump-probe extensions in the fields of microscopy and photoacoustic imaging (34, 35).
It proves helpful to compare the benefits of PPOCT to DOCT, which is a more developed and well-studied functional extension of OCT often employed to image vasculature. In addition to vasculature imaging, DOCT allows for quantification of blood flow and flow mapping over a volumetric region (36). Utilizing these flow maps, several biomechanical properties, including tissue stress and strain, can be calculated (29). However, because of its dependence on Doppler shift, DOCT necessitates that the scatterers of interest must be dynamic (i.e. flowing) in order to be resolved. Therefore, DOCT is insensitive to stationary chromophores, such as “blood islands” prominent in developmental studies before circulation of blood begins. Likewise, imaging of vasculature of excised tissues such as biopsies is not possible with DOCT because of the lack of flow. Additionally, again due to its dependence on Doppler shift, DOCT is highly sensitive to phase noise and the orientation of blood flow. That is, if the flow of scatterers is perpendicular to the optical axis, the Doppler shift cannot be calculated and DOCT will not resolve the vessel. Lastly, DOCT has difficulty differentiating blood from other flowing scatterers, such as lymph. In contrast, PPOCT gains molecular contrast via pump-probe mechanisms in individual chromophores, which inherently provide molecular specificity and enhanced sensitivity from stationary chromophores and blood flow perpendicular to the optical axis. Secondly, molecular contrast can enable the differentiation of related chromophores such as oxy- and deoxyhemoglobin, the relative concentration of which may be used to estimate the blood oxygen saturation.
2. Experimental methods and materials
2.1 Optical system design
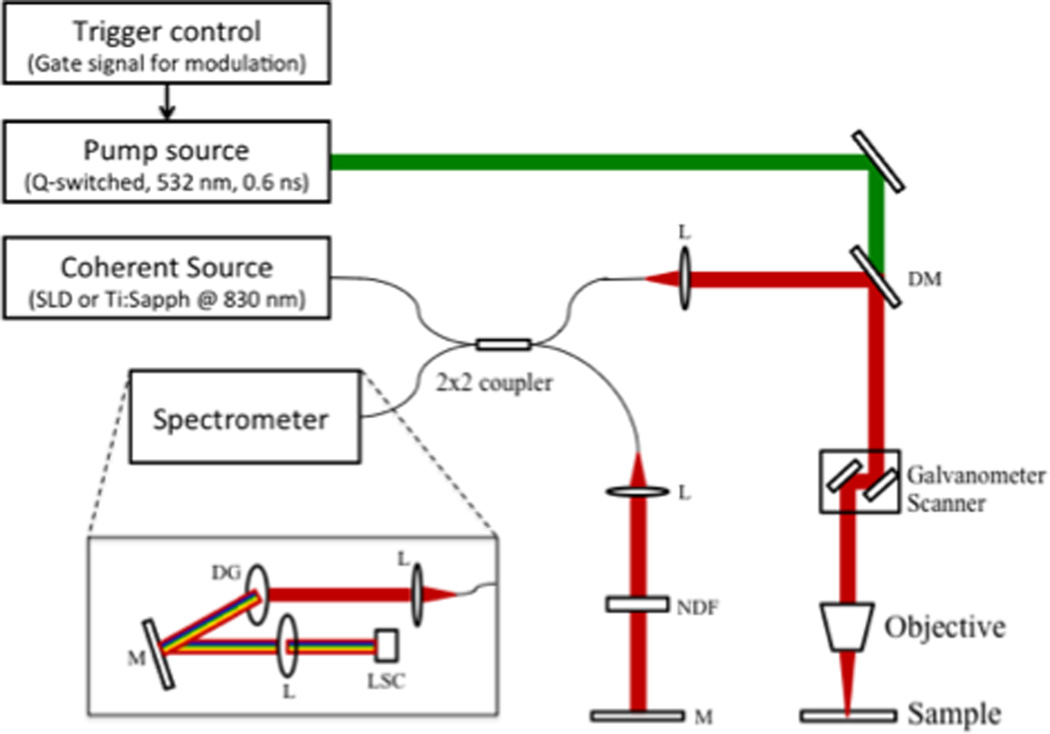
The schematic of the two-color Fourier-domain PPOCT system is illustrated in Figure 1. Two different near-infrared sources were utilized as the probe/OCT beam. The first was a tunable 140 fs Ti:Sapphire laser operated at 830 nm. The Ti:Sapphire was spectrally broadened to ~ 200 nm bandwidth. The SLD with a center wavelength of 830 nm and a bandwidth of 40 nm was utilized as the second probe source. The SLD allowed for greater power on the sample and offered better intensity stability than the Ti:Sapphire. The powers of the pump and probe sources are stated for each individual experiment below. The probe source was launched into a 2×2 (50:50) fiber coupler. Galvanometer mirrors were used to laterally scan the OCT beam over the sample, while a mirror positioned in the referenced arm completed the Michelson interferometer. The pump source consisted of an actively Q-switched Nd:YVO4 laser, frequency doubled to 532 with a maximum pulse repetition rate of 100 kHz. Co-propagation of pump and probe beams at the sample was achieved using a dichroic mirror. A custom spectrometer employing a linescan camera with a maximum line rate of 53 kHz completed the FD-OCT system.
When precise control of interpulse delay was required, the Ti:Sapphire was utilized as the probe and the Q-switched pump was triggered by a sync pulse from the Ti:Sapphire pulse picker, which enabled temporal synchronization of both lasers. The sync pulse was passed through a digital delay generator (Hiland Technology, P-400) to allow control of the interpulse delay. The sync pulse of the Ti:Sapph was also used to trigger the linescan camera to capture the back-reflected spectra. A camera integration time of 20 µs was used, which limited the repetition rate to 40 kHz. In order to encode the transient absorption into the OCT signal, a 15 kHz squarewave modulation was used to time-gate the Q-switch output and amplitude modulate the pump source. Conventional OCT processing methods were utilized to acquire an OCT m-scan. The pump-modulated PPOCT information was extracted by performing a Fourier transform of the m-scan along the time dimension and subsequently filtering around the modulation frequency at each depth, yielding a PPOCT a-line. Therefore, an OCT m-scan corresponds to a PPOCT a-line. Similarly, a PPOCT B-scan can be obtained from a 2-D OCT m-scan. This processing technique is outlined in more detail in (37).
The imaging speed of the system is governed by the OCT line rate and the number of OCT a-lines (m-scan) used to produce a PPOCT a-line. Due to the PPOCT processing algorithm, reducing the number of OCT a-lines yields faster PPOCT imaging rates, but reduces PPOCT SNR. The number of OCT a-lines used to generate each PPOCT a-line in Figs. 4 and 5 was 300 resulting in an effective line rate of 133 Hz. For figs 3 and 6, 100 a-lines were used for an effective line rate of 400 Hz. Previous work characterized the speed and SNR relationship of a similar Fourier-domain PPOCT system (37).
Pump power also contributes to PPOCT SNR. While higher pump power could be used to achieve better signal quality, the safety of the specimen being imaged needs to be taken into account. For the in vivo experiments in this study, the surface fluence was kept below the ANSI safety limits for skin.
Finally, we should note that PPOCT inherently measures the attenuation of light due to absorption. Absorption of light is integratived over its pathlength, hence the PPOCT signal is inherently dependent on the pathlength through the sample. Similarly, since the attenuation is reported by light that is backreflected from the sample, the signal is dependent on the sample reflectivity and the location in the sample where it was reflected. (38) In other words, probe light incident on the sample that passes through the chromophore will be attenuated and modulated by the pump interaction with the chromophore. This light can be backreflected at the chromophore or somewhere deeper. The light reflected at the chromophore accurately reports the attenuation and position of the chromophore. However, light reflected deeper than the chromophore accurately reports the attenuation, but not the chromophores location. This effect will be obvious in the images of capillary tubes shown below (Fig. 3) where a PPOCT signal is observed at the bottom surface of the capillary tube but not the top. As we have discussed previously (24) this ambiguity may be lifted by normalizing to the reflectivity measured in the OCT image and calculating the derivative after smoothing to reduce speckle.
For the images shown below, we have not taken this additional processing step. Blood is a strong absorber and scatterer, hence the majority of the PPOCT signal is at the position of the blood vessel. In our previous work with imaging blood we only noted a modest improvement by calculating the derivative image but with a substantial sacrifice of resolution.
3. Results and discussion
3.1 PPOCT system characterization
We have investigated the lifetime characteristics of the PPOCT signal from both MB and hemoglobin with a 532 nm pump and an 830 nm probe. MB serves as an archetypal molecule where the photophysics are well known. Hemoglobin, on the other hand, is a complex heme protein with photophysics that are not well understood. This leads to some ambiguity in the origin of the hemoglobin PPOCT signal.
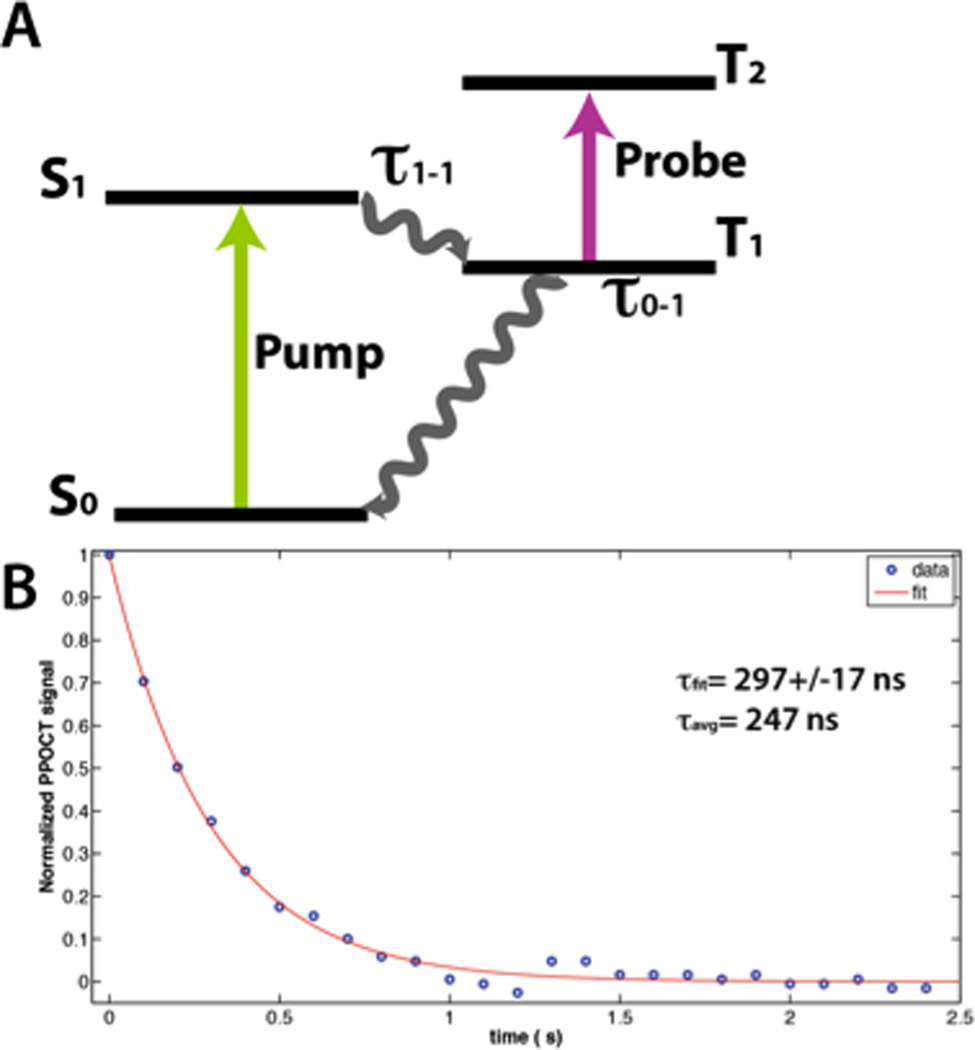
The performance of the system was evaluated by measuring the PPOCT signal from a 0.05 % solution of MB between two coverslips. The average power of the pump and probe beams were 17 mW and 160 µW (100 kHz repetition rate), respectively. Recording the PPOCT signal as a function of the pump-probe interpulse delay enabled the measurement of the triplet state dynamics. The strongest PPOCT signal arises from the top surface of the bottom coverslip with this sample. The peak of that signal is plotted as a function of interpulse delay in Figure 2B while Figure 2A depicts the pump-probe process exploited for MB PPOCT imaging.
The resulting temporal decay was fit to a single exponential curve. The inverse of the decay constant is the lifetime of the T1 state or τ0-1 assuming the intersystem crossing is very fast and τ1-1 is therefore negligible. A lifetime of 297±17 ns was measured, where the quoted error is the 95% confidence interval from a fit of 25 data points collected at 100 ns intervals. The MB triplet state is readily quenched by oxygen, hence the exact lifetime is a function of the oxygen level in the MB solution and varies from less than 0.3 µs to 79.5 µs (39). A highly oxygenated state is expected since no effort was made to deoxygenate the solution. However, the measured lifetime is lower than one would expect given a MB solution stored in air and likely contains some contribution from photobleaching. Nevertheless this result demonstrates the system’s ability to measure the temporal decay of the pump-probe signal with increasing interpulse delay.
The average lifetime is much faster and easier to calculate than an exponential fit. Moreover, it is more reliable for noisy data. The calculated average lifetime for the decay in Figure 2B is 247 ns, somewhat lower than given by the fit, but still reasonable. The average lifetime is more practical for high-speed imaging and may prove useful in the future for differentiating chromophores based on their lifetime characteristics.
Since 532 nm and 830 nm pump-probe imaging of Hb has not previously been demonstrated, we sought to characterize the lifetime dynamics of the Hb signal for the first time. Time resolving the PPOCT signal from Hb yielded a somewhat unexpected result. While there is clearly a variation in the Hb signal on the time scale of the 15 kHz modulation (66 µs) there was no apparent change in the signal when we varied the delay over the entire 25 µs period (40 kHz) between pulses. Given the fairly strong intensity noise due to spectral broadening of the Ti:Sapphire pulses in the single mode fiber, we would estimate the accuracy of our measurement to ±5%. Nevertheless, that would seem to indicate that we are exciting the Hb into some long-lived state. A literature search yielded two mechanisms that would explain our observations. The first is that photo-initiated oxidation of Fe2+ into Fe3+ in the heme protein via the 532 nm pump results in the formation of methemoglobin (metHb) (40). MetHb has a factor of 2–3 larger absorption coefficient than oxy- and deoxy-Hb in the NIR (41). Since metHb is only slowly enzymatically (42) converted back to Hb, each time the pump interacts with the blood sample the concentration of metHb increases stepwise. The frequency spectrum of a stepwise increasing function has a strong component at the step frequency, hence modulation of the pump intensity leads to a modulation in the nearIR absorption that would be observed in the probe.
The second mechanism involves the population of high lying vibrational states in the ground state of oxy- and deoxy-Hb which will effectively red-shift the absorption spectrum (43) leading to a relative change in the nearIR absorption. The high lying vibrational states are populated via internal conversion of the excited electronic state which has been populated by the 532 nm radiation. This creates “hot bands” in the hemoglobin spectrum that leads to the red-shift. This can be thought of as local heating which shifts the Boltzmann distribution thereby populating higher vibrational states in the ground electronic state. The net result is that a modulation of the pump power leads to a modulation in the nearIR absorption that would be observed in the probe and have a long lifetime.
It seems likely given the results in the literature that both mechanisms play some role. Our current hypothesis is that the first mechanism (metHb) is more important at high power and long dwell times and the second mechanism is more important at lower powers and short dwell times. This hypothesis is based in part on our observation of the formation of solids in capillary flow tubes with high pump powers and with low pump powers on samples with no flow after long exposure times. The formation of solids was accompanied by strong PPOCT signals. These observations are consistent with the prior mechanistic studies of photocoagulation that showed significant concentrations of metHb at the onset of coagulant formation (41). Taking into consideration light scattering and the relatively low powers used for in vivo imaging in this work, the second mechanism most probably is the primary contributor to the PPOCT signal for in vivo imaging.
Establishing a more clear understanding of the photophysics at play will be key to moving forward and developing techniques for oxygen saturation measurement. In the first mechanism, formation of metHb is believed to primarily follow from oxy-Hb. The lack of sensitivity to deoxy-Hb would complicate any algorithm designed to measure oxygen saturation. The second mechanism on the other hand would occur in both oxy- and deoxy-Hb and likely change the NIR absorption in different ways. This mechanism would lend itself to a more straightforward algorithm development.
We should also note that there may be some contribution simply from the thermal heating of the sample leading to movement of the scatters. Both mechanisms involve heating of the sample. This type of contrast has been observed previously with gold nanoparticles (16, 44) as well as blood (17). In these works thermal heating leads to submicron movement of the scatterers that is detected in the interferometric phase by phase-sensitive OCT. In our PPOCT experiments we measure the modulation of the interferometric amplitude, not the phase. While there is undoubtedly some modulation of the phase as well, the scatterer motion should be well below the resolution of the OCT system and therefore only make a very minor contribution to the signal, if any. Additionally we would expect a strong signal in the interferometric phase at the modulation frequency if the signal were due to thermally induced movements of the scatters. We only measure a very weak phase signal when the amplitude signal is quite strong. Finally, the PPOCT images of the blood filled capillary tube in Fig. 3B (right) shows signal at the bottom surface of the capillary tube but not the top. This is a well known artifact associated with PPOCT (discussed above) that should not be present if the contrast were due to thermally induced movement of the blood.
3.2 Time resolved PPOCT for molecular specificity
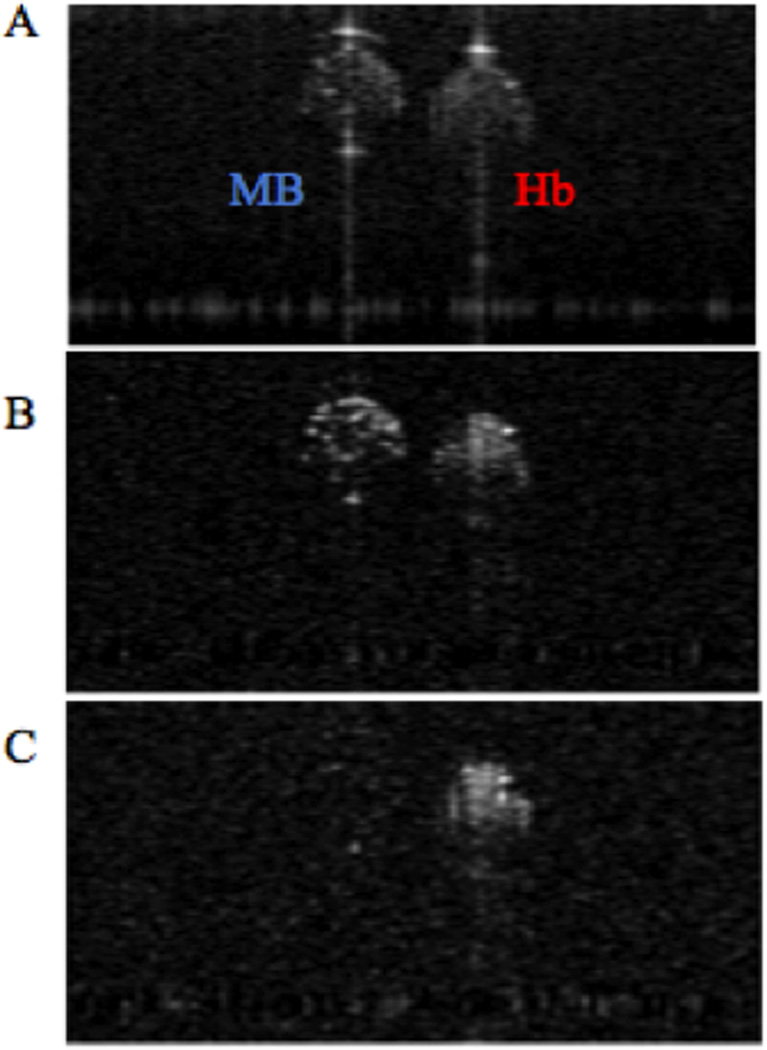
The vastly different excited state dynamics of Methylene Blue and hemoglobin allow the two chromophores to be differentiated by observing PPOCT signals from two different interpulse delays: one immediately after the pump, where the transient absorption should be greatest, and one long after the excited triplet state of the Methylene Blue has relaxed down to the ground state. The current PPOCT system can image Methylene Blue and hemoglobin simultaneously and subsequently separate the two signals based on ground state recovery time. In order to verify this assertion, two capillary tubes (200 µm inner diameter), one filled with bovine whole blood and the other filled with Methylene Blue, mixed with polystyrene beads to provide scattering contrast, were imaged with the PPOCT system. The pulse picker of the Ti:Sapphire laser was synchronized with both the trigger input of the Nd:YVO4 and the linescan camera of the spectrometer. The power at the sample of the Ti:Sapphire and the Nd: YVO4 were kept constant at 90 µW and 15 mW, respectively. Both probe and pump were operated at a repetition rate of 40 kHz. As shown in Figure 3, PPOCT B-scans of the capillary tubes containing Methylene Blue and hemoglobin were obtained. Figure 3A depicts a conventional OCT B-scan of the capillary tubes. Figure 3B depicts a PPOCT B-scan obtained with a pump/probe delay of 3 ns, thus ensuring optimal PPOCT signal from methylene blue. Figure 3C shows a PPOCT B-scan taken at an interpulse delay of 24.8 µs, ensuring that the probe irradiation occurs well after the 297 ns ground state recovery time of the triplet state. As expected, this results in no PPOCT signal from Methylene Blue in figure 3C. In contrast to Methylene Blue, hemoglobin’s long-lived state populated by the pump allows absorption of the probe even at an interpulse delay of 24.8 µs. A PPOCT B-scan obtained with the pump blocked was used for background subtraction from each PPOCT image.
It is important to note, that the specular reflection from the top of the capillary tubes only show up in the OCT image, while the specular reflection from the bottom of the capillary tubes show up in all images. This is consistent with expectations as explained in (19), since only surfaces after an absorption event will carry signal due to transient absorption.
This experiment illustrated the first time separation of different chromophores via lifetime with PPOCT. The extreme difference in the dynamics of MB and Hb enabled the use of only two time points to distinguish them. As the dynamics of the chromophores become more similar it will be necessary to use more sophisticated techniques such as fitting the temporal decay or calculating the average lifetime as shown for MB above. Furthermore, differentiation of chromophores via lifetime may prove important when the chromophores of interest exhibit overlapping absorption spectra. If the absorption bands of the chromophores are sufficiently distinct, then techniques such as spectroscopic OCT could be used to differentiate the chromophores based on absorption. However, spectroscopy OCT suffers from an inherent tradeoff between depth resolution and spectral resolution. If high spectral resolution is required to separate the chromophores, knowledge of their depth location is sacrificed. Therefore, differentiation of chromophores via lifetime, as demonstrated in this work, may prove important when the chromophores of interest exhibit overlapping absorption spectra.
3.3 In vivo PPOCT imaging
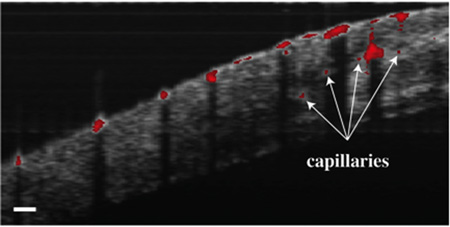
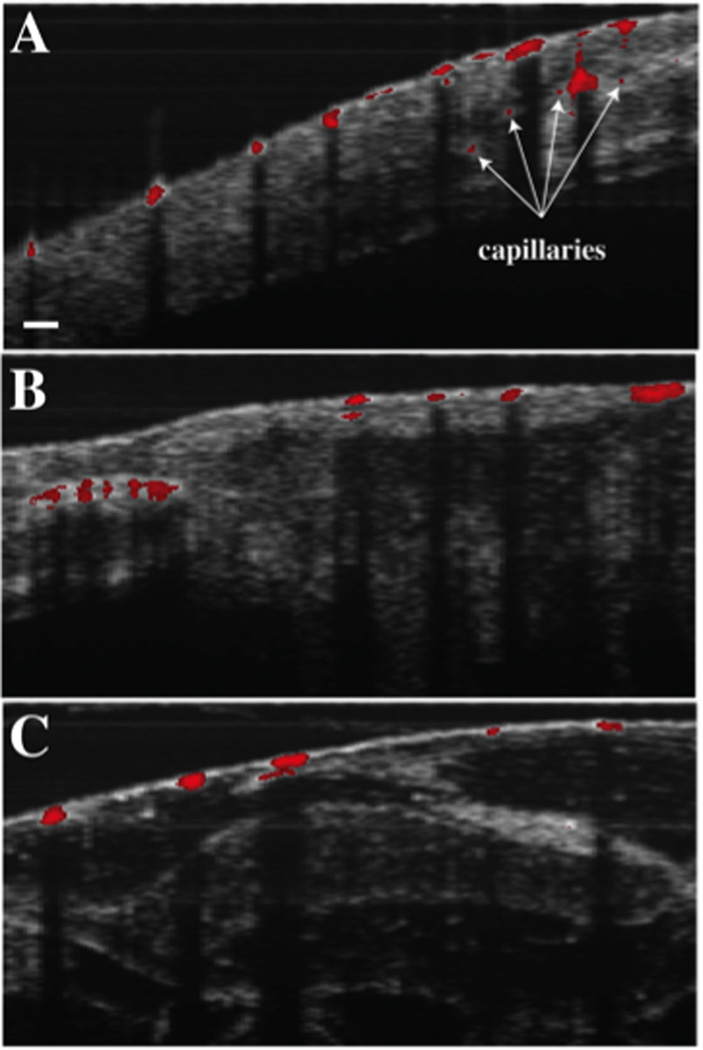
To demonstrate the first in vivo PPOCT images of Xenopus tadpole vasculature, the SLD was used as the probe, which offered better stability and offered higher power than the pulse-picked Ti:Sapph laser. The probe and pump powers were kept constant at 1.2 mW and 10 mW respectively. Live Xenopus tadpoles were anesthetized according to the animal use protocol overseen by the Institutional Animal Care and Use Committee at Texas A&M University and imaged with the PPOCT system. Figure 4 depicts three OCT B-scans overlayed with the intrinsically co-registered, thresholded PPOCT B-scans. The tadpole vasculature is clearly identified via the PPOCT overlay. It is interesting to note that several capillaries (denoted by arrows), which were not identifiable in the conventional OCT B-scan, are easily identified by the added PPOCT molecular contrast.
We have previously explored the sensitivy of PPOCT both theoretically (38) (24) and experimentally (18) (24). When imaging melanin with a nearIR pump and probe, we were able to measure PPOCT signals at the full depth of the OCT image. In these experiments we do not have the same control over the sample; how-ever, we can compare signals from vessels measured at various depths to get a qualitative feeling for the sensitivity and potential imaging depth. In a cross-sectional image similar to one shown in Fig. 4A (nearby in the volume stack) we identified 3 nearly equally spaced vessels. The vessels where at a depth of 0 µm, 223 µm, and 450 µm. On an SNR scale the signal from each was 31 dB, 28 dB, and 23 dB, respectively. The two deepest vessels were capillary sized while the surface vessel was larger. Assuming homogenous tissue with a constant scattering coefficient the signal should decay approximately linearly with depth when viewed on a log scale. A linear fit predicts an SNR of 14 dB at the full depth of the OCT image which was ~950 µm. Under these experimental conditions we should be able to observe PPOCT signal from blood up to the full imaging depth in this sample. Of course it is always possible to trade time (number of a-lines used) for signal in order to improve SNR.
The B-scans in Figure 4 clearly illustrate that PPOCT can be used to discriminate vasculature in vivo. As previously discussed, there are also well known extensions of OCT that can accomplish the same task while also supplying information related to blood flow velocity, DOCT, pvOCT and speckle variance OCT techniques. However, if the flow is orthogonal to the optical axis, the Doppler shift is exactly zero and the DOCT and pvOCT signals will also be zero. This issue is prominent if the path of the vasculature becomes tortuous, in which case the flow changes direction frequently and abruptly leading to nodes in the DOCT and pvOCT images. These vessel discontinuities must be restored in order to properly map the vascular network.
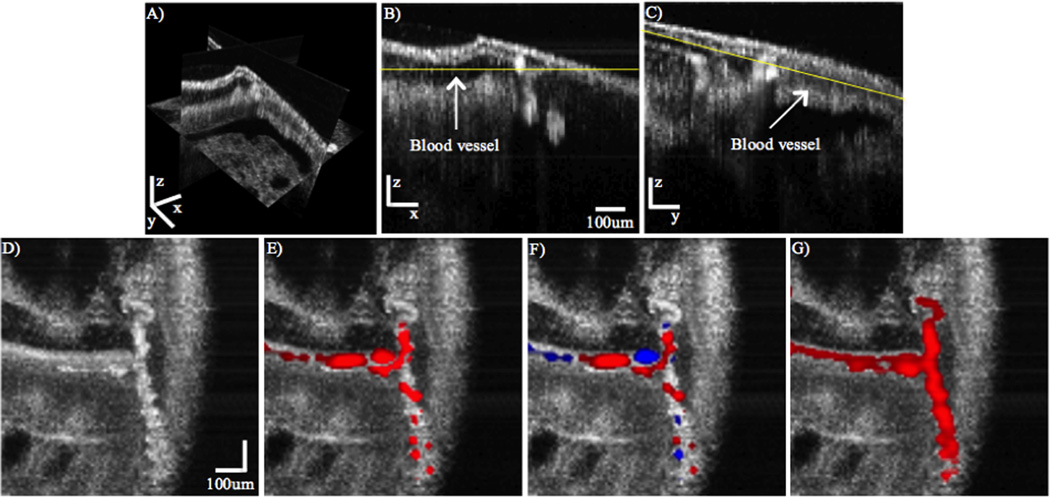
To illustrate this point, a volumetric PPOCT image of a tortuous vessel in an anesthesized Xenopus tadpole was acquired. Conventional DOCT and pvOCT post processing was performed on the same data set, since, the data required for Doppler and phase-variance processing is already acquired for PPOCT imaging. To ensure that the discontinuities in the DOCT and pvOCT images were not just due to low SNR at random image location, but rather due to low SNR at and around the nodes, we implemented spatial averaging to improve the SNR of the image. The same processing was also applied to the PPOCT images to facilitate comparison. We should note that far more OCT a-lines were used to calculate the DOCT image than are typically used which further improved the SNR over what is typically found in the literature.
The averaging was performed as follows. The volumetric image was convolved in three-dimensions with a weighting function in which the weights were calculated as one divided by the pixel distance from the center pixel, including all pixels up to ±2 from the center. For the purpose of calculating the weighted average of the pixels near the perimeter of the volume, the pixels outside the volume boundary were assumed to have a pixel value equal to the nearest known pixel value.
Figure 5 depicts an OCT volume (A) and two B-scans (B, C) depicting cross-sectional images of blood vessels. (D – G) are cross-sectional cuts along the yellow lines depicted in (B) and (C). The OCT, pvOCT, DOCT, and PPOCT images are depicted in (D), (E), (F), and (G), respectively. As discussed above, vasculature contrast in pvOCT and DOCT may result in nodes when imaging tortuous vessels. Because of its inherent molecular contrast, PPOCT is not sensitive to directionality of flow. This fact is evidenced in Figure 5G, in which the entire vessel structure is clearly demarcated by the additional PPOCT contrast. Note that sharp changes in flow directionality do not degrade the PPOCT signal, in contrast to the pvOCT and DOCT images where nodes are clearly visible. From these results it appears PPOCT contrast may be more desirable than DOCT or pvOCT when imaging tortuous vasculature. In addition, since pvOCT and DOCT processing can be performed on PPOCT data, any flow velocity information not inherent to PPOCT contrast can be obtained in post-processing.
Speckle variance techniques for imaging flow with OCT can also accurately reproduce the vasculature even when the flow is orthogonal to the illumination. However the imaging speed for these techniques are fundamentally tied to the speckle decorrelation time which can be milliseconds (45, 46) for slow flowing blood like that found in capillary beds. Consequently, improving the imaging speed of the OCT system by for instance using a linescan camera with shorter read time and therefore higher line rates will not improve the imaging speed of speckle variance techniques in the same way it would for PPOCT.
Neovascularization and angiogenesis in malignant tumors typically leads to tortuous and leaky vascular networks. According to (47), “blood vessels of tumors are a mess—chaotic, leaky, inefficient, and barely making do.” OCT and its functional derivatives have been used extensively as a tool for understanding tumor growth including neovascularization and angiogenesis (48). PPOCT imaging of hemoglobin can augment this set of tools to provide a more complete vascular map. It may also be able to provide some insight into leaky vasculature if erythrocytes are leaked to the surrounding tissue.
Many cancer studies are initiated for, or involve the imaging of excised tissue either from tissue biopsies or from excised tumors. In these cases, OCT techniques which require flow for mapping vasculature obviously fail. However, since PPOCT imaging of vasculature only requires the presence of hemoglobin, it may be used as a tool to grade the extent of neovascularization and angiogenesis in excised tissues.
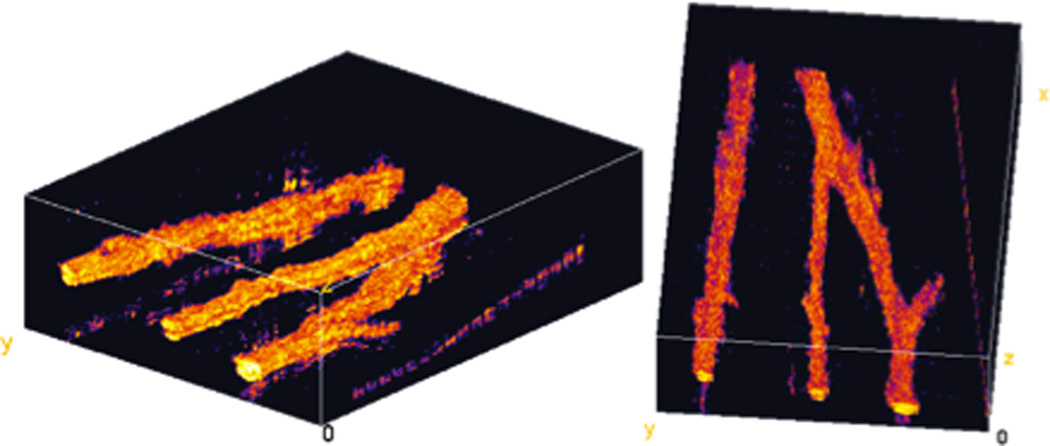
An ex vivo image of the vasculature in a euthanized Xenopus tadpole is shown in Figure 6. These two views of a volumetric PPOCT dataset show several vessels including a bifurcation. Qualitatively, the signal strength from non-flowing blood is stronger than for flowing blood. This may be due the generation of metHb in coagulated blood, hence engaging the first of the mechanisms for PPOCT signal generation discussed above.
PPOCT is directly measuring absorption in the molecule of interest, which suggests this technique could be used to measure blood oxygen saturation (SO2), a key parameter for early indication of many pathological conditions. PPOCT for retinal imaging may enable vasculature demarcation with simultaneous SO2 measurements. The complementary structural and functional information provided via PPOCT may enable more accurate tracking of ocular diseases. The current standard for functional retinal imaging is a multi-color Scanning La-ser Ophthalmoscope (SLO). However, SLO images are restricted to an en face view of the fundus due to its con-focal gating detection scheme. Therefore, SO2 measurements and other functional parameters can only be extracted from the surface of the fundus. However, the retinal microvasculature is a complicated, three-dimensional network that extends through the different retinal sub-surface layers. As is well recognized, OCT coherence gating enables micron-scale, depth-resolved structural mappings of retinal layers. The additional molecular contrast provided by PPOCT could enable depth-resolved functional measurements of the entire retinal microvasculature, rather than solely surface vessels.
Lastly, PPOCT enables differentiation of chromophores based on the lifetime dynamics of the PPOCT signal. In this manuscript, we demonstrated differentiation between MB and Hb with as few as two measurements. In the future, different biological structures could be tagged with MB and along with the surrounding vasculature, could be simultaneously imaged and differentiated with PPOCT. For example, lymphatic vessels tagged with MB can be differentiated from surrounding vasculature with PPOCT. Moreover, other exogenous and endogenous chromophores such as other heme proteins (e.g. cytochrome c) or fluorescent proteins (DsRed) can be investigated as possible PPOCT contrast agents.
4. Conclusion
Molecular imaging in OCT enables access to functional information in addition to the structural imaging of conventional OCT. Using a novel, two-color Fourier-domain PPOCT system, the first in vivo cross-sectional PPOCT images of Xenopus tadpole vasculature were obtained. Additionally, varying the interpulse delay enabled differentiation of PPOCT signals originating from Methylene Blue and hemoglobin. PPOCT imaging of vasculature was compared to pvOCT and DOCT and determined to more accurately demarcate tortuous microvasculature, while still maintaining the data needed to calculate flow information. In future work, PPOCT could be utilized to study the development of the lymphatic and vasculature systems simultaneously. Furthermore, if pump power levels are reduced, PPOCT could be a viable tool to measure blood oxygen saturation in the human eye.
Acknowledgments
We gratefully acknowledge financial support for this work via grants from the National Institutes of Health (NCRR, 1R21RR025799) and the National Science Foundation (CAREER, CBET-1055359).
References
- 1.Huang D, Swanson EA, Lin CP, Schuman JS, Stinson WG, Chang W, Hee MR, Flotte T, Gregory K, Puliafito CA, Fujimoto JG. Science. 1991;254:1178–1181. doi: 10.1126/science.1957169. [DOI] [PMC free article] [PubMed] [Google Scholar]
- 2.Kagemann L, Ishikawa H, Zou J, Charukamnoetkanok P, Wollstein G, Townsend KA, Gabriele ML, Bahary N, Wei X, Fujimoto JG, Schuman JS. Molecular vision. 2008;14:2157–2170. [PMC free article] [PubMed] [Google Scholar]
- 3.Yelbuz TM, Choma MA, Thrane L, Kirby ML, Izatt JA. Circulation. 2002;106:2771–2774. doi: 10.1161/01.cir.0000042672.51054.7b. [DOI] [PubMed] [Google Scholar]
- 4.Sergeev A, Gelikonov VM, Gelikono GV, Feldchtein FI, Kuranov RV, Galdkova ND, Shakhova NM, Snopova LB, Shakov AV, Kuznetzova IA, Denisenko AN, Pochinko VV, Chumakov YP, Streltzova OS. Optics express. 1997;1:432–440. doi: 10.1364/oe.1.000432. [DOI] [PubMed] [Google Scholar]
- 5.Lazebnik M, Marks DL, Potgieter K, Gillette R, Boppart SA. Optics letters. 2003;28:1218–1220. doi: 10.1364/ol.28.001218. [DOI] [PubMed] [Google Scholar]
- 6.Khalil AS, Chan RC, Chau AH, Bouma BE, Mofrad MRK. Ann Biomed Eng. 2005;33:1631–1639. doi: 10.1007/s10439-005-6766-3. [DOI] [PubMed] [Google Scholar]
- 7.Swanson EA, Izatt JA, Hee MR, Huang D, Lin CP, Schuman JS, Puliafito CA, Fujimoto JG. Optics letters. 1993;18:1864–1866. doi: 10.1364/ol.18.001864. [DOI] [PubMed] [Google Scholar]
- 8.Yabushita H, Bouma BE, Houser SL, Aretz HT, Jang IK, Schlendorf KH, Kauffman CR, Shichkov M, Kang DH, Halpern EF, Tearney GJ. Circulation. 2002;106:1640–1645. doi: 10.1161/01.cir.0000029927.92825.f6. [DOI] [PubMed] [Google Scholar]
- 9.Sarunic MV, Applegate BE, Izatt JA. Optics letters. 2005;30:2391–2393. doi: 10.1364/ol.30.002391. [DOI] [PubMed] [Google Scholar]
- 10.Applegate BE, Yang C, Rollins AM, Izatt JA. Optics Letters. 2004;29:2252–2254. doi: 10.1364/ol.29.002252. [DOI] [PubMed] [Google Scholar]
- 11.Jiang Y, Tomov I, Wang Y, Chen Z. Opt. Lett. 2004;29:1090–1092. doi: 10.1364/ol.29.001090. [DOI] [PubMed] [Google Scholar]
- 12.Vinegoni C, Bredfeldt JS, Marks DL, Boppart SA. Opt. Express. 2004;12:331–341. doi: 10.1364/opex.12.000331. [DOI] [PubMed] [Google Scholar]
- 13.Morgner U, Drexler W, Kartner FX, Li XD, Pitris C, Ippen EP, Fujimoto JG. Optics letters. 2000;25:111–113. doi: 10.1364/ol.25.000111. [DOI] [PubMed] [Google Scholar]
- 14.Robles FE, Wilson C, Grant G, Wax A. Nat Photonics. 2011;5:744–747. doi: 10.1038/nphoton.2011.257. [DOI] [PMC free article] [PubMed] [Google Scholar]
- 15.Adler DC, Huang SW, Huber R, Fujimoto JG. Optics express. 2008;16:4376–4393. doi: 10.1364/oe.16.004376. [DOI] [PubMed] [Google Scholar]
- 16.Skala MC, Crow MJ, Wax A, Izatt JA. Nano Letters. 2008;8:3461–3467. doi: 10.1021/nl802351p. [DOI] [PMC free article] [PubMed] [Google Scholar]
- 17.Kuranov RV, Qiu J, McElroy AB, Estrada A, Salvaggio A, Kiel J, Dunn AK, Duong TQ, Milner TE. Biomed Opt Express. 2011;2:491–504. doi: 10.1364/BOE.2.000491. [DOI] [PMC free article] [PubMed] [Google Scholar]
- 18.Jacob D, Shelton RL, Applegate BE. Optics Express. 2010;18:12399–12410. doi: 10.1364/OE.18.012399. [DOI] [PMC free article] [PubMed] [Google Scholar]
- 19.Folkes LK, Wardman P. Cancer Res. 2003;63:776–779. [PubMed] [Google Scholar]
- 20.Wondrak GT. Free Radical Biology and Medicine. 2007;43:178–190. doi: 10.1016/j.freeradbiomed.2007.03.035. [DOI] [PMC free article] [PubMed] [Google Scholar]
- 21.Guttmann P, Ehrlich P. Berlin Klin. Wochenschr. 1891;28:953–956. [Google Scholar]
- 22.Wilkinson F, Helman WP, Ross AB. J Phys Chem Ref Data. 1993;22:113–262. [Google Scholar]
- 23.Rao KD, Choma MA, Yazdanfar S, Rollins AM, Izatt JA. Optics letters. 28:340–342. doi: 10.1364/ol.28.000340. (20039. [DOI] [PubMed] [Google Scholar]
- 24.Applegate BE, Izatt JA. Optics express. 2006;14:9142–9155. doi: 10.1364/oe.14.009142. [DOI] [PubMed] [Google Scholar]
- 25.Chen ZP, Milner TE, Srinivas S, Wang X, Malekafzali A, van Gemert M, Nelson JS. Optics letters. 1997;22:1119–1121. doi: 10.1364/ol.22.001119. [DOI] [PubMed] [Google Scholar]
- 26.Yazdanfar S, Rollins AM, Izatt JA. Optics letters. 2000;25:1448–1450. doi: 10.1364/ol.25.001448. [DOI] [PubMed] [Google Scholar]
- 27.Rollins AM, Yazdanfar S, Barton JK, Izatt) JA. Journal of biomedical optics. 2002;7:123–129. doi: 10.1117/1.1428291. [DOI] [PubMed] [Google Scholar]
- 28.Yazdanfar S, Kulkarni M, Izatt J. Optics express. 1997;1:424–431. doi: 10.1364/oe.1.000424. [DOI] [PubMed] [Google Scholar]
- 29.Li P, Liu A, Shi L, Yin X, Rugonyi S, Wang RK. Phys Med Biol. 2011;56:7081–7092. doi: 10.1088/0031-9155/56/22/006. [DOI] [PMC free article] [PubMed] [Google Scholar]
- 30.Kim DY, Fingler J, Werner JS, Schwartz DM, Fraser SE, Zawadski RJ. Biomedical optics express. 2011;2:1504–1513. doi: 10.1364/BOE.2.001504. [DOI] [PMC free article] [PubMed] [Google Scholar]
- 31.Dunn AK, Bolay T, Moskowitz MA, Boas DA. J Cerebr Blood F Met. 2001;21:195–201. doi: 10.1097/00004647-200103000-00002. [DOI] [PubMed] [Google Scholar]
- 32.An L, Qin J, Wang RK. Optics express. 2010;18:8220–8228. doi: 10.1364/OE.18.008220. [DOI] [PMC free article] [PubMed] [Google Scholar]
- 33.Zhang HF, Maslov K, Sivaramakrishnan M, Stoica G, Wang LHV. Appl Phys Lett. 2007;90 [Google Scholar]
- 34.Shelton RL, Applegate BE. Biomedical optics express. 2010;1:676–686. doi: 10.1364/BOE.1.000676. [DOI] [PMC free article] [PubMed] [Google Scholar]
- 35.Matthews TE, Piletic IR, Selim MA, Simpson MJ, Warren WS. Science translational medicine. 2011;3:71ra15. doi: 10.1126/scitranslmed.3001604. [DOI] [PMC free article] [PubMed] [Google Scholar]
- 36.Wierwille J, Andrews PM, Onozato ML, Jiang J, Cable A, Chen Y. Lab Invest. 2011;91:1596–1604. doi: 10.1038/labinvest.2011.112. [DOI] [PMC free article] [PubMed] [Google Scholar]
- 37.Jacob D, Shelton RL, Applegate BE. Optics express. 2010;18:12399–12410. doi: 10.1364/OE.18.012399. [DOI] [PMC free article] [PubMed] [Google Scholar]
- 38.Applegate BE, Yang C, Izatt JA. Optics Express. 2005;13(20):8146–8163. doi: 10.1364/opex.13.008146. [DOI] [PubMed] [Google Scholar]
- 39.Gonzalez-Bejar M, Montes-Navajas P, Garcia H, Scaiano JC. Langmuir. 2009;25:10490–10494. doi: 10.1021/la9011923. [DOI] [PubMed] [Google Scholar]
- 40.Barton JK, Frangineas G, Pummer H, Black JF. Photochemistry and Photobiology. 2001;73:642–650. doi: 10.1562/0031-8655(2001)073<0642:cpitpt>2.0.co;2. [DOI] [PubMed] [Google Scholar]
- 41.Black JF, Barton JK. Photochemistry and Photobiology. 2004;80:89–97. doi: 10.1562/2004-03-05-RA-102.1. [DOI] [PubMed] [Google Scholar]
- 42.Boelsterli UA. 2nd. Boca Raton: CRC Press; 2007. [Google Scholar]
- 43.Black JF, Wade N, Barton JK. Lasers in Surgery and Medicine. 2005;36:155–165. doi: 10.1002/lsm.20134. [DOI] [PubMed] [Google Scholar]
- 44.Adler DC, Huang SW, Huber R, Fujimoto JG. Optics Express. 2008;16:4376–4393. doi: 10.1364/oe.16.004376. [DOI] [PubMed] [Google Scholar]
- 45.Draijer M, Hondebrink E, van Leeuwen T, Steenbergen W. Laser Med Sci. 2009;24:639–651. doi: 10.1007/s10103-008-0626-3. [DOI] [PMC free article] [PubMed] [Google Scholar]
- 46.Stucker M, Baier V, Reuther T, Hoffman K, Kellam K, Altmeyer P. Microvasc Res. 1996;52:188–192. doi: 10.1006/mvre.1996.0054. [DOI] [PubMed] [Google Scholar]
- 47.Shchors K, Evan G. Cancer Res. 2007;67:7059–7061. doi: 10.1158/0008-5472.CAN-07-2053. [DOI] [PubMed] [Google Scholar]
- 48.Vakoc BJ, Fukumura D, Jain RK, Bouma BE. Nature reviews. Cancer. 1012;12:363–368. doi: 10.1038/nrc3235. [DOI] [PMC free article] [PubMed] [Google Scholar]


