Abstract
The success of a tissue-engineering application depends on the use of suitable biomaterials that degrade in a timely manner and induce the least immunogenicity in the host. With this purpose in mind, we have attempted to synthesize a novel nontoxic biodegradable lysine diisocyanate (LDI)-and glucose-based polymer via polymerization of highly purified LDI with glucose and its subsequent hydration to form a spongy matrix. The LDI–glucose polymer was degradable in aqueous solutions at 37, 22, and 4°C, and yielded lysine and glucose as breakdown products. The degradation products of the LDI–glucose polymer did not significantly affect the pH of the solution. The physical properties of the polymer were found to be adequate for supporting cell growth in vitro, as evidenced by the fact that rabbit bone marrow stromal cells (BMSCs) attached to the polymer matrix, remained viable on its surface, and formed multilayered confluent cultures with retention of their phenotype over a period of 2 to 4 weeks. These observations suggest that the LDI–glucose polymer and its degradation products were nontoxic in vitro. Further examination in vivo over 8 weeks revealed that subcutaneous implantation of hydrated matrix degraded in vivo three times faster than in vitro. The implanted polymer was not immunogenic and did not induce antibody responses in the host. Histological analysis of the implanted polymer showed that LDI–glucose polymer induced a minimal foreign body reaction, with formation of a capsule around the degrading polymer. The results suggest that biodegradable peptide-based polymers can be synthesized, and may potentially find their way into biomedical applications because of their biodegradability and biocompatibility.
INTRODUCTION
Urethane elastomers have been used for decades in biomedical applications because of their wide range of physical properties.1–4 However, their use has been limited to nondegradable matrices synthesized with toluene diisocyanate (TDI) as the hard segment and a variety of polyesters or polyethers as the soft segment.5,6 Nevertheless, when these polymers slowly degrade, their degradation product, 2,4-diaminotoluene, tends to be toxic in vivo. Attempts to replace TDI with aliphatic diisocyanates such as 4,4-methylenedicyclohexyl diisocyanate and hexamethylene diisocyanate have met with similar concerns of toxicity, because the diamines liberated during their degradation are still relatively toxic.7,8 Yet, except for their toxicity, urethanes possess many attributes that are ideal for biomedical applications. For example, urethane chemistry provides a wide range of synthetic options that can be varied through changing the hard segment (diisocyanate), the polyol, the chain extenders, and/or the ratios in which they are reacted. These modifications in the chemistry can be utilized to affect the mechanical and biological properties of the matrices. Attempts to replace the hard segment of urethanes to obtain nontoxic polymers have met with limited success. This was due either to the contaminants present in the hard segment preparations or to the inherent problems associated with the soft segments.9–13
In this study, we redesigned the urethane polymer to degrade to nontoxic products. Our goal is a polyurethane for biomedical applications that is biodegradable and biocompatible. Specifically, we have synthesized highly pure lysine diisocyanate (LDI) as a hard segment and polymerized it with a simple hexose (glucose) as a hydroxyl donor. The major degradation products of this polymer (LDI–glucose) are biocompatible lysine and glucose.
Thus, this peptide-based urethane polymer possesses the versatility of polyurethane, but lacks the toxicity of other known urethane degradation products.14,15 For example, by varying its functionality polymer topology can be modified, as well as its mechanical properties: it can be an elastomer, a thermoplastic, or a thermoset. Moreover, we show that LDI–glucose polymer supports growth and phenotypic characteristics of osteoblast-like cells in vitro. Furthermore, intradermal implantations of LDI–glucose for 8 weeks induce minimal foreign body reactions, suggesting usefulness in tissue-engineering and biomedical applications.
MATERIALS AND METHODS
Materials
L-Lysine ethyl ester dihydrochloride, D-glucose, hydroxyproline, N-chloro-p-toluene-sulfonamide sodium salt (chloramine-T), glutamine, a penicillin–streptomycin solution (10,000 units of penicillin and 10 μg of streptomycin per milliliter of saline; Pen/Strep), goat anti-rat IgG conjugated with biotin, and horseradish peroxidase-coupled avidin were obtained from Sigma (St. Louis, MO). Tissue culture medium RPMI 1640 was from Life Technologies (Grand Island, NY) and molecular biology reagents were from PerkinElmer (Norwalk, CT). Phosgene solution (20% in toluene) was purchased from Fluka Chemie (Buchs, Switzerland). Methylene chloride (CH2Cl2) and pyridine were distilled over calcium hydride. All other reagents used were analytical grade.
Synthesis of LDI–glucose polymer
Highly pure LDI was synthesized as previously described.16 In a typical polymer synthesis experiment, 1.8 g of D-glucose (formula weight 180, 10 mmol) was dissolved in dimethyl sulfoxide (DMSO) in a dry round-bottomed flask, flushed with nitrogen, and then fitted with a rubber septum and sealed. Subsequently, 5 mL of LDI (27 mmol) was added to the flask with a syringe. The reaction mixture was stirred in the dark at room temperature for 7 days. Subsequently, the solution was cooled in a dry ice bath and then ethyl ether was added to precipitate the polymer. The formation of urethane linkages was monitored by Fourier transform-infrared (FT-IR) spectra of the prepolymer dissolved in dichloromethane (CH2Cl2). The white solid thus obtained was dissolved in CH2Cl2 again, and the prepolymer was reprecipitated with ether. Finally, water was used to cross-link the prepolymer and generate a foam. Typically, 1 mL of water was added to 10 g of prepolymer at room temperature and stirred for 1 h. Subsequently, the polymer was then placed in a vacuum oven at room temperature overnight to enhance foaming and to dry the material. In all experiments the polymer used was synthesized with a 2.5:1 ratio of LDI to glucose, except in the polymer foam formation test, where the ratio of LDI to glucose was changed from 1:1 to 5:1.
Pore sizes of the polymer foam assay
Visualization of the polymer foam was performed by scanning electron microscopy (SEM). Polymer foam was sputter coated with gold/palladium and examined under a JEOL (Tokyo, Japan) scanning electron microscope with an accelerating voltage of 5 kV. The pore size distribution of the polymer foam was analyzed by using the public domain NIH Image program (http://rsb.info.nih.gov/nih-image).
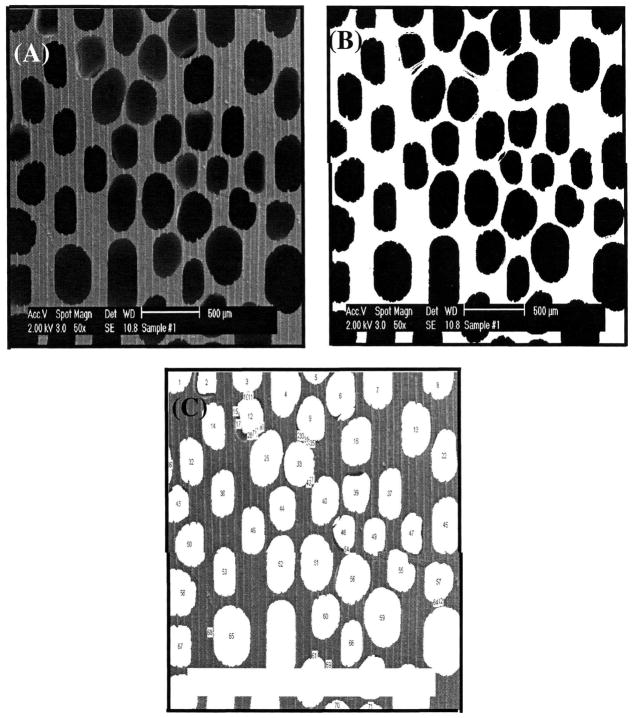
An example of such image analysis procedure is described here for a better understanding of the meaning of pore size calculated by this method. First, an area of SEM was selected for image analysis (Fig. 1A). The brightness and contrast of each SEM photograph were carefully adjusted to the same level, because the pore size measurement by image analysis software is based on the gray scale of the image. Thresholding (selecting a reasonable pore area based on gray value) was then performed as shown in Fig. 1B. Thresholding should be carefully done, because the pore diameter measured can be seriously affected by thresholding values. Therefore, the same value of thresholding was applied to all images analyzed in this study. The validity of the thresholding level was confirmed by comparing the image before and after thresholding (Fig. 1A vs. Fig. 1B), particularly by comparing the position and shape of pores in the original image with their corresponding positions and shapes in the thresholded image. If a mismatch was found between the original and thresholded images, thresholding was performed again until there was an exact match in shape, size, and location of the corresponding pores. After calibrating with a known scale, each pore was measured and labeled to determine the validity of the measurement, as shown in Fig. 1C. The diameter of a pore was obtained by averaging the major and the minor axes of the pore. The pore data were exported to Excel software for further analysis.17
FIG. 1.
Thresholding process of image analysis of LDI–glucose polymer foam. (A) Initial SEM image; (B) thresholded SEM image: (C) labeled pores of an SEM image of LDI–glucose polymer foam.
Analysis of the degradation products of LDI–glucose polymer
The polymer (10 mg/mL phosphate-buffered saline [PBS]) was incubated at 4, 22, and 37°C for 1 to 60 days. Each day 1 mL of PBS was retrieved from the samples after thorough mixing. The concentration of lysine liberated from polymer was measured spectrophotometrically at 580 nm by the ninhydrin colorimetric reaction.18 Glucose liberated due to degradation of the polymer was assessed according to the method described by Idahl et al.19 Briefly, 0.6 mL of 0.1 M Tris-HCl buffer (pH 8.0), 0.2 ml of ATP-monitoring agent (10 μg of firefly luciferase, 1.4 × 10⁻⁵ M luciferin, 10 mM magnesium acetate in 1 mL of 100 mM Tris-HCl, pH 8.0), 20 μg of glucokinase, and 0.01 mM ATP standard were mixed and measured as a blank. Subsequently, 0.2 mL of sample or glucose standard was added to the reaction mixture and luminescence was measured in a luminometer (LB 9501; EG&G Berthold, Bad Wildbad, Germany). The concentration of glucose in the polymer degradation products was calculated against a glucose standard curve. The changes in pH due to polymer degradation were assessed in parallel samples with the use of a pH meter. Mass loss was also measured with a Mettler (Anaheim, CA) A100 microbalance. This balance has a range of 0 to 100 g with an error of ±0.1 mg. Before testing, the polymer was dried in a vacuum oven at room temperature for at least 24 h until a constant weight was obtained. The mass loss was calculated by comparing the initial mass (W0) with that at a given time point (Wt), as shown in Eq. (1). Three individual experiments were performed in triplicate for the degradation test. The results are presented as means ± standard deviation (n = 3).
| (1) |
Isolation and culture of bone marrow stromal cells
Bone marrow stromal cells (BMSCs) were obtained from 8- to 10-week-old New Zealand White rabbits (Jackson Laboratory, Bar Harbor, ME). After euthanasia by intracardial injection of pentobarbital, a femur was excised aseptically, cleaned, and washed in tissue culture medium (RPMI 1640 containing 2 mM glutamine, 10% fetal calf serum, and Pen/Strep). Subsequently, its metaphyseal end was removed and the marrow flushed with 5 mL of tissue culture medium containing heparin (10 units/mL). The cells harvested were diluted in tissue culture medium, washed twice by centrifugation at 1100 × g for 10 min, and cultured in 37°C tissue culture medium containing heparin (5 units/mL).20
Culture of bone marrow stromal cells on LDI–glucose polymer
The polymer was washed five times, each time with sterile deionized water, 75% alcohol, and PBS. The polymer was left in PBS overnight at 37°C to check the sterility, and subsequently washed in tissue culture medium before use. A total of 100 μL of tissue culture medium containing 3 × 10⁵ cells (BMSCs) was placed on the matrix. The polymer containing the cells was placed in a six-well tissue culture plate and left undisturbed in an incubator for 4 h to allow the cells to adhere. Subsequently, 1 mL of tissue culture medium was gradually added to each well before placing the polymer with cells in an incubator (37°C, with 5% CO2 and 95% air). The cells were replenished with fresh tissue culture medium every 4 days.
Visualization of BMSCs on the polymer was performed by light microscopy. The polymer containing cells was fixed in 2.5% paraformaldehyde and 2% glutaraldehyde in PBS for 30 min, and stained with the Hema 3 staining system (22-12911; Fisher Scientific, Pittsburgh, PA).
Determination of collagen type I production by BMSCs grown on LDI–glucose polymer and tissue culture polystyrene plates
To examine the collagen type I synthesis by BMSCs grown on LDI–glucose polymer, the total hydroxyproline content of the tissue culture medium supernatants of the cells was assessed.16 Cells were grown either on tissue culture polystyrene (TCPS) plates or on the LDI–glucose polymer for 14 days. Subsequently, 2 mL of tissue culture medium was retrieved from each well of the cell culture plate and placed in a hydrolysis tube, and hydrolyzed with 2 mL of 6 N HCl at 100°C for 20 h. Samples were evaporated under reduced pressure to dryness, dissolved in 2 mL of water, and filtered through a syringe containing HT Tuffryn membrane (0.45 μm; Pall, East Hills, NY). A total of 0.2 mL of each sample was used to determine the concentration of hydroxyproline as described earlier.16 The concentrations of hydroxyproline were calculated against a standard curve. Three individual experiments were performed in triplicate for the hydroxyproline test. The results are presented as means ± standard deviation (n = 3).
Comparison of mRNA expression for collagen type I and transforming growth factor β1 by cells cultured on LDI–glucose polymer and tissue culture polystyrene
After culture of BMSCs on LDI–glucose polymer or TCPS, cells were washed twice with PBS for 5 min each time, and their RNA was extracted with an RNA extraction kit (Qiagen, Santa Clara, CA). A total of 0.5 μg of RNA was mixed with 1 μg of oligo(dT) (12–18 oligomer; PerkinElmer) in reverse transcription buffer and incubated for 10 min at room temperature. Thereafter, the reaction mixture was cooled on ice and incubated with 200 U of Moloney murine leukemia virus (Mo-MuLV) reverse transcriptase for 60 min at 37°C. The cDNA was amplified with 0.1 μg of each specific primer in a reaction mixture containing 200 μM dNTPs and 0.1 unit of Taq polymerase in polymerase chain reaction (PCR) buffer (PerkinElmer). PCR was performed in a DNA thermal cycler (PerkinElmer) for 30 cycles of 40 s at 94°C, 40 s at 62°C, and 60 s at 72°C.20 The sequences of sense and antisense primers used were as follows: rabbit glyceraldehyde-3-phosphate dehydrogenase (GAPDH) (293 bp; sense, 5′-TCACCATCTTCCAGGAGCGA-3′; anti-sense, 5′-CACAATGCCGAAGTGGTCGT-3′)21; rabbit transforming growth factor β1 (TGF-β1) (271 bp; sense, 5′-CGGCAGCTCTACATTGACTT-3′; antisense, 5′-AGCGCACGATCATGTTGGAC-3′)22; and rabbit collagen type I (514 bp; sense, 5′-TCAACGGTGCTCCTGGTGAAG-3′; antisense, 5′-GGACCTTGGCTACCCTGAGAA-3′).23
Biodegradability and biocompatibility of LDI–glucose polymer in vivo
Female Sprague-Dawley rats (age, 10 weeks; 175–199 g) were used to test the biodegradation and biocompatibility of LDI–glucose polymer in vivo. Rats were housed individually on a 12 h:12 h light–dark cycle and were cared for in accordance with the Guide to the Care and Use of Experimental Animals. Five-milligram (dry weight) pieces of LDI–glucose polymer were hydrated in PBS and placed subcutaneously in the abdominal area of the rats. Four pieces of polymer were positioned in four places on each rat. Five rats were killed on day 14, five on day 30, and five on day 60; tissue was then removed, fixed in 10% buffered formalin, and analyzed histologically for hypersensitivity reactions.
An aliquot of serum was also obtained on days 30 and 60 via the tail vein of rats (five rats at each time point) to examine immunoreactivity of the polymer by enzyme-linked immunoassays.24 Briefly, LDI–glucose prepolymer (10 μL) was dispensed into each well of a 96-well microtiter plate and reacted with 20 μL of H2O while evenly spreading the polymer at the bottom of the wells. The hydrated polymer was washed thoroughly with PBS and incubated in blocking buffer (1% bovine serum albumin and 5% dry milk in PBS) for 60 min. The serum dilutions, each in a total volume of 100 μL of PBS, were then added to each well and incubated overnight at 4°C. Subsequently, the wells were washed four times (10 min each) with PBS containing 0.02% Tween 20, and reacted with biotin–goat anti-rat IgG for 45 min at room temperature. The wells were washed again and reacted with peroxidase substrate [2,2′-azinobis(3-ethylbenzothiazo-line-6-sulfonic acid), 400 μg/mL in 0.1 mM citrate buffer and 0.03% H2O2] for 30 min and the optical density of solution was read at 450 nm. The data are reported as means ± SD (n = 5).
RESULTS
Synthesis of lysine diisocyanate–glucose matrix
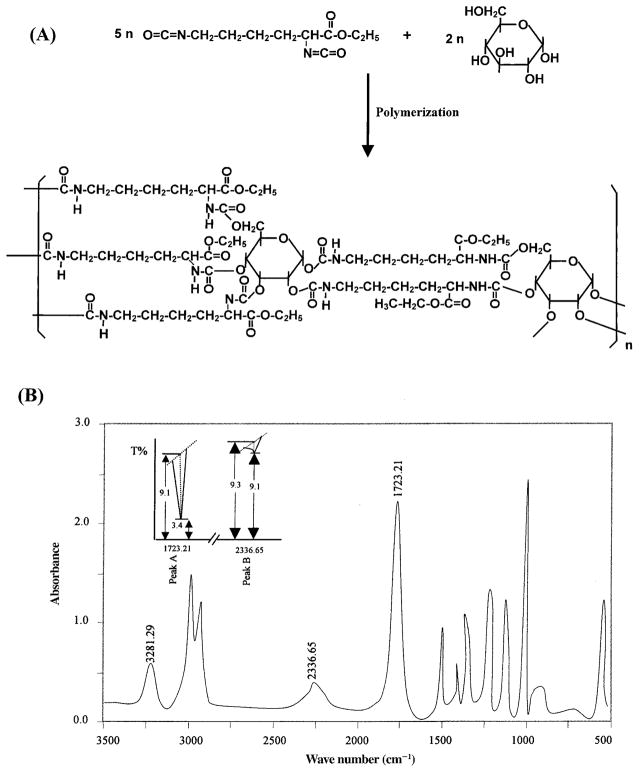
To synthesize LDI–glucose matrix we have utilized highly pure LDI prepared from lysine ethyl ester as described earlier.16 The synthesis of LDI in high yields and high purity was critical for the production of peptide-based prepolymers needed for tissue-engineering applications. As shown in Fig. 2A, LDI reacted with glucose to form a tightly cross-linked network via the formation of urethane linkages. The confirmation of prepolymer synthesis by IR spectroscopy exhibited that 97.83% LDI cross-linked with glucose. This is demonstrated by the strong absorption band at approximately 1723.21 cm−1 attributed to the formation of the –NHCOO– group with the concomitant quantitative disappearance of the –N=C=O group at 2336.65 cm−1 during the reaction (Fig. 2B). The intensities of the peaks at 1723.21 and 2336.65 cm−1 indicated that only 2.17% free isocyanate remained in the reaction mixture (Fig. 2B, inset), that is, the absorption of polymer peak A (–NHCOO–) = log 9.1/3.4 = 0.4275; whereas that of isocyanate peak B (–N=C=O) = log 9.3/9.1 = 0.0095. If the content of the polymer is called C1, and that of free isocyanate is called C2, then C1/C2 = 0.4275/0.0095 = 45; in the reaction mixture, C1 + C2 = 1, thus, C1 = 97.83% and C2 = 2.17%.
FIG. 2.
(A) Schematic representation of the synthesis of LDI–glucose polymer. (B) IR spectra of LDI–glucose polymer showing the formation of urea linkages at 1723.21 cm−1 and concomitant disappearance of isocyanate at 2336.65 cm−1. Inset: Rate of LDI–glucose polymerization.
Pore sizes of the polymer foam distribution
The addition of water to the LDI–glucose prepolymer results in the formation of a foamed polymer, forming cross-link points during the process. The water reacts with the terminal isocyanate group of the polymer to form an unstable carbamic acid, which then decomposes to an amine, and the carbon dioxide gas liberated generates the foam. The amine group then reacts with an isocyanate group to form a urea linkage. Scanning electron microscope evaluation showed that some cavities existed in the surface topology of the foam (Fig. 3A) from the polymer with an LDI:glucose ratio of 5:1 (–NCO/–OH = 2). However, cavity formation was effectively eliminated by an adequate LDI:glucose ratio. Figure 3B shows that the surface of polymer foam made at an LDI:glucose ratio of 2.5:1 (–NCO/–OH = 1) was smooth and pore sizes were homogeneous. A cross-sectional view exhibited spongelike cavities formed by the liberation of CO2 during the foaming or polymerization process (Fig. 3C). Cell culture showed that this sponge-like texture in the matrix was critical in providing a large surface area to support cell growth. The synthesis of prepolymer at an LDI:glucose ratio of 2.5:1 resulted in pliable foam with pore sizes between 125 and 500 μm in diameter (Fig. 3C). On the other hand, polymer synthesis with an LDI:glucose stoichiometry of 1:1 (–NCO/–OH = 0.4) resulted in hard coralline hydroxyapatite-like foam (Fig. 3D), because the isocyanate-terminated prepolymer was too little to form good foam when water was added.
FIG. 3.
Morphology of LDI–glucose polymer. (A) A view of the surface of LDI–glucose polymer made at an LDI:glucose ratio of 5:1. Some cavities existed in the surface topology of the foam and interconnected spaces were observed in the matrix. (B) A smooth surface with homogeneous pore sizes was presented by LDI–glucose polymer foam made at an LDI:glucose ratio of 2.5:1. (C) Cross-sectional micrograph of LDI–glucose polymer foam (LDI:glucose, 2.5:1) exhibiting a spongy internal structure with pores interconnected to support fluid flow. (D) Hard coralline hydroxyapatite-like foam was obtained by the synthesis of polymer at an LDI:glucose ratio of 1:1.
Biodegradability of LDI–glucose matrix
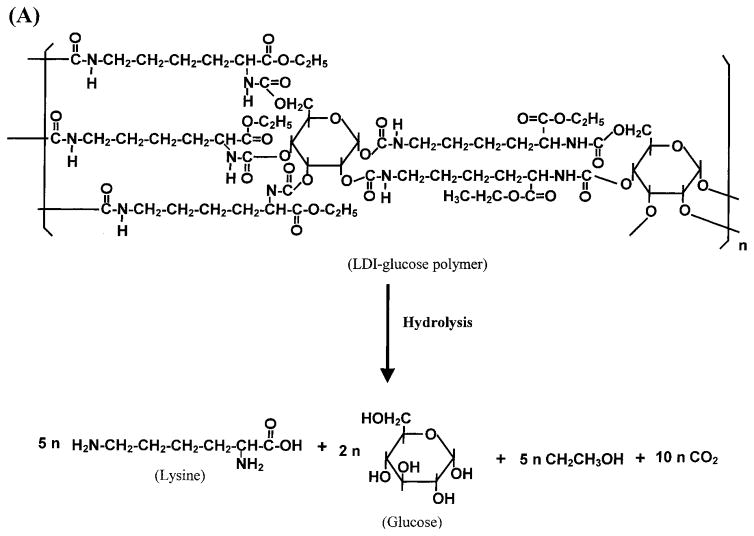
Tissue-engineering applications often require a degradable matrix. The degradation products must be nontoxic. Therefore, we examined the degradation products of the LDI–glucose polymer. Because this polymer comprises only lysine and glucose, the hydrolysis or urethane bonds resulted in the liberation of lysine and glucose (Fig. 4A). As expected, the LDI–glucose polymer degraded into lysine and glucose at all temperatures tested (Fig. 4B and C). Furthermore, after hydrolysis of urethane bonds, the calculated ratios of matrix showed that the degradation products of polymer were mainly glucose (2 mol) and LDI (5 mol) (Fig. 4D). These results further suggest that during the primary reaction an isocyanate group of LDI reacted with a hydroxy group of glucose. In these experiments the degradation rates were measured under slow agitation (two rotations per minute) to mimic physiological conditions.
FIG. 4.
Degradation of LDI–glucose polymer in aqueous solution. (A) Schematic representation of LDI–glucose matrix degradation into lysine, glucose, ethanol, and CO2. (B) Liberation of lysine during degradation of LDI–glucose polymer in PBS over a period of 60 days. LDI–glucose polymer (10 mg/mL PBS) was incubated at 37, 22, and 4°C, and 1 mL of sample was retrieved every 24 h to examine the release of lysine by ninhydrin reagent. (C) Liberation of glucose during LDI–glucose polymer degradation in PBS at 37°C over a period of 60 days. (D) Comparative assessment of lysine (open column) and glucose (hatched columns) release from LDI–glucose polymer at different temperatures and time intervals. The results are expressed as means ± SD (n = 3).
Examination of the degradation rate of LDI–glucose matrix in vitro showed that this polymer degraded in a linear fashion over a period of 60 days. Mass loss measurement showed that about 67.7% of the polymer degraded at 37°C in 60 days. The degradation rate was slightly lower at 22°C, whereas at 4°C the degradation of polymer was only 1% over a period of 60 days.
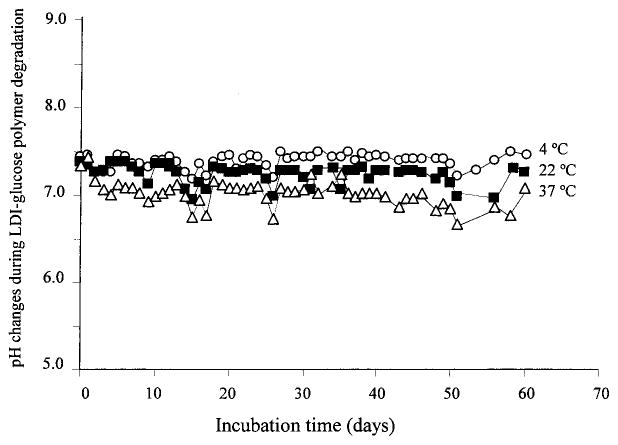
Polylactide and polyglycolide degradation products may produce an acidic environment in vivo.9–13 To examine whether the breakdown products of the LDI–glucose polymer decrease the pH of the surrounding solution, we measured over a period of 60 days the pH of the PBS containing polymer at 10 mg/mL. We selected PBS as the medium because its buffering capacity resembles that of biological fluids. The degradation products of LDI–glucose polymer did not affect the pH of PBS significantly at any temperature tested, that is, 37, 22, or 4°C (Fig. 5).
FIG. 5.
Effect of LDI–glucose degradation products on the pH of PBS over a period of 60 days. The samples were treated identically, as described in Materials and Methods, and the pH was measured every 24 h.
Cell growth on LDI–glucose matrix in vitro
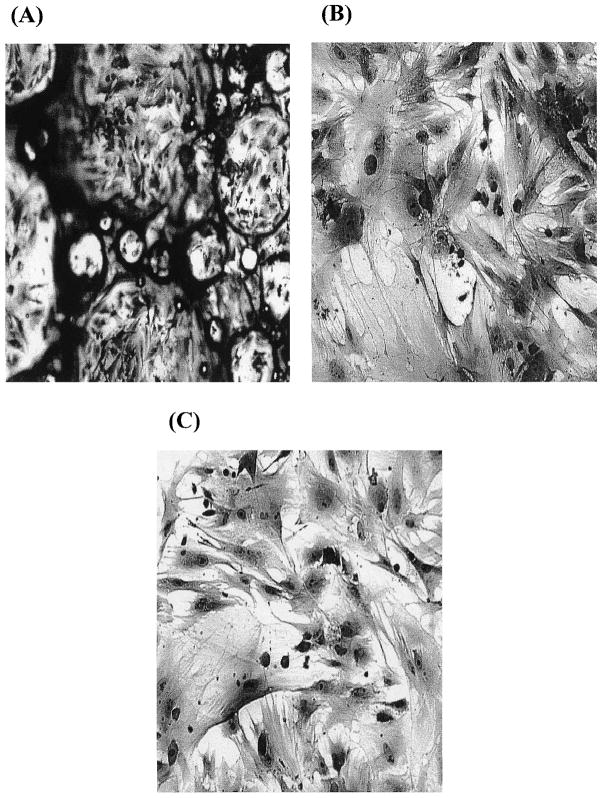
To examine the ability of the LDI–glucose polymer to support cell growth, BMSCs cultured in vitro were seeded on an LDI–glucose polymer matrix for selected time intervals. Micrographs were taken to examine the progressive growth and retention of phenotypic characteristics of the cells. A monolayer of cells formed on the surface and in the pores of the test polymer, with many cells undergoing cell division (Fig. 6A and B), similar to those observed on TCPS (Fig. 6C). BMSCs formed multiple layers of confluent cells in the pores of polymer foam with three dimensions (Fig. 6A) and in the pores of polymer film with two dimensions (Fig. 6B). In addition to the morphology of cells on the polymer, the proliferation rate of cells grown on the polymer was similar to that of cells grown on TCPS, suggesting that the polymer and its degradation products were not toxic.
FIG. 6.
Growth of BMSCs on LDI–glucose polymer foam (A), on LDI–glucose polymer thin film (B), or on TCPS (C), showing monolayers of BMSCs growing on the surface of air pockets in the foam at 2 weeks. The cells were stained with the Hema 3 staining system. Original magnification: (A) ×10; (B) ×20; (C) ×20.
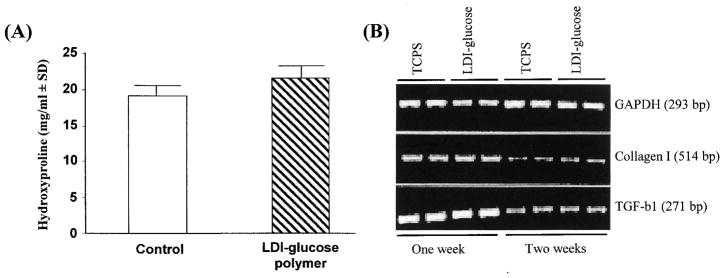
Collagens are the only proteins that contain hydroxyproline. Therefore, the hydroxyproline content of a cell culture provides an accurate measure of collagen synthesis. BMSCs produce copious amounts of hydroxyproline-rich type I procollagen.25,26 To compare the synthetic characteristics of BMSCs grown on the polymer with those of BMSCs cultured on tissue culture polystyrene (TCPS), we determined the hydroxyproline content of the culture medium after a 10-day period of cell growth. As shown in Fig. 7A, a significant difference between the hydroxyproline contents of soluble procollagen synthesized by cells grown on the polymer and by cells grown on TCPS was not observed. These results suggest that BMSCs synthesize and secrete procollagen that is not altered by the LDI–glucose polymer.
FIG. 7.
Phenotypic characteristics of BMSCs grown on LDI–glucose polymer or TCPS. (A) Hydroxyproline content of collagen type I synthesized by cells grown on polymer or on TCPS for 2 weeks. The experiment was performed as described in Materials and Methods. The results are presented as means ± standard deviation (n = 3). (B) Comparative assessment of collagen type I and TGF-β1 mRNA expression in cells grown on LDI–glucose polymer or TCPS for 7 or 14 days. The cells were seeded at equal density (0.2 × 10⁶ cells/well) on polymer or TCPS, and grown under identical conditions. After incubation, cells were trypsinized and mRNA was extracted for analysis by RT-PCR. Expression of mRNA for glyceraldehyde-3-phosphate dehydrogenase (GAPDH), a housekeeping gene, was used as a control to show equivalent input of RNA in all lanes. The results shown were obtained from one of three individual experiments.
BMSCs grown on LDI–glucose polymer or TCPS expressed equivalent concentrations of mRNA for collagen type I, and for TGF-β1, per microgram of total RNA, as assessed by RT-PCR (Fig. 7B).
Examination of foreign body responses induced by LDI–glucose in vivo
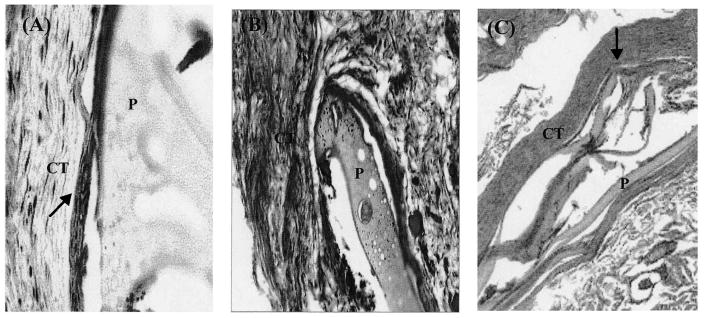
The biocompatibility of the polymer in vivo was examined by subdermal implantation of LDI–glucose polymer. A total of five rats per group were implanted with polymer (5.0 mg, dry weight) at four different sites. Thereafter, an implantation site was excised from each rat after 15, 30, and 60 days for histological examination. The cross-sections of the tissue 15 days postimplantation revealed the formation of granulation tissue and a capsule (a few cells thick) around the LDI–glucose matrix. The surrounding tissue was vascularized, with no signs of necrosis (Fig. 8A). We did not observe giant cell formation around the LDI–glucose matrix (Fig. 8B). A three- to five-cell-thick capsule was observed to form around the LDI–glucose matrix. Histological examination of the LDI–glucose polymer 60 days postimplantation showed that of five implanted sites, three sites were devoid of any remains of polymer. However, two sites showed approximately 10% of the polymer remaining at the site of implantation. We observed neither an increase in capsule formation around the matrix nor an accumulation of foreign body giant cells (Fig. 8C). It is also significant to note that no tissue necrosis was observed at any implanted site around the LDI–glucose polymer.
FIG. 8.
A histologic examination of foreign body reactions induced by LDI–glucose polymer. Cross-section of tissue after (A) 15 days, (B) 30 days, or (C) 60 days of LDI–glucose polymer implantation, showing only three- to five-layer-thick capsule formation as shown by arrows. The cross-section in (C) shows more than 90% polymer degradation. The sections were from one of five different implanted sites at each time point. CT, Connective tissue; P, polymer. Original magnification: (A) ×20; (B) ×40; (C) ×40.
To assess immunogenicity, all rats were bled 4 and 8 weeks postimplantation of the LDI–glucose polymer. Examination for the presence of anti-polymer antibodies in the serum by enzyme-linked immunoassay did not indicate the presence of antibodies recognizing the LDI–glucose polymer in any of the serum samples (dilutions from 1:10 to 1:640 in PBS) (Fig. 9). This suggests that the polymer was not antigenic in vivo and did not induce antibody formation.
FIG. 9.
Assessment of anti-LDI–glucose antibodies in the sera of rats implanted with LDI–glucose polymer. Rats implanted with LDI–glucose polymer were bled via the tail vein after 4 and 8 weeks and the presence of antibodies was examined by enzyme-linked immunoassays. Prebleed from rats on day 0 was used as a negative control. Data represent the reactivity of sera obtained from five different rats. Mean values and the standard error of the means were within 5% at each antibody dilution.
DISCUSSION
This study represents an important step toward the development of a novel biomaterial for tissue engineering and other biomedical applications. We have shown that LDI and glucose prepolymer can be synthesized in the absence of catalysts. This prepolymer can react with water to produce a biodegradable foamy matrix. To ensure high purity and mitigate against immunoreactivity, we have utilized the lysine ethyl ester to synthesize LDI (>96% yield). Furthermore, we have used glucose as a hydroxyl donor to synthesize the polymers. The three-dimensional structure of LDI–glucose polymer is foam-like. The LDI–glucose polymer provides the advantage of varying the hardness of matrix by changing the relative stoichiometry of LDI and glucose. The reaction ratio of the LDI and glucose had a significant effect on the mechanical strength and pore sizes of the polymer. There are two functional groups (isocyanate) in one molecule of LDI, and five functional groups (hydroxy) in one molecule of glucose. The primary reaction for polyurethane synthesis is the reaction of the isocyanate group with a hydroxy-terminated molecule. The isocyanate group is able to react with the newly formed functional groups in the polymer if the isocyanate is present in excess concentration.
In LDI–glucose polymer synthesis, the more residual isocyanate group remaining in the prepolymer, the more urea linkage was produced with a commensurate increase in carbon dioxide gas produced. Under these reaction conditions, a hard polymer foam with a cross-linked structure and large pore sizes was obtained. For example, prepolymer made at an LDI:glucose ratio of 5:1 provided a hard foam due to tight cross-links, and more carbon dioxide gas was released when reacted with water. A 2.5:1 stoichiometry, on the other hand, provided a softer and pliable matrix due to cross-links formed between LDI and glucose molecules. Because of the liberation of CO2 during polymerization, both hard and soft foams of LDI–glucose polymer exhibited interconnected pores ranging in size between 20 and 1000 μm in diameter, sufficient to provide spaces for cell growth and vascularization.
A desirable feature of biomaterials for tissue engineering is controlled biodegradation. The LDI–glucose polymer degraded linearly at body temperature and at a slower rate at 22°C. Degradation at 4°C was negligible. The degradation products are lysine and glucose, which are physiological. The relative concentrations of lysine and glucose generated during degradation suggest that the degradation of polymer occurred by hydrolysis and was associated with CO2 and ethanol formation. We did not observe pH changes in the medium during the polymer degradation. It appears that CO2 liberation during degradation is not sufficient to change the surrounding pH. However, changes in pH in the microenvironment around the polymer due to the liberation of CO2 remain a possibility. In this respect, LDI–glucose polymer appears to be similar to LDI–glycerol polymer described in a previous publication.16
A matrix adequate for tissue-engineered grafts should have properties that support cell growth and replication.27 Therefore, we examined whether LDI–glucose polymer supports cell growth in vitro. LDI–glucose polymer allowed cell attachment and growth of BMSCs as well as supported collagen type I synthesis and the expression of mRNA for TGF-β1 and collagen type I at rates similar to those of cells grown on TCPS. Taken together, the nontoxic degradation products and ability to support the proliferation and differentiation of osteoblast precursor cells favored in vivo testing of LDI–glucose polymer.
Examination of the tissue reactivity of LDI–glucose polymer in vivo has shown that it did not induce necrosis of the surrounding tissue over a period of 8 weeks. After resolution of granulation tissue, the LDI–glucose polymer appeared to induce capsule formation 1 month postimplantation, but not significant foreign body giant cell formation. Furthermore, following 8 weeks of implantation and polymer degradation, the capsule around the polymer was significantly reduced.
Another important desirable property of biomaterials is their ability to degrade in vivo. Our experiments in vivo have suggested that LDI polymer degrades faster in vivo (>95% in 60 days) as compared with in vitro (67% in 60 days at 37°C). It has been shown that biodegradable polyurethanes synthesized with polylactide or polyglycolide and ε-caprolactone joined by lysine-diisocyanates degrade twice as rapidly in vivo compared with the degradation in vitro.28 Because glucose is a smaller molecule than polylactide, it is not surprising that, compared with degradation in vitro, the LDI–glucose polymer degraded more than three times faster in the presence of circulating body fluids and physiologically active cells.
To date, a number of materials have been synthesized and examined as a scaffolding matrix for tissue-engineered grafts.29–33 However, they have not been entirely successful because of their limited range of physical properties and their tendency either to degrade into toxic products or to cause adverse tissue reactions.9–13 Our results demonstrate that the LDI–glucose polymer possesses many attributes that are potentially useful in tissue-engineering and other biomedical applications. This is evident by the fact that LDI synthesized from lysine ethyl ester dihydrochloride is of high purity and can be obtained in high yields to minimize the presence of polymer contaminants. LDI polymerized with glucose yields a matrix that can be foamed in aqueous solutions for use as scaffolds for cell growth. LDI–glucose polymer foam is biodegradable and its degradation products are nontoxic and do not alter the pH of PBS. LDI–glucose foam exhibits physical properties that are suitable for cell growth in vitro. The LDI–glucose polymer is nonimmunogenic and induces minimal foreign body reactions in the form of capsule formation in vivo. Collectively, these studies suggest further testing of LDI–glucose polymer for tissue-engineering applications.
Acknowledgments
The authors are indebted to Mr. Eric Krauland and Scott Beaver for technical assistance. This work was supported by grants provided by the Pittsburgh Tissue Engineering Initiative and Central Medical Research Funds, University of Pittsburgh.
References
- 1.Zdrahala RJ, Zdrahala IJ. Biomedical applications of polyurethanes: A review of past promises, present realities, and a vibrant future. J Biomater Appl. 1999;14:67. doi: 10.1177/088532829901400104. [DOI] [PubMed] [Google Scholar]
- 2.Szycher NM, Reed AM. Biostable polyurethane elastomers. Med Device Technol. 1992;3:42. [PubMed] [Google Scholar]
- 3.Braatz JA. Biocompatible polyurethane-based hydrogel. J Biomater Appl. 1994;9:71. doi: 10.1177/088532829400900104. [DOI] [PubMed] [Google Scholar]
- 4.Mowery KA, Schoenfisch MH, Saavedra JE, Keefer LK, Meyerhoff ME. Preparation and characterization of hydrophobic polymeric films that are thromboresistant via nitric oxide release. Biomaterials. 2000;21:9. doi: 10.1016/s0142-9612(99)00127-1. [DOI] [PubMed] [Google Scholar]
- 5.Saad B, Hirt TD, Welti M, Uhlschmid GK, Neuenschwander P, Suter UW. Development of degradable polyesterurethanes for medical applications: In vitro and in vivo evaluations. J Biomed Mater Res. 1997;36:65. doi: 10.1002/(sici)1097-4636(199707)36:1<65::aid-jbm8>3.0.co;2-j. [DOI] [PubMed] [Google Scholar]
- 6.Wang GB, Labow RS, Santerre JP. Biodegradation of a poly(ester)urea-urethane by cholesterol esterase: Isolation and identification of principal biodegradation products. J Biomed Mater Res. 1997;36:407. doi: 10.1002/(sici)1097-4636(19970905)36:3<407::aid-jbm16>3.0.co;2-a. [DOI] [PubMed] [Google Scholar]
- 7.Gogolewski S. Biomedical polyurethanes. In: Arshady R, editor. Desk References of Functional Polymers. Washington, D.C: American Chemical Society; 1997. p. 1. [Google Scholar]
- 8.Planck H, Syre I, Danner M, Egbers G. Polyurethanes in Biomedical Engineering II. New York: Elsevier; 1987. p. 1. [Google Scholar]
- 9.Anderson JM. Biomedical Applications of Synthetic Biodegradable Polymers. Boca Raton, FL: CRC Press; 1995. Perspectives on the in vivo responses of biodegradable polymers; p. 223. [Google Scholar]
- 10.Athanasiou KA, Niedetauer EG, Agrawal CM. Sterilization, toxicity, biocompatibility and clinical application of polylactic acid/polyglycolic acid co-polymer. Biomaterials. 1996;17:93. doi: 10.1016/0142-9612(96)85754-1. [DOI] [PubMed] [Google Scholar]
- 11.Bostman OM. Osteolytic changes accompanying degradation of absorbable fracture fixation implants. J Bone Joint Surg. 1991;73B:679. doi: 10.1302/0301-620X.73B4.1649195. [DOI] [PubMed] [Google Scholar]
- 12.Bostman O, Hirvensalo E, Makinen J, Rokkanen P. Foreign-body reactions to fracture fixation implants of biodegradable synthetic polymers. J Bone Joint Surg. 1990;72:592. doi: 10.1302/0301-620X.72B4.2199452. [DOI] [PubMed] [Google Scholar]
- 13.Penco M, Marcioni S, Ferruti P, Dí Antone S, Deghenghi R. Degradation behaviour of block copolymers containing poly(lactic-glycolic acid) and poly(ethylene glycol) segments. Biomaterials. 1996;17:1583. doi: 10.1016/0142-9612(95)00323-1. [DOI] [PubMed] [Google Scholar]
- 14.Taylor MS, Daniels AU, Andriano KP, Heller J. Six bioabsorbable polymers: In vitro acute toxicity of accumulated degradation products. J Appl Biomater. 1994;5:151. doi: 10.1002/jab.770050208. [DOI] [PubMed] [Google Scholar]
- 15.van Och FM, Slob W, de Jong WH, Vandebriel RJ, van Loveren H. A quantitative method for assessing the sensitizing potency of low molecular weight chemicals using a local lymph node assay: Employment of a regression method that includes determination of uncertainty margins. Toxicology. 2000;146:49. doi: 10.1016/s0300-483x(00)00165-7. [DOI] [PubMed] [Google Scholar]
- 16.Zhang J, Beckman EJ, Piesco NP, Agarwal S. A new peptide-based urethane polymer: Synthesis, biodegradation, and potential to support cell growth in vitro. Biomaterials. 2000;21:1247. doi: 10.1016/s0142-9612(00)00005-3. [DOI] [PMC free article] [PubMed] [Google Scholar]
- 17.Kim SH, Chu CC. Pore structure analysis of swollen dextranmethacrylate hydrogels by SEM and mercury intrusion porosimetry. J Biomed Mater Res. 2000;53:258. doi: 10.1002/(sici)1097-4636(2000)53:3<258::aid-jbm11>3.0.co;2-o. [DOI] [PubMed] [Google Scholar]
- 18.Beckwith AC, Paulis JW, Wall JS. Direct estimation of lysine in corn meals by the nihydrin color reaction. J Agric Food Chem. 1975;23:194. doi: 10.1021/jf60198a015. [DOI] [PubMed] [Google Scholar]
- 19.Idahl LA, Sandstrom PE, Sehlin J. Measurements of serum glucose using the luciferin/luciferase system and liquid scintillation spectrometer. Anal Biochem. 1986;155:177. doi: 10.1016/0003-2697(86)90243-5. [DOI] [PubMed] [Google Scholar]
- 20.Agarwal S, Chandra CS, Piesco NP, Langkamp HH, Bowen L, Beran C. Regulation of periodontal ligament cell functions by interleukin-1β. Infect Immun. 1998;66:932. doi: 10.1128/iai.66.3.932-937.1998. [DOI] [PMC free article] [PubMed] [Google Scholar]
- 21.Gassner R, Buckley MJ, Georgescu H, Studer R, Stefanvich-Racic M, Piesco NP, Evans CH, Agarwal S. Cyclic tensile stress exerts anti-inflammatory actions on chondrocytes by inhibiting inducible nitric oxide synthase. J Immunol. 1999;163:2187. [PMC free article] [PubMed] [Google Scholar]
- 22.Zhuang H, Wang W, Tahernia AD, Levitz CL, Luchetti WT, Brighton CT. Mechanical strain-induced proliferation of osteoblastic cells parallels increased TGF-β1 mRNA. Biochem Biophys Res Commun. 1996;229:449. doi: 10.1006/bbrc.1996.1824. [DOI] [PubMed] [Google Scholar]
- 23.Hart DA, Sciore P, Boykiw R, Reno C. Pregnancy induces complex changes in the pattern of mRNA expression in knee ligaments of the adolescent rabbit. Matrix Biol. 1998;17:21. doi: 10.1016/s0945-053x(98)90122-6. [DOI] [PubMed] [Google Scholar]
- 24.Mace SR, Sussman GL, Liss G, Stark DF, Beezhold D, Thompson R, Kelly K. Latex allergy in operating room nurses. Ann Allergy Asthma Immunol. 1998;80:252. doi: 10.1016/S1081-1206(10)62966-3. [DOI] [PubMed] [Google Scholar]
- 25.Schwartz CE, Hellerqvist CG, Cunningham LW. Attaching human fibroblasts secrete a type I procollagen rich in 3-hydroxyproline. Biochem Biophys Res Commun. 1979;90:240. doi: 10.1016/0006-291x(79)91616-4. [DOI] [PubMed] [Google Scholar]
- 26.Martinez ME, Medina S, del Campo MT, Sanchez-Cabezudo MJ, Sanchez M, Munuera L. Effect of polyethylene on osteocalcin, alkaline phosphatase and pro-collagen secretion by human osteoblastic cells. Calcif Tissue Int. 1998;62:453. doi: 10.1007/s002239900459. [DOI] [PubMed] [Google Scholar]
- 27.Yaszemski MJ, Payne RG, Hayes WC, Langer R, Mikos AG. Evolution of bone transplantation: Molecular, cellular and tissue strategies to engineer human bone. Biomaterials. 1996;17:175. doi: 10.1016/0142-9612(96)85762-0. [DOI] [PubMed] [Google Scholar]
- 28.Bruin P, Veenstra GJ, Nijenhuis AJ, Pennings AJ. Design and synthesis of biodegradable poly(ester-urethane) elastomer networks composed of non-toxic building blocks. Makromol Chem. 1988;9:589. [Google Scholar]
- 29.Vacanti CA, Upton J. Tissue-engineered morphogenesis of cartilage and bone by means of cell transplantation using synthetic biodegradable polymer matrices. Clin Plast Surg. 1994;21:445. [PubMed] [Google Scholar]
- 30.Ignatius AA, Claea LE. In vitro biocompatibility of bioresorbable polymers: Poly(L-, DL-lactide) and poly(L-lactide-co-glycolide) Biomaterials. 1996;17:831. doi: 10.1016/0142-9612(96)81421-9. [DOI] [PubMed] [Google Scholar]
- 31.Mikos AG, Sarakinos G, Leite SM, Vacanti JP, Langer R. Laminated three-dimensional biodegradable foams for use in tissue engineering. Biomaterials. 1993;14:323. doi: 10.1016/0142-9612(93)90049-8. [DOI] [PubMed] [Google Scholar]
- 32.Mikos AG, Bao Y, Cima LG, Ingber DE, Vacanti JP, Langer R. Preparation of poly(glycolic acid) boned fiber structures for cell attachment and transplantation. J Biomed Mater Res. 1993;27:183. doi: 10.1002/jbm.820270207. [DOI] [PubMed] [Google Scholar]
- 33.Mooney DJ, Mazzoni CL, Breuer C, McNamara K, Herm D, Vacanti JP, Langer R. Stabilized polyglycolic acid fibre-based tubes for tissue engineering. Biomaterials. 1996;17:115. doi: 10.1016/0142-9612(96)85756-5. [DOI] [PubMed] [Google Scholar]


