Abstract
Hydrogen peroxide (H2O2) is known as a key molecule in a variety of biological processes, as well as a crucial byproduct in many enzymatic reactions. Therefore, being able to selectively and sensitively detect H2O2 is not only important in monitoring, estimating and decoding H2O2 relevant physiological pathways, but also very helpful in developing enzymatic-based biosensors towards other analytes of interest. Herein, we report a plasmonic probe for H2O2 based on 3-mercaptophenylboronic acid (3-MPBA) modified gold nanoparticles (AuNPs) which is coupled with surface-enhanced Raman scattering (SERS) to yield a limit of detection (LOD) of 70 nM. Our probe quantifies both exogenous and endogenous H2O2 levels in living cells and can further be coupled with glucose oxidase (GOx) to achieve quantitative and selective detection of glucose in artificial urine and human serum.
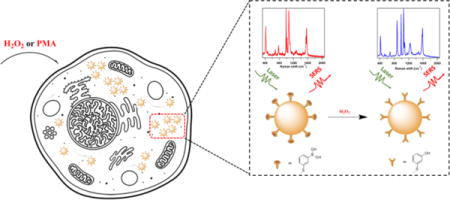
TOC image
INTRODUCTION
Hydrogen peroxide (H2O2) plays essential roles in a diverse range of biological processes including cell signaling, host defense, protein folding, biosynthesis and respiration.1–3 Misregulation of H2O2 is often associated with oxidative stress that causes aging4 and diseases such as chronic inflammation,5 diabetes,6 Alzheimer’s,7 and cancer8. Aside from its beneficial and detrimental effects in physiological processes, H2O2 is also an important product from a number of enzymatic reactions involving oxidases. For example, the oxidation of glucose by glucose oxidase (GOx) and the oxidation of cholesterol by cholesterol oxidase (ChOx) both yield H2O2,9–12 which makes H2O2 an important intermediate to follow in biochemical processes. Despite the significant interest in H2O2 imaging and detection in biological samples, currently, only two detection schemes can monitor H2O2 in vivo and in vitro: (1) fluorescent probes are the most common, however, they rely on complicated probe synthesis and suffer from photo bleaching;13–15 (2) quantum dots, while having improved photo stability, are hindered by their toxicity in biological samples.16–18
Instead, surface-enhanced Raman spectroscopy (SERS)19,20 is an extremely sensitive technique21–23 and shows excellent photo stability and biocompatibility when using Au nanoparticles (AuNPs) as the plasmonic substrate.24–27 Moreover, SERS probes are commercially available or obtained from simple synthesis, thus avoiding the complicated and expensive design and synthesis of traditional fluorescence probes. Unfortunately, direct detection of H2O2 remains a challenge to SERS-based schemes due to the intrinsically small Raman cross section of the molecule. Till now, the only SERS-based H2O2 detection methods reported depend on nonspecific oxidation of the probe molecules or SERS substrates made from Ag.28,29 These methods suffer interferences from other reactive oxygen species (ROS) and reactive nitrogen species (RNS). Additionally, the oxidation of Ag nanoparticles yields the highly toxic Ag+ and is not suitable for sensing H2O2 in vivo.
Interestingly, boronate molecules are known to react selectively and efficiently with H2O2 to yield its corresponding phenol form.13,30–32 Inspired by this idea, herein, we conceive a SERS-based strategy (Figure 1) for the selective detection of H2O2 by modifying the AuNPs with 3-mercaptophenylboronic acid (3-MPBA). In the presence of H2O2, 3-MPBA is oxidized into 3-hydroxythiophenol (3-HTP), which results in an easily monitored change in the SERS spectra of our boronate nanoprobe. By analyzing these changes, we are able to quantify H2O2 with both selectivity and sensitivity. Importantly, we illustrate the success of detecting exogenous and endogenous H2O2 in the living colon cancer (SW620) cells.
Figure 1.
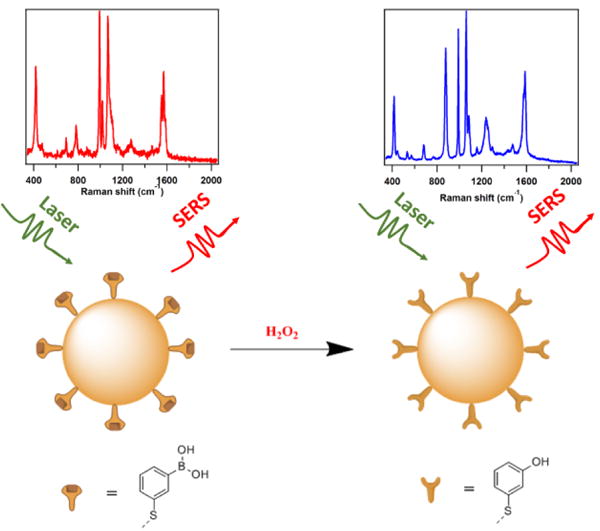
SERS-based scheme for detecting H2O2 by the boronate nanoprobe. H2O2 selectively oxidizes 3-MPBA to 3-HTP which yielding easily distinguished changes in the SERS spectra.
Advantageously, when H2O2 producing oxidase enzymes are coupled with our boronate plasmonic nanoprobe, the method can be easily expanded to the detection of biological relevant molecules. In this article, glucose, as an example, is detected by our GOx coupled boronate nanoprobe in artificial urine and normal human serum.
EXPERIMENTAL SECTION
Materials and Reagents
3-mercaptophenylboronic acid (3-MPBA) (≥95%), 3-hydroxythiophenol (3-HTP) (≥96%), D-(+)-glucose (≥99.5% GC grade), D-(−)-fructose (≥99%), L-glutamine (≥99%), phorbol 12-myristate 13-acetate (PMA) (≥99%) and sodium hypochlorite (5% w/w) are purchased from Sigma-Aldrich. D-(+)-galactose (≥98%), D-(+)-mannose (≥99%), urea (≥99%), sodium bromide (≥99%), sodium nitroprusside (≥98%), hydrogen peroxide (35% w/w), tert-butyl hydroperoxide (TBHP) (70% w/w), calcium sulfate dehydrate (≥98%) and sodium dihydrogen phosphate (≥98%) are purchased from Alfa Aesar. D-(+)-sucrose (≥99%), creatinine (≥99%) is purchased from TCI. Glucose oxidase from aspergillus and sodium chloride (≥99%) are purchased from VWR. Iron (II) chloride tetrahydrate (≥99%) is purchased from JT Baker. Magnesium sulfate (≥98%) is purchased from EMD Millipore. Potassium chloride (≥99%) is purchased from Acros Organics. Ultrapure water is obtained from a Millipore water system. Citrate-capped gold nanoparticles (60 nm, 5.2×10⁻¹¹ M) are purchased from Nanopartz. Normal human serum is purchased from UTAK Laboratories. Artificial urine is made from 55 mM sodium chloride, 67 mM potassium chloride, 2.6 mM calcium sulfate, 29.6 mM sodium sulfate, 3.2 mM magnesium sulfate, 19.8 mM sodium dihydrogen phosphate, 9.8 mM creatinine and 310 mM urea.
Fabrication of Boronate Nanoprobe
20 μL of freshly prepared 1.5 mM 3-MPBA solution is added into 10 mL AuNPs and the mixture is stirred for 3 h. The excess 3-MPBA is removed by centrifugation (3500 rpm for 5 min) and resuspension in ultrapure water 3 times. The modified AuNP solution is stored at 4 °C before use. The Nanoprobe is further characterized by SEM and UV-vis (Figure S1, S2).
SERS Spectra
SERS spectra for non-cell samples are measured using a homebuilt Raman spectrometer employing a 785 nm diode laser (Spectra Physics, Newport) for 1 s exposure time and 10 acquisitions. The laser beam (500 μW, measured at the sample) is focused onto aggregated Au colloids (aggregated by 1 M NaBr) using an inverted microscope objective (Nikon 20X, NA=0.5). The scattered light is collected by the same objective and, after passing through a Rayleigh rejection filter (Semrock), was dispersed in a spectrometer (PI Acton Research, f = 0.3 m, grating = 600 g/mm). Light is detected with a back-illuminated deep-depletion CCD (PIXIS, Spec-10, Princeton Instruments). Winspec 32 software (Princeton Instruments) is used to operate the spectrometer and CCD camera. Each spectrum for the same condition is recorded 7 times using 7 different spots of the aggregated AuNPs in the solution from 3 replicate samples.
SERS spectra for cell samples use the same set-up with the exception of the objective (Nikon 60X, NA=0.7), the laser power (1.3 mW, measured at the sample), and exposure time (5s). Cells are immersed in a thin layer of PBS when taking the measurement.
ROS Preparation
TBHP, H2O2, OCl− are delivered from 70%, 35%, 5% aqueous solutions respectively. NO is delivered from 10 μM of sodium nitroprusside solution. Hydroxyl radical (•OH) is generated from 1 mM Fe2+ and 100 μM H2O2. Superoxide (O2•−) is prepared from KO2 in DMSO solution.
Cell Culture
SW620 cells are cultured in DMEM (without glutamine and phenol red, D5921, SIGMA) supplemented with 1% L-glutamine and 10% fetal bovine serum (FBS). Typically, these cells are first grown onto a round poly-L-lysine modified coverslip (12mm, BD BioCoat, Bedford, MA) to ensure sufficient cell attachment. 3-MPBA-AuNPs colloid (200 μL) is then added to 1.8 mL cell culture solution and incubated with the cell-attached coverslip overnight (24 hours) in a 35 mL petri dish (Greiner Bio-One). After the incubation, the coverslips are rinsed with copious amount of PBS buffer (Gibco) twice to remove residual culture media, nanoparticle colloid and non-adherent cells. The coverslip is then transferred to the top of a glass slide and then immersed in a thin layer of PBS solution for dark-field imaging and SERS detection.
Cell Viability Assay
Cell viability was measured using the Cell Titer-Blue Viability assay (Promega, Madison, WI), which is based on the reduction of a nonfluorescent dye resazurin to the red fluorescent product resorufin resulting from active growth of cells. SW620 cells were first seated in a 96-well plate at a concentration of 10,000 cells/well and then were treated with our MPBA functionalized nanoparticle probes (loaded AuNPs) or the unmodified nanoparticle probes (unloaded AuNPs) of the same concentration as used in the SERS measurement. After 24 hours of incubation, 20 μL of Cell Titer-Blue reagent was added into each well. After 1 hour of incubation, the 96-well plate was read for fluorescence measurement at 560 and 590 nm wavelengths for excitation and emission, respectively, using a plate reader (Spectramax M5, Sunnyvale, CA). Fluorescence intensities of each treatment group were normalized to the untreated control (cells without nanoparticle treatment) for comparison (N=4).
Dark-field Microscopy
Dark-field imaging is carried out on a Nikon, Ti-U microscope with a dark-field condenser (Nikon, NA = 0.95–0.80). A 100W tungsten-halogen lamp (V2-A LL, Nikon) is used as the excitation source and the light is collected by a 60X objective (NA=0.7, Nikon). The images are taken for SW620 cells (on a coverslip) incubated with MPBA-AuNPs overnight, rinsed and immersed in a thin-layer of PBS solution.
RESULTS AND DISCUSSION
SERS Measurement of 3-MPBA, 3-HTP and H2O2 Treated 3-MPBA AuNPs
In order to confirm the successful modification of AuNPs by 3-MPBA, we measure the SERS spectra (Figure 2) and find excellent agreement with previous work.33 The bands at 420, 783, 995, 1019, 1069, 1552, 1571 cm−1 are attributed to C-S stretching, C-H out of plane bending, C-C in plane bending, C-H in plane bending, C-C in plane bending coupled with C-S stretching, non-totally symmetric ring stretching and totally symmetric ring stretching respectively. The SERS spectra of 3-MPBA functionalized AuNPs after treatment with 100 μM H2O2 are in excellent agreement with the SERS spectra of 3-HTP (Figure 2), indicating the expected conversion of the boronate to the phenol. The newly emergent bands of 882 cm−1 and 1589 cm−1 are attributed to benzene ring stretching (ʋ12) and the totally symmetric ring stretching (ʋ8a) of 3-HTP.34
Figure 2.
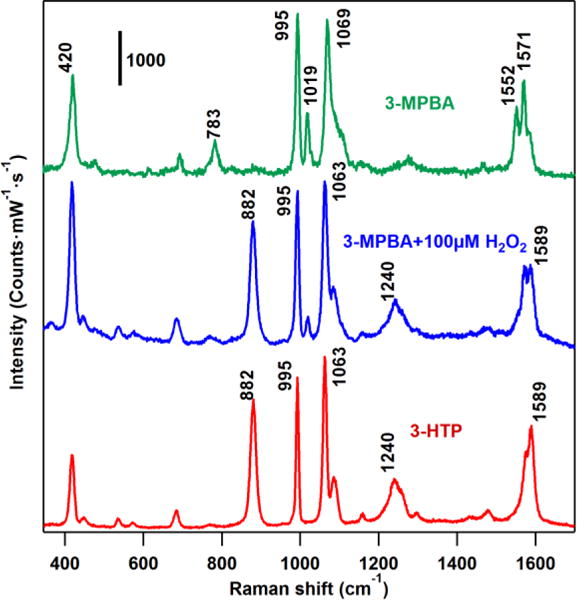
SERS spectra of 3-HTP, 3-MPBA and 3-MPBA treated with 100 μM H2O2. All of the Au colloids samples were aggregated by 1 M NaBr solution before measurement. (λex = 785 nm, Plaser = 500 μW, t = 10 s). The SERS spectra (blue trace) of the H2O2 treated nanoprobe exhibits different spectra from the untreated samples (3-MPBA, green trace) and is almost identical to the spectra of the oxidized product (3-HTP, red trace).
Quantitative Detection of H2O2 in PBS
AuNPs/AgNPs are the most popular and widely used substrates in SERS research, however, due to the variations in the field enhancement caused by differences in both local morphology of the nanostructures and hotspots coupling,35 it remains challenging to obtain quantitative information based only on the peak area or the intensity which arises from the analyte. For example, while the new band at 882 cm−1 is assigned to the oxidation of 3-MPBA in the presence of H2O2, we find it hard to accurately quantify the concentration of H2O2 based only on this band due to inconsistent signal obtained caused by variability in the AuNP aggregation (Supporting Informaition, Figure S3(a)). We address this issue by using the 995 cm−1 band as an internal standard as it is mostly unchanged by the treatment of H2O2 and allows for robust quantification of H2O2 concentration based on the ratio between I882 cm−1 and I995 cm−1 (Supporting Informaition, Figure S3(b)).
Increasing the concentration of H2O2 results in an in increased SERS (882:995) ratio until the concentration of H2O2 reaches 150 μM (Figure 3), indicating the complete oxidation from 3-MPBA to 3-HTP on the AuNPs. Also, as the inset in Figure 3 shows, the ratio is linearly related to H2O2 concentration from 0.1 μM to 2.53 μM. The LOD is calculated as 70 nM determined by 3σ / k, where σ is the standard deviation of the blank and k is the slope of the calibration curve (Figure 3 inset). The maximum signal is obtained within 20 min; therefore our probe exhibits comparable detection range with a lower LOD and shorter response time compared to previously reported H2O2 sensors.13,36,37 (Details about reaction time study are in Supporting Informaition Figure S4).
Figure 3.
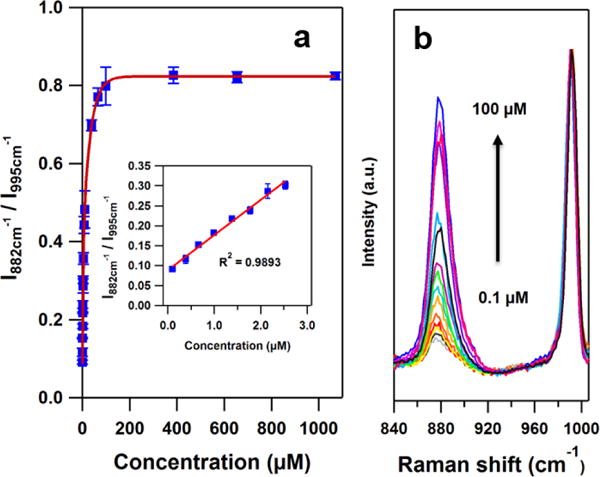
(a) The SERS response of the boronate nanoprobe in PBS as obtained from the intensity ratio of the bands at 882 cm−1 and 995 cm−1 as a function of the H2O2 concentration. Inset: A linear response is obtained for H2O2 concentrations between 0 and 3.0 μM. The error bars represent the relative standard deviations (RSD) from 3 replicate samples each of which was measured at 7 different spots. (λex = 785 nm, Plaser = 500 μW, t = 10 s) (b) The average SERS spectra of the boronate nanoprobe in the presence of 0.1 μM to 100 μM H2O2.
Selective Detection of H2O2 in PBS
In order to evaluate the selectivity of our method, we investigated the potential effect of ROS and RNS on our boronate nanoprobe. Figure 4 illustrates that the nanoparticle probe is not responsive to ClO−, ·OH, O2−, TBHP or NO when present at concentrations up to 10 μM. Only the samples exposed to H2O2 give rise to SERS response. This stands in contrast to previously reported SERS-based sensing schemes,28,29 which indicate no selectivity to H2O2 over other ROS interferences. Our nanoprobe, therefore, shows superb sensitivity and further exhibits excellent selectivity which makes it a suitable candidate to monitor H2O2 in complicated biological environments.
Figure 4.
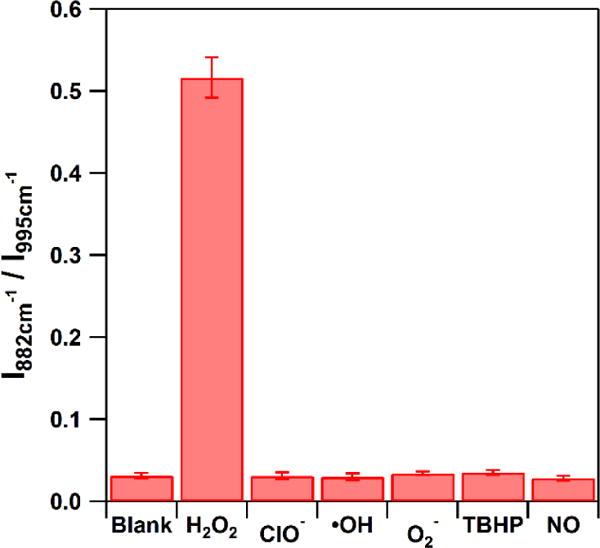
The SERS response of I882 cm−1 / I995 cm−1 to 10 μM of various ROS and RNS. The blank is the signal obtained without addition of any ROS or RNS. The error bars represent the relative standard deviations (RSD) from 3 replicate samples each of which was measured at 7 different spots. (λex = 785 nm, Plaser = 500 μW, t = 10 s)
Detecting Glucose in Artificial Urine and Normal Human Serum
Encouraged by the previous results, we couple our nanoprobe with GOx to detect glucose in artificial urine and human serum. GOx is a commonly used enzyme to catalyse glucose to gluconic acid and H2O2, and the corresponding product H2O2 can be detected by our boronate nanoprobe (Figure 5).
Figure 5.
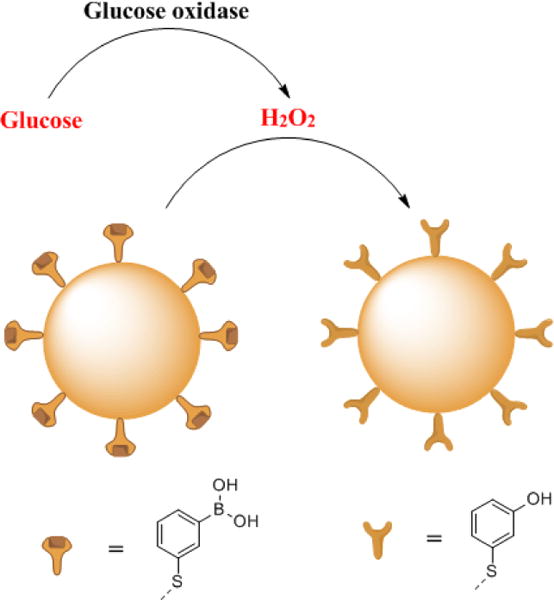
The scheme of sensing glucose in urine. Glucose oxidase (GOx) oxidizes glucose to H2O2 and gluconic acid. H2O2 is detected by the oxidation of the boronate nanoprobe to its phenol version.
For the urine samples, 10 μL of glucose-containing urine solutions (0.5–10 mM in glucose) and an optimized amount of 10 μL 1 mM GOx solution is added into 0.5 mL of our nanoprobe samples. All samples are incubated at 37 °C for 30 min to allow complete digestion of glucose before measurement. As Figure 6a shows, increasing concentration of glucose yields significantly stronger SERS response. The use of the 995 cm−1 band as an internal standard enables us to accurately measure the concentration and the relative intensities follow closely the Langmuir-type adsorption curve over the tested concentrations (0.5 mM – 10 mM). Interestingly, we find a good linearity of the signal in the biological relevant concentrations from 0.5 mM to 5 mM (Figure 6a inset).
Figure 6.
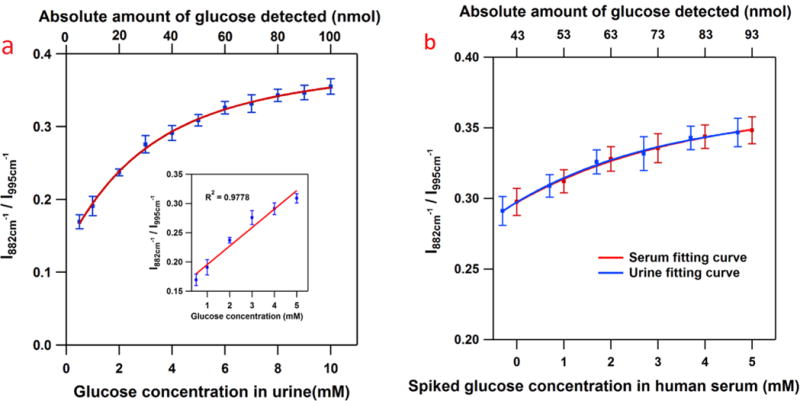
(a) The SERS response obtained from the boronate modified nanoprobe to the addition of 10 μL of glucose spiked urine solutions (bottom axis). The absolute amount in nmol of glucose detected is given for comparison (top axis). Inset: The probe displays a linear response range over the biologically relevant concentration range (0.5 mM to 5 mM). (b) The SERS response obtained from the boronate modified nanoprobe to the addition of 10 μL of glucose spiked human serum solutions (bottom axis). The absolute amount in nmol of glucose detected is given for comparison (top axis). The red trace is the curve fitting from human serum samples. For comparison, we also show the curve fitting from artificial urine samples (blue trace) in the same range of absolute amount of glucose present in the samples. The error bars in both graphs represent the relative standard deviations (RSD) from 3 replicate samples, each of which was measured at 7 different spots. (λex = 785 nm, Plaser = 500 μW, t = 10 s)
To further demonstrate clinical potential, human serum samples are spiked with 0 – 5 mM of glucose and the same procedures for the addition of GOx are followed from above. We find that the samples without any additional glucose (0 mM) show a SERS response. Using the calibration curve in Figure 6a, our method yields a glucose concentration of 4.3 mM in the serum samples, which is within the biological range of a normal human (4–6 mM), further validating our method. In Figure 6b, the offset between the serum and urine data points arises from the initial glucose concentration in serum. Accounting for this initial glucose concentration, it is worth pointing out that, in the same range of absolute amount of glucose present in the samples, the SERS response from the serum samples (Figure 6b, red trace) match the SERS response from artificial urine samples (Figure 6b, blue trace), which proves the reproducibility and reliability of our method.
The probe’s excellent sensitivity (70 nM to 150 μM) allows a glucose assay to be performed with a minimal amount (<1 μL) of biological fluid to complete the test, which is desirable in clinical applications. This feature arises because addition of glucose containing fluids into our probe solution will dilute the glucose concentration from biological range (mM) to μM range which perfectly fits in the detection range of our probe.
Moreover, owing to the high specificity of the GOx, the probe is highly selective to glucose (5 mM) and other sugars tested (fructose, galactose, mannose and sucrose, 50 mM) do not provide a SERS response (Figure 7).
Figure 7.
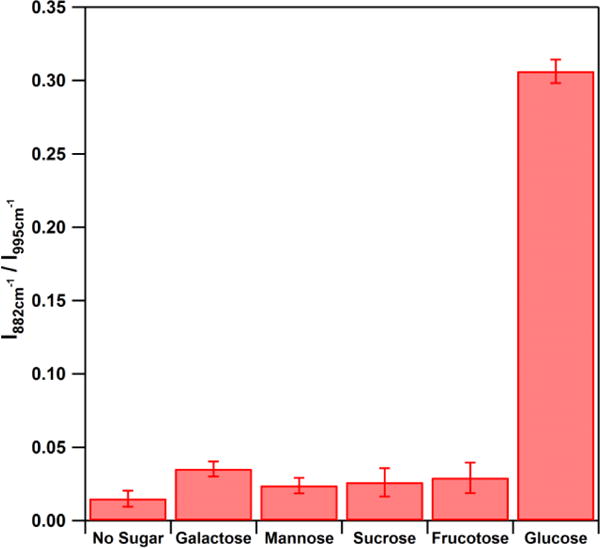
The SERS response from the nanoprobe to 5 mM glucose and 50 mM of other saccharides. The error bars represent the relative standard deviations (RSD) from 3 replicate samples each of which was measured at 7 different spots. (λex = 785 nm, Plaser = 500 μW, t = 10 s)
Monitoring Exogenous and Endogenous Production of H2O2 in Living Cells
Finally, we challenge our probe to detect H2O2 introduced exogenously or produced endogenously by colon cancer (SW620) cells in vitro. The nanoprobe is added into the cell culture media for 24 hours to allow sufficient uptake of nanoparticles through the endocytosis process.38 The cell viability in the presence of the nanoprobe indicates the modified nanoparticles have negligible cytotoxicity to the cells suggesting great biocompatibility (details for cell viability tests in Supporting Information, Figure S5). Bright-field images (Figure 8, left column) indicate that the cell morphology is maintained after treatment with 3-MPBA modified AuNPs. Dark-field microscopy images (Figure 8, middle column) are used to locate the internalized nanoprobe and record SERS spectra at these positions inside the cell (Figure 8, right column).
Figure 8.
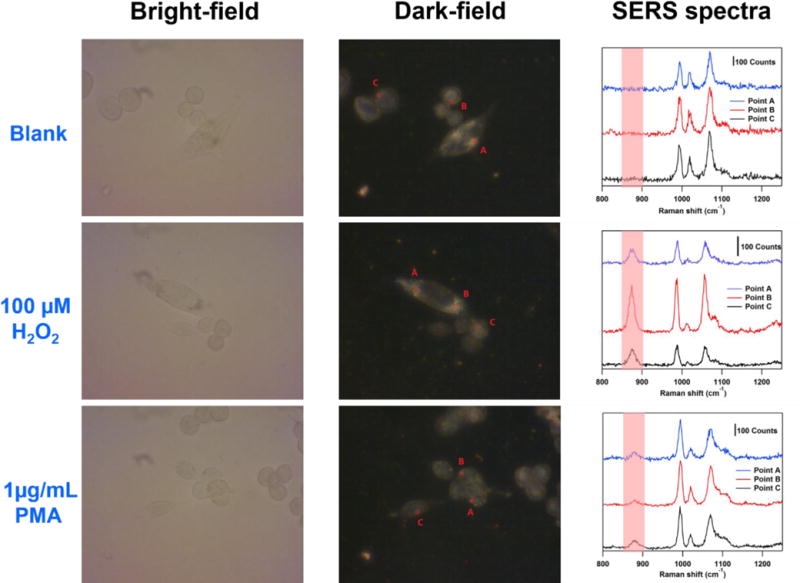
Bright-field images (left column) and dark-field microscopy images (middle column) of SW620 cells incubated with the nanoprobe after 24 hours respectively. Right column: SERS spectra obtained from the points denoted in the corresponding dark-field microscopy images in the same row. Samples at the first row are blank. Samples at the second row and the third row are treated with 100 μM H2O2 and 1 μg/mL PMA respectively for 1 hour. (λex = 785 nm, Plaser = 1.3 mW, t = 5 s).
First, SERS spectra are obtained from blank cell samples (Figure 8 first row, right column). While a SERS signal from the nanoprobe inside the cells is easily obtained, no spectral signature of H2O2 is observed. This indicates that, under normal culture conditions, the H2O2 levels generated by the SW620 cells within 24h is negligible.
However, after 1 hour of stimulation by 100 μM of exogenously introduced H2O2 in the cell media followed by rinsing with PBS, we observe a dramatic SERS response (Figure 8 second row, right column) in the 882 cm−1 band. It is interesting that while the intensity of the SERS spectra varies from point to point due to the inevitable and uncontrollable aggregation of AuNPs inside the cells, the relative intensity I882 cm−1 / I995 cm−1 remains constant (about 0.8), indicating comparable H2O2 concentration between points.
Lastly, phorbol myristate acetate (PMA, 1 μg/mL), a membrane permeable ROS generation stimuli,39 is added into the cell media to induce endogenous generation of ROS. SERS spectra are recorded after 1 hour treatment of PMA and washing with PBS. As expected, we observe a response at 882 cm−1 (Figure 8, shaded region) for all points measured (Figure 8 third row, right column). The I882 cm−1 / I995 cm−1 ratios observed at points A, B, and C (0.2169, 0.1501, and 0.1982) fall into the linear range of our calibration curve (Fig 3 inset) and the local H2O2 concentration is calculated to be 1.45 μM, 0.7 μM, and 1.24 μM respectively. This observation stands in contrast to the results obtained from the controls and confirms the elevated level of H2O2 generation under PMA stimulation inside the cells. The boronate nanoprobe, therefore, is capable of detecting endogenous production of H2O2 in living cells and has the potential to be applied to monitor other H2O2 related biological processes in vitro.
CONCLUSION
We have developed a new SERS-based boronate nanoprobe for quantitative, selective, and sensitive detection of H2O2 over other ROS and RNS in PBS. Furthermore, the highly biocompatible nanoprobe is successfully applied to detect exogenous and endogenous H2O2 in living cells. This work provides a new method to help biologists and pathologists to monitor the roles of H2O2 in biological processes at the cellular level. Moreover, we measure the glucose level in artificial urine and normal human serum by coupling the nanoprobe with GOx, illustrating that our nanoprobe can be coupled with oxidase enzymes, such as those specific to NADPH, xanthine, pyruvate, monoamine, cholesterol, to greatly expand its applicability to biologically active targets. We envision that, with sophisticated surface modification chemistry (such as EDC/NHS coupling),40 oxidase enzymes could be readily immobilized onto AuNPs together with our H2O2 responsive probe 3-MPBA to deliver sensitive and selective detection towards various in vitro analytes.
Supplementary Material
Acknowledgments
This work was supported by Advanced Diagnostics and Therapeutics (XG) at the University of Notre Dame, U.S. National Science Foundation under Grant CHE-1150687 (JPC), and the U.S. National Institutes of Health award R01 GM109988 (ZDS).
Footnotes
Supporting Information
This section contains the UV-vis and SEM characterization of the AuNPs, the internal standard ratio quantification and intensity quantification figures, dynamics study of the reaction. Data of the cell viability test are also included. This information is available free of charge via the Internet at http://pubs.acs.org.
Notes
The authors declare no competing financial interest.
References
- 1.Winterbourn CC. Nature Chemical Biology. 2008;4:278–286. doi: 10.1038/nchembio.85. [DOI] [PubMed] [Google Scholar]
- 2.Rhee SG. Science. 2006;312:1882–1883. doi: 10.1126/science.1130481. [DOI] [PubMed] [Google Scholar]
- 3.Murphy MP, Holmgren A, Larsson NG, Halliwell B, Chang CJ, Kalyanaraman B, Rhee SG, Thornalley PJ, Partridge L, Gems D, Nystrom T, Belousov V, Schumacker PT, Winterbourn CC. Cell Metabolism. 2011;13:361–366. doi: 10.1016/j.cmet.2011.03.010. [DOI] [PMC free article] [PubMed] [Google Scholar]
- 4.Floyd RA. Science. 1991;254:1597–1597. doi: 10.1126/science.1684251. [DOI] [PubMed] [Google Scholar]
- 5.Salvemini D, Doyle TM, Cuzzocrea S. Biochemical Society Transactions. 2006;34:965–970. doi: 10.1042/BST0340965. [DOI] [PubMed] [Google Scholar]
- 6.Houstis N, Rosen ED, Lander ES. Nature. 2006;440:944–948. doi: 10.1038/nature04634. [DOI] [PubMed] [Google Scholar]
- 7.Huang YD, Mucke L. Cell. 2012;148:1204–1222. doi: 10.1016/j.cell.2012.02.040. [DOI] [PMC free article] [PubMed] [Google Scholar]
- 8.Finkel T, Serrano M, Blasco MA. Nature. 2007;448:767–774. doi: 10.1038/nature05985. [DOI] [PubMed] [Google Scholar]
- 9.Shan C, Yang H, Song J, Han D, Ivaska A, Niu L. Analytical Chemistry. 2009;81:2378–2382. doi: 10.1021/ac802193c. [DOI] [PubMed] [Google Scholar]
- 10.Lin YH, Lu F, Tu Y, Ren ZF. Nano Letters. 2004;4:191–195. [Google Scholar]
- 11.Vidal JC, Garcia E, Castillo JR. Anal Chim Acta. 1999;385:213–222. [Google Scholar]
- 12.Dey RS, Raj CR. Journal of Physical Chemistry C. 2010;114:21427–21433. [Google Scholar]
- 13.Lippert AR, De Bittner GCV, Chang CJ. Accounts of Chemical Research. 2011;44:793–804. doi: 10.1021/ar200126t. [DOI] [PMC free article] [PubMed] [Google Scholar]
- 14.Hoebe RA, Van Oven CH, Gadella TWJ, Jr, Dhonukshe PB, Van Noorden CJF, Manders EMM. Nature Biotechnology. 2007;25:249–253. doi: 10.1038/nbt1278. [DOI] [PubMed] [Google Scholar]
- 15.Warren EAK, Netterfield TS, Sarkar S, Kemp ML, Payne CK. Scientific Reports. 2015;5:16929–16934. doi: 10.1038/srep16929. [DOI] [PMC free article] [PubMed] [Google Scholar]
- 16.Gill R, Bahshi L, Freeman R, Willner I. Angew Chem-Int Edit. 2008;47:1676–1679. doi: 10.1002/anie.200704794. [DOI] [PubMed] [Google Scholar]
- 17.Wu P, He Y, Wang H-F, Yan X-P. Analytical Chemistry. 2010;82:1427–1433. doi: 10.1021/ac902531g. [DOI] [PubMed] [Google Scholar]
- 18.Hoshino A, Fujioka K, Oku T, Suga M, Sasaki YF, Ohta T, Yasuhara M, Suzuki K, Yamamoto K. Nano Letters. 2004;4:2163–2169. [Google Scholar]
- 19.Schluecker S. Angew Chem-Int Edit. 2014;53:4756–4795. doi: 10.1002/anie.201205748. [DOI] [PubMed] [Google Scholar]
- 20.Stiles PL, Dieringer JA, Shah NC, Van Duyne RR. Annual Review of Analytical Chemistry. Annual Reviews; Palo Alto: 2008. pp. 601–626. [DOI] [PubMed] [Google Scholar]
- 21.Nie SM, Emery SR. Science. 1997;275:1102–1106. doi: 10.1126/science.275.5303.1102. [DOI] [PubMed] [Google Scholar]
- 22.Gu X, Camden JP. Analytical Chemistry. 2015;87:6460–6464. doi: 10.1021/acs.analchem.5b01566. [DOI] [PubMed] [Google Scholar]
- 23.Liu H, Yang Z, Meng L, Sun Y, Wang J, Yang L, Liu J, Tian Z. J Am Chem Soc. 2014;136:5332–5341. doi: 10.1021/ja501951v. [DOI] [PubMed] [Google Scholar]
- 24.Hennig S, Moenkemoeller V, Boeger C, Mueller M, Huser T. Acs Nano. 2015;9:6196–6205. doi: 10.1021/acsnano.5b01503. [DOI] [PubMed] [Google Scholar]
- 25.Qian XM, Peng XH, Ansari DO, Yin-Goen Q, Chen GZ, Shin DM, Yang L, Young AN, Wang MD, Nie SM. Nature Biotechnology. 2008;26:83–90. doi: 10.1038/nbt1377. [DOI] [PubMed] [Google Scholar]
- 26.Wang Y, Yan B, Chen L. Chemical Reviews. 2013;113:1391–1428. doi: 10.1021/cr300120g. [DOI] [PubMed] [Google Scholar]
- 27.Lane LA, Qian X, Nie S. Chemical reviews. 2015;115:10489–10529. doi: 10.1021/acs.chemrev.5b00265. [DOI] [PubMed] [Google Scholar]
- 28.Liang J, Liu H, Huang C, Yao C, Fu Q, Li X, Cao D, Luo Z, Tang Y. Analytical Chemistry. 2015;87:5790–5796. doi: 10.1021/acs.analchem.5b01011. [DOI] [PubMed] [Google Scholar]
- 29.Yu Z, Park Y, Chen L, Zhao B, Jung YM, Cong Q. Acs Applied Materials & Interfaces. 2015;7:23472–23480. doi: 10.1021/acsami.5b08643. [DOI] [PubMed] [Google Scholar]
- 30.Carroll V, Michel BW, Blecha J, VanBrocklin H, Keshari K, Wilson D, Chang CJ. J Am Chem Soc. 2014;136:14742–14745. doi: 10.1021/ja509198w. [DOI] [PMC free article] [PubMed] [Google Scholar]
- 31.Kim D, Kim G, Nam S-J, Yin J, Yoon J. Scientific Reports. 2015;5:8488–8493. doi: 10.1038/srep08488. [DOI] [PMC free article] [PubMed] [Google Scholar]
- 32.Miller EW, Albers AE, Pralle A, Isacoff EY, Chang CJ. J Am Chem Soc. 2005;127:16652–16659. doi: 10.1021/ja054474f. [DOI] [PMC free article] [PubMed] [Google Scholar]
- 33.Sun F, Bai T, Zhang L, Ella-Menye J-R, Liu S, Nowinski AK, Jiang S, Yu Q. Analytical Chemistry. 2014;86:2387–2394. doi: 10.1021/ac4040983. [DOI] [PubMed] [Google Scholar]
- 34.Lee HM, Kim MS, Kim K. Vibrational Spectroscopy. 1994;6:205–214. [Google Scholar]
- 35.Xu HX, Bjerneld EJ, Kall M, Borjesson L. Phys Rev Lett. 1999;83:4357–4360. [Google Scholar]
- 36.Xu KH, Qiang MM, Gao W, Su RX, Li N, Gao Y, Xie YX, Kong FP, Tang B. Chemical Science. 2013;4:1079–1086. [Google Scholar]
- 37.Liu B, Sun Z, Huang P-JJ, Liu J. J Am Chem Soc. 2015;137:1290–1295. doi: 10.1021/ja511444e. [DOI] [PubMed] [Google Scholar]
- 38.Rejman J, Oberle V, Zuhorn IS, Hoekstra D. Biochem J. 2004;377:159–169. doi: 10.1042/BJ20031253. [DOI] [PMC free article] [PubMed] [Google Scholar]
- 39.Bellavite P. Free Radical Biology and Medicine. 1988;4:225–261. doi: 10.1016/0891-5849(88)90044-5. [DOI] [PubMed] [Google Scholar]
- 40.Rusmini F, Zhong Z, Feijen J. Biomacromolecules. 2007;8:1775–1789. doi: 10.1021/bm061197b. [DOI] [PubMed] [Google Scholar]
Associated Data
This section collects any data citations, data availability statements, or supplementary materials included in this article.


