Abstract
A novel approach to determine the global topological structure of a microvasculature network from noisy and low-resolution fluorescence microscopy data that does not require the detailed segmentation of the vessel structure is proposed here. The method is most appropriate for problems where the tortuosity of the network is relatively low and proceeds by directly computing a piecewise linear approximation to the vasculature skeleton through the construction of a graph in three dimensions whose edges represent the skeletal approximation and vertices are located at Critical Points (CPs) on the microvasculature. The CPs are defined as vessel junctions or locations of relatively large curvature along the centerline of a vessel. Our method consists of two phases. First, we provide a CP detection technique that, for junctions in particular, does not require any a priori geometric information such as direction or degree. Second, connectivity between detected nodes is determined via the solution of a Binary Integer Program (BIP) whose variables determine whether a potential edge between nodes is or is not included in the final graph. The utility function in this problem reflects both intensity-based and structural information along the path connecting the two nodes. Qualitative and quantitative results confirm the usefulness and accuracy of this method. This approach provides a mean of correctly capturing the connectivity patterns in vessels that are missed by more traditional segmentation and binarization schemes because of imperfections in the images which manifest as dim or broken vessels.
Keywords: Graph extraction, Microvascular network, Convex hull, Junction detection, Tubular structures
1. Introduction
Quantitative analysis of connectivity patterns in complex biological tubular networks such as the brain vasculature has recently received growing attention for a variety of biological questions, ranging from vascular development (e.g. angiogenesis and vascular patterning), and vascular physiology (e.g. regulation of brain perfusion and blood flow), to vascular diseases, surgical planning, and therapy (Jackowski et al., 2005; Lesage et al., 2009; Kim et al., 2011; Blinder et al., 2013). Motivating the effort in this paper is the recent discovery of a correlation between microvascular and neuronal densities in the murine cortex (Tsai et al., 2009) where it was shown that in the range of 1–10 mm of the gray matter, neuronal and vascular densities are correlated to each other in that the functional behavior of the neurons in granular lamina detected from the brain images was consistent with and measurable from the distribution of blood vessel densities. In addition, analysis and classification of blood vessel networks in terms of the length of vessels and the number of bifurcations in a given volume have been shown to provide pathological insight into the biological properties of a sample (Jackowski et al., 2005). Finally, the connectivity model of vascular networks has been used to aid in the registration of Magnetic Resonance Angiography images acquired from the same vasculature at separate points in time (Aylward et al., 2003; Bullitt et al., 1999; Kirbas and Quek, 2004). A graph-based model such as the one suggested in this paper provides both topological and quantitative insight into vascular systems via piecewise linear approximation to their centerlines. These graph-based models can be applied to all the problems mentioned above. For example, junction degree can trivially be determined from the graph and vessel length approximated by the physical length of the edges on the shortest path between two junctions in the graph.
Typically, problems of finding such a graph-based model are solved in a three-step fashion. First, a comprehensive segmentation of the image is obtained using methods such as active contours (Chan and Vese, 2001; Yan and Kassim, 2006), geometric model-based techniques (Qian et al., 2009; Mahadevan et al., 2004), or region growing approaches (Eiho et al., 2004). Then, the tubular structure’s skeleton is found using methods such as thinning (Homann, 2007). Finally, a graph-type model is derived from the skeleton as a post processing step. These methods face a number of difficulties. Perhaps most importantly, common detailed segmentation methods are difficult to automate. Even state of the art methods require extensive human interaction (Kirbas and Quek, 2004; Lesage et al., 2009; Olabarriaga and Smeulders, 2001). This can be a major shortcoming for large data sets and when the vascular network is comprised of very closely spaced structures. Also, in the presence of high noise level, intensity contrast between the object and background decreases and boundaries weaken resulting in a loss of accuracy in segmentations obtained by region growing and edge detection methods (Wang et al., 2009). Additionally, a segmentation-first approach does not necessarily give rise to an accurate network graph. For example, many of the skeletonization methods struggle when segmentation yields gaps in the vessels (Lesage et al., 2009). Establishing a graph based on the skeleton needs a tracking step that adds to the complexity and error rate of the process. These three-step types of methods have been developed primarily for networks with tree-type structures such as neural, bronchial, and breast ductal networks (Gulsun and Tek, 2008; Megalooikonomou et al., 2009; Olabarriaga et al., 2003; Pisupati et al., 1995; Türetken et al., 2011). For these cases where the graph has a tree structure, different implementations of the minimum spanning tree using Euclidian (Bullitt et al., 1999) or Mahalanobis distances (Jomier et al., 2005) have been proposed to determine the graph from the segmented images. Because vasculature networks are not always of a tree-based shape given fluorescence microscopy data of mixed image quality, these techniques are not applicable and new methods are required.
Recently there have been some efforts in identifying centerlines directly from the data without first performing a high-resolution segmentation. Ridge-based methods (Aylward and Bullitt, 2002) and minimal path techniques (Li and Yezzi, 2007) are the most common algorithms of this type. The former locates the tubular structures’ skeleton by finding and following the image’s intensity ridges (Kirbas and Quek, 2004). Vessel tracking algorithms start from a set of seed points and follow the centerline by maximizing an energy function correlating to the vessel centerlines (Lesage et al., 2009). These methods both require the beginning and end points generally or the root point for vascular trees and hence are most appropriate for interactive work (Lesage et al., 2009). Due to the needed human interaction, they are inefficient for manipulation of large data sets where manual selection of such points would be burdensome. Error accumulation along the tracking routes produced by the noise or other imaging artifacts is another drawback of these types of methods (Rittscher et al., 2008).
Relevant to the problem of interest however are recent methods directed at recovering loopy structures (Türetken et al., 2013). The method proposed in (Türetken et al., 2013) first builds an overcomplete graph representing the network by connecting a set of evenly spaced nodes located on the directly connected structures. Subsequently, a globally optimal graph is computed from this initial graph. This approach though is not able to handle cases such as those encountered in the problem of interest here where challenges with the data are apparent including breaks or dimness in the vasculature. In another paper (Bogunovic et al., 2013), the centerline is found by tracing the intensity ridge paths along a set of manually selected seed points. Additionally, as with the work in (Türetken et al., 2013), this “tracing-based” algorithm was not developed to address the issue of broken vessels.
Motivated by the above discussion, we consider a semi-automated approach for determining a graph representing the piecewise linear connectivity pattern of a network without the need for first performing a detailed segmentation of the data, deriving the structure’s centerline, or manually selecting the seed points. Of particular interest to us is the case of cortical microvasculature determination in a murine model from fluorescence microscopy data stacks that manifest vessels of low tortuosity.
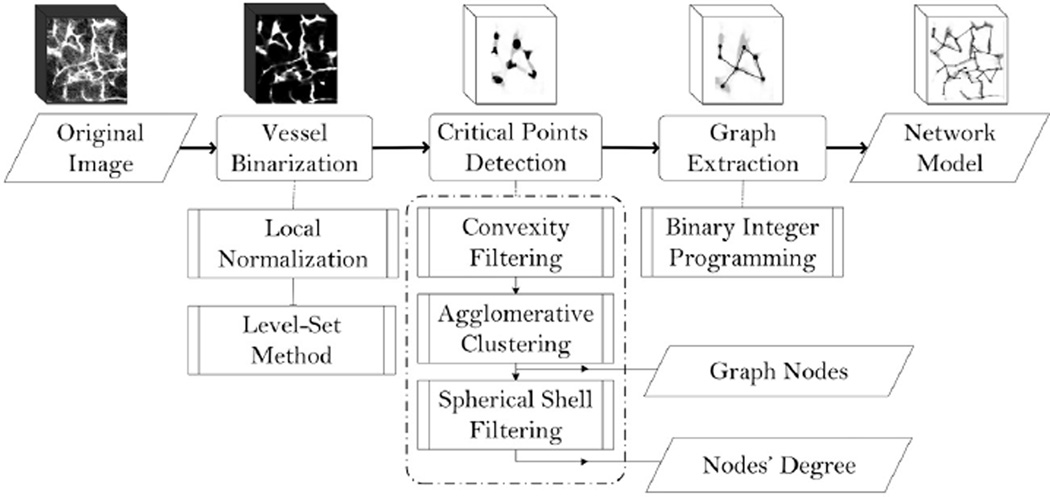
The specific processing chain is illustrated in Fig. 1. As it is common in vascular detection methods especially from microscopy images, an initial stage is used to denoise, enhance, and binarize the raw data (Sarder and Nehorai, 2006; Suri et al., 2002). The binary image is then used as the basis for the rest of the processing. Critical points that are comprised of both vasculature junctions and points of relatively high curvature along individual branches are detected in the next stage. Since the number of CPs in a microvasculature sample can be huge, manual intervention has to be minimal. Our approach is free of prior assumptions on the degree of junctions (i.e., the number of connections) or orientation of the connected branches making it well suited for the structural variability and compactness across a given volume. Graph extraction is accomplished in each image by solving a BIP problem (Hoffman and Ralphs, 2013) where the variables represent potential edges of the graph. A binary variable is associated with every possible edge linking pairs of CPs. Using the binary images, each such edge is assigned a “utility” constructed to reflect both local and global features of the microvascular structure (see Section 4). The BIP then determines the inclusion of edges in the final graph of each data volume in order to maximize the associated utility.
Fig. 1.
Overall view of the proposed network modeling method. Dashed lines encompass the detailed steps of each stage while parallelograms indicate the outputs.
This paper contributes to the existing state-of-the-art through the development of a novel graph-based microvascular network model identification approach using BIP that approximates microvasculatures’ loopy skeleton by their connectivity graph. The common need for feeding seed points to the algorithm has been eliminated here while the graph is built based on the structurally critical points found by direction and scale invariant techniques. Since the graph’s edges are not weighted solely based on local image attributes but rather more global measures, this method can easily overcome many common challenges such as slight vessel breakages, faint vessels, or the presence of spurious branches. Given all these features, graph-based post processings (Lesage et al., 2009) are not required here.
The remainder of this paper is organized with Sections 2–4, describing the microvasculature network identification algorithm in detail including pre-processing, critical point detection, and graph-based connection mapping. Section 5 discusses the qualitative and quantitative empirical results. Conclusions are provided in Section 6.
2. Pre-processing
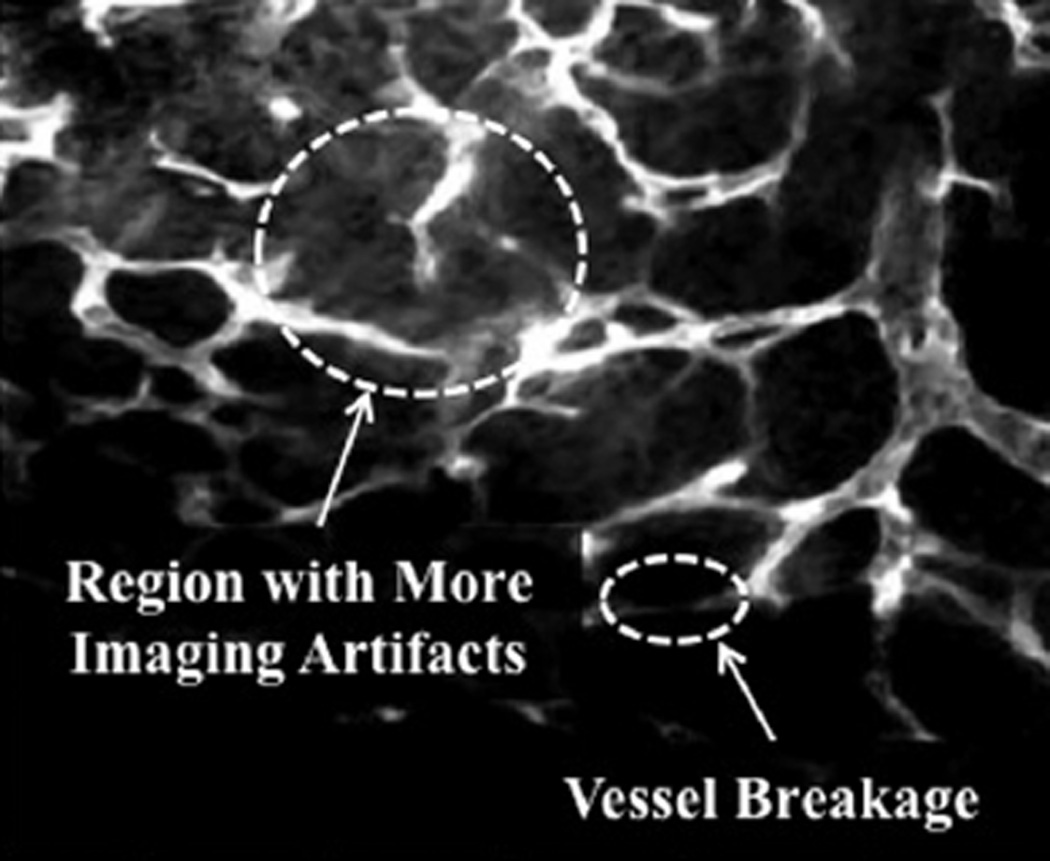
The graph-based model extraction process is designed to be performed on a rough binary estimation of the microvascular structure. Here, the level set method (Chan and Vese, 2001) has been selected to binarize the raw images. However, due to the poor contrast and higher level of imaging artifacts of fluorescence microscopy images, obtaining a reasonably accurate binarization is difficult. As illustrated in Fig. 2, fluorescence microscopy images are challenging to process due to noise, non-uniform illumination, fluorescent background signal, and staining-related artifact contents (Boulanger et al., 2010; Sarder and Nehorai, 2006). Larger vascular structures result in higher average intensity and consequently larger noise variance while smaller structures suffer from lower photon counts and less signal content. These issues, which are shown in Fig. 2, result in two challenges: (1) identifying the smaller structures along with their connectivity and (2) the recovery of larger vasculatures that tend to be surrounded by heavy noise.
Fig. 2.
An example of false fractions in the structure caused by imaging imperfections and an area of more artifacts in a maximum-intensity projection (MIP) slice of a 3-D fluorescent microscopy image of microvasculature.
To address the challenges discussed above, we make use of the local normalization method (Sage, 2014) as a means of initializing the level-set binarization step. The local normalization method transforms an input image, I, according to
| (1) |
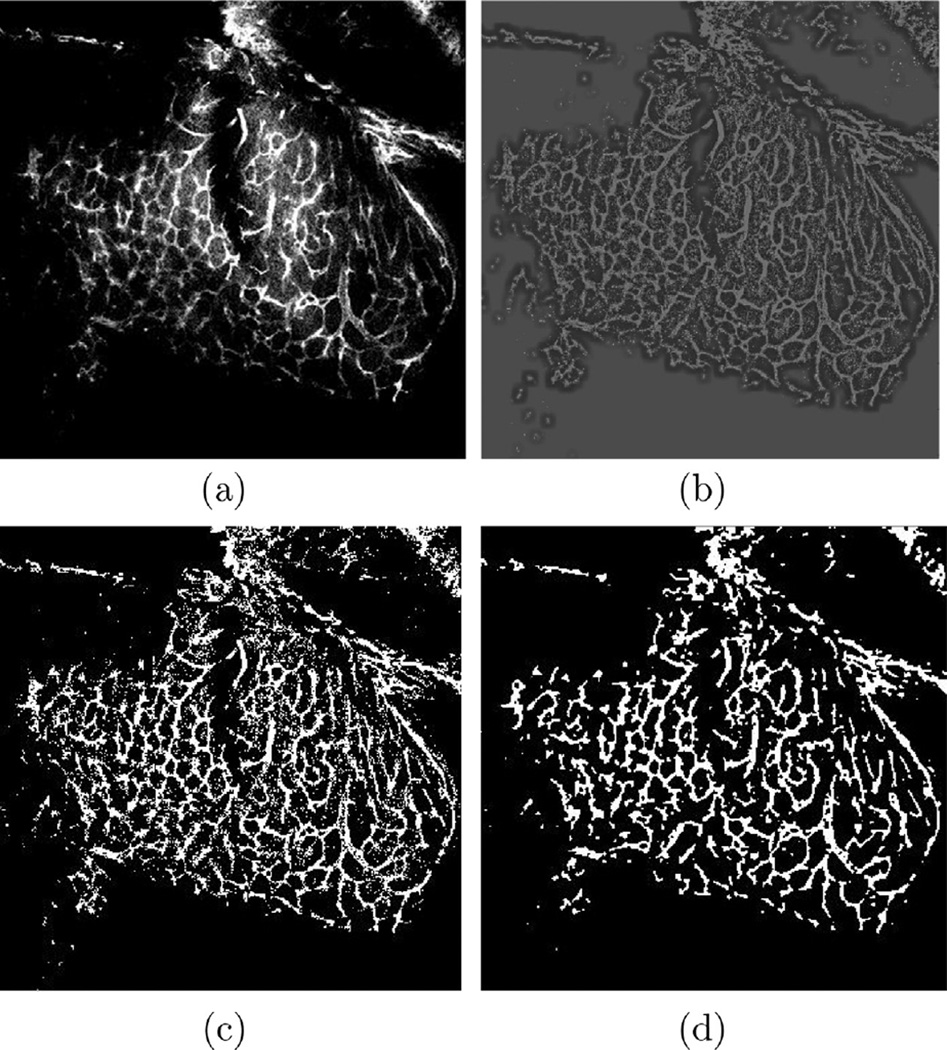
where I(x, y, z) is the original image intensity, mI(x, y, z) is the local average intensity, σI(x, y, z) is the local standard deviation of intensity, and ILN(x, y, z) is the locally normalized intensity at point (x, y, z). The quantities mI and σI are computed in Gaussian windows with standard deviations w1 and w2 centered on (x, y, z). The quantities w1 and w2 are selected such that the locally normalized image will have a bimodal intensity distribution that is ideal for a clustering-based thresholding such as Otsu’s method (Otsu, 1979). Bimodality is maximized when the inter-class variance (Otsu, 1979) between two modes is maximized. Thus, the optimal values of w1 and w2 are those that maximize the inter-class variance level. Through brute-force searching over different amounts of w1 and w2, we have found that w1 = 15 and w2 = 20 produce the best results for our datasets. Otsu’s thresholding of the normalized images is then used for initializing the level set method. Specifically, the level set function is initialized as the union of circles of radius one voxel centered on each of the thresholded voxels. In the remainder of the paper, the binary image resulting from the level set segmentation is denoted IB. In Fig. 3, a sample fluorescence microscopy image, its normalized, thresholded, and final binary versions are shown.
Fig. 3.
Fluorescence microscopy image enhancement/binarization: (a) original, (b) locally normalized, (c) thresholded, and (d) binary images.
3. Critical point detection
Critical points are intended to capture locations of significant structural change in the microvasculature. These locations are where vessels either branch or significantly bend. Here, we refer to branch points as junctions and points of significant bending as waypoints.1 The CP detection process is comprised of three stages: convexity filtering, CP clustering, and branching node detection. Fig. 4 illustrates the essence of each of these steps.
Fig. 4.
Critical points detection process: (a) detected critical point patches obtained by convexity filtering, (b) clustered patches and identified cps as the clusters’ centroids, and (c) junctions are identified through the spherical shell filtering process and marked by cross signs where waypoints are shown by disks.
3.1. Convexity filtering
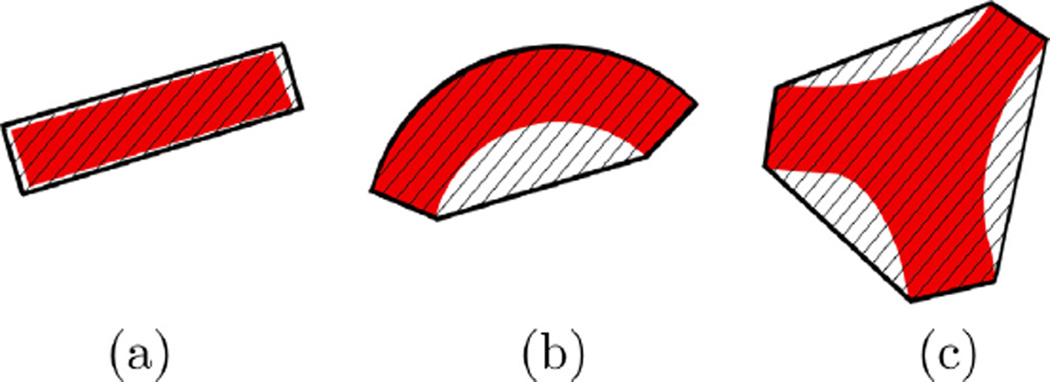
By relating the primary geometric structure of CPs to the non-convexity of the vasculature in their vicinity, we obtain an easy and effective method for identifying groups of points as potential CPs as shown in Fig. 5. In this figure, we show three typical cases of vasculature geometry model and their associated convex hulls. For the straight vessel in Fig. 5(a), there is negligible difference between the vessel and its convex hull. For the bending vessel in Fig. 5(b) as well as the junction in Fig. 5(c), the convex hull volume, νcx, differs markedly from that of the vascular structure, ν.
Fig. 5.
Three types of vascular structures with their convex hulls: (a) straight vessel: H ≈ 1, (b) waypoint: H > 1, and (c) junction: H ≫ 1.
Given the binary image, the convex hull of groups of voxels is easily determined and provides a reliable measure of the structural bending that does not require the explicit segmentation and smooth discretization of the vasculature surface. Thus, we consider a convexity metric computed in small neighborhoods of the foreground points to find the CPs.
To locate CPs by means of the convexity metric, we start by computing the H feature over cubes of width a. The quantity νcx is then the number of voxels in the convex hull of the foreground points and ν is the volume of foreground points in the cube. We let a = 4ρ where ρ, the nominal vessel radius measured in voxels, is roughly estimated using the method proposed in (Aylward and Bullitt, 2002). This value of a allows for inclusion of enough structure of interest in the cube and exclusion of the neighboring vessels for more precise computation of H. Critical points are then defined to be those points whose convexity metric is above a threshold that is automatically determined using Otsu’s method applied to the entire data set.
3.2. Critical point clustering
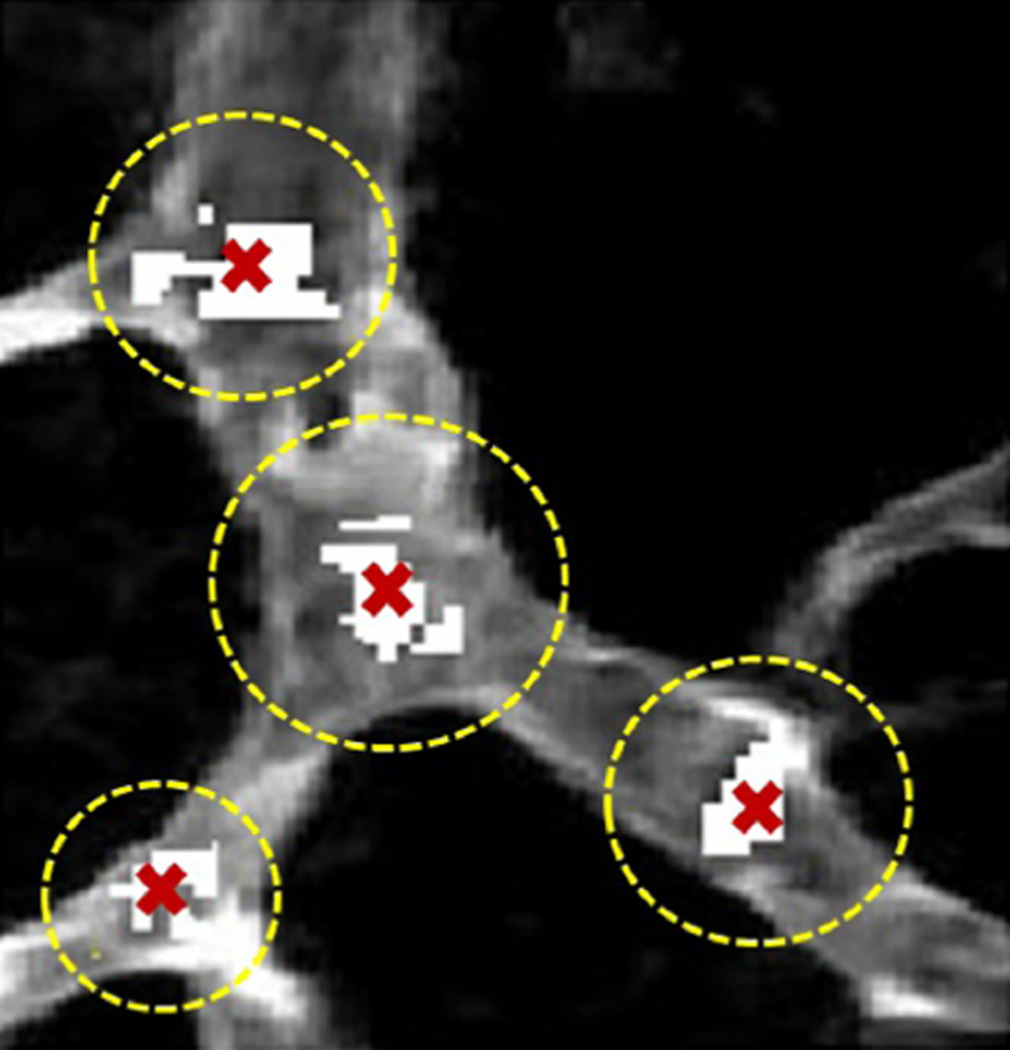
Convexity filtering results in a collection of voxels in the vicinity of each CP. We employ hierarchical agglomerative clustering (Day and Edelsbrunner, 1984) with Euclidean distance as the dissimilarity measure to cluster these voxel collections and take CPs as the clusters’ centroids. An example of this process is shown in Fig. 6 where clusters are indicated by dashed circles and CPs are marked by cross signs. For this instance, agglomerative clustering successfully has distinguished CPs in spite of their patches discontinuity.
Fig. 6.
Detected critical point patches are shown by white pixels overlaid on MIP of a real data. In three out of the four cases we see multiple, disconnected patches that are clearly associated with the same CP. Agglomerative clustering provides a single representation of these patches as the CP shown by a cross mark.
For experiments, the dissimilarity threshold is set equal to the diameter of the vessel to which the voxels belong. This threshold value provides results within an acceptable structural resolution. This method is particularly useful for our application, as it does not require prior knowledge about the number of clusters and forms clusters based entirely on the distances between voxels. Without the clustering, each connected group of voxels would produce a CP resulting in multiple points associated with a single junction or waypoint. Therefore, it provides more robustness to image artifacts that remain even after the binarization and more accuracy in the CPs location.
3.3. Branching node detection
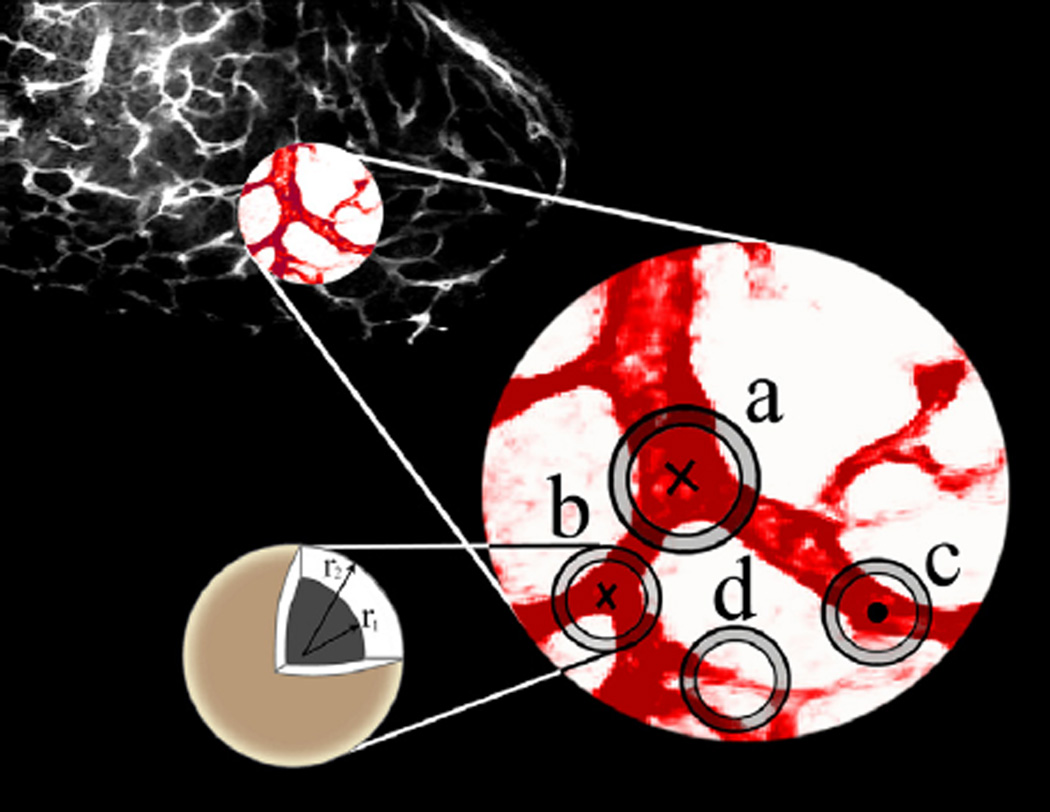
Finally, in preparation for the graph construction considered in Section 4, we separate junctions from waypoints. Given the CPs, junctions will be distinguished from waypoints by an improved version of the spherical shell filtering method employed in (Almasi and Miller, 2013). This approach is based on the geometrical fact that masking of a junction with a concentric 3-D spherical shell, {x|r1 ≤ |x − x0| ≤ r2}) with inner radius, r1, greater than the junction radius, x0 the center of the mask, and r2 the outer radius gives three or more connected components within the shell region. Indeed, in Fig. 7 we see in cases “a” and “b”, the number of connected components is three for nominal junctions with three branches while case “c,” a CP located at a waypoint, would give rise to two connected components.
Fig. 7.
Critical points are divided into junction (crosses) and waypoint (circles) groups based on the number of connected components, darker red regions located on the spherical shells, made by the spherical shell filtering. An example of a non-junction point with three connected components in its masked spherical shell neighborhood is provided in the case “d”. Presence of more than one connected component in the larger sphere causes dismissal of the point from being declared as a junction. (For interpretation of the references to color in this figure legend, the reader is referred to the web version of this article.)
The parameters r1 and r2 are set as ρ and ρ + δρ, where ρ is the nominal vessel radius determined in the convexity filtering step, and δρ is the shell thickness. We find that setting δρ equal to two works well for the problem of interest. Due to the compactness of microvasculature, it is possible that parts of the neighboring vessels will be included in the spherical shell filtering of a given point. This proximity would result in false junction detections caused by a rise in the number of connected components produced by the spherical shell filtering of that point. One instance for this problem is the case “d” in Fig. 7, where the number of masked connected components is three due to the presence of a structure from a neighboring vessel in the spherical shell region. To avoid false junction detection, we only need to ensure that the number of connected components in the larger sphere will not exceed one. After this stage, the collections of junction points and waypoints will be denoted as J = {jk, k = 1, …, nJ} and W = {wl, l = 1, …, nW} where nJ and nW are the number of junctions and waypoints respectively.
3.4. Boundary points
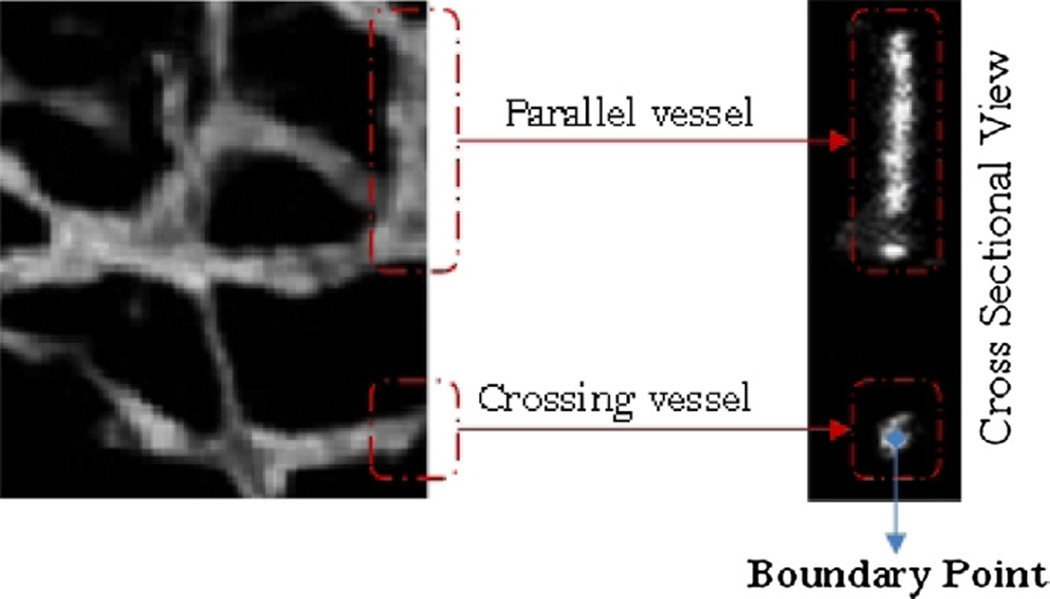
It is necessary to supplement the junction and waypoint sets with an additional set of boundary nodes defined as the center of vessel cross sections at the boundaries of the image. As seen in Fig. 8, such structures are typically circular except in cases where a boundary divides a vessel along its length. To separate these two classes, Frangi’s vesselness measure (Frangi et al., 1998) is used to find the non-vessel shapes and the Eucleadian centers of the resulting regions, signified by R = {ri, i = 1, …, nR} where nR is the number of boundary points are taken as border points. Finally, the CP set is defined to be P = (J ∪ W ∪ R) and its cardinality is nCP = nJ + nW + nR.
Fig. 8.
Front (left) and side (right) view of parallel (upper) and non-parallel (lower) vessel cross sections at the image edge.
4. Graph-based connection mapping
Given the CPs identified in Section 3, we formulate graph-based model identification as a BIP problem. Binary integer programs, which are known to be NP-hard, are a type of linear programming problems with extra requirement that each decision variable can only take on the value of 0 or 1 (Nemhauser and Wolsey, 1988). Indeed, while most BIP problems have a finite number of feasible solutions, this number can grow exponentially with the number of decision variables (Hoffman and Ralphs, 2013). In this paper, we use a “branch and bound” approach to find an optimal solution. The interested reader is referred to (Nemhauser and Wolsey, 1988) for details on this approach.
For the problem considered in this paper, the binary variables represent the possible edges in our vasculature graph. The set of edges is denoted as E = {el, l = 1, 2, …, nE} where is the number of possible edges of a complete graph built from the pair of points from set of CPs. The BIP problem for finding a subset of edges from the complete graph that are to form the microvasculature network model then takes the form
| (2) |
The utility functions, αl, associated with each of the edge variables are defined to quantitatively capture structural qualities from the binarized image such as the degree to which possible edges are localized on and aligned with vessels. The constraint ∑el∈EJi el ≥ 3 ensures that the degree of a junction is greater than or equal to three where EJi is the collection of edges attached to the node ji ∈ J. Similarly, the constraint ∑el∈EWj el = 2 ensures that the degree of a waypoint is strictly equal to two where EWj is the collection of edges attached to the node wj ∈ W.
The utility function αl is defined as
| (3) |
and is comprised of three components of αL,l, αA,l, and αS,l where the subscripts L, A, and S stand for the vessel Localization, vessel Alignment, and Shortcutting degree (to be define below) of each edge. The first element αL,l is intended to provide high utility for edges passing through the microvasculature itself as opposed to the background and is analytically modeled as
| (4) |
where Il is a vector comprising intensities along the edge el in IB, the binary image, and dl is the edge’s Euclidean length. Eq. (4) is motivated by the fact that the microvasculature network is a collection of tubular, or generally, elongated structures. In such networks, an edge either cuts through multiple vessels cross-sections or stands mostly on a vessel. Thus, averaged binary intensities along each edge, , is expected to be around zero for the former or one for the latter cases. The function Hζ(x) defined as 1 if x > ζ and zero else, is required to exclude highly unlikely edges from the computations. This function increases the utility when an edge is located on vascular regions ( increases). Otherwise, the first term goes to zero, indicating that the edge lies mostly on the background voxels with zero intensities. In light of this, we take the threshold ζ as the mean of the two cluster centroids found by k-means (k = 2) clustering of the set over all l.
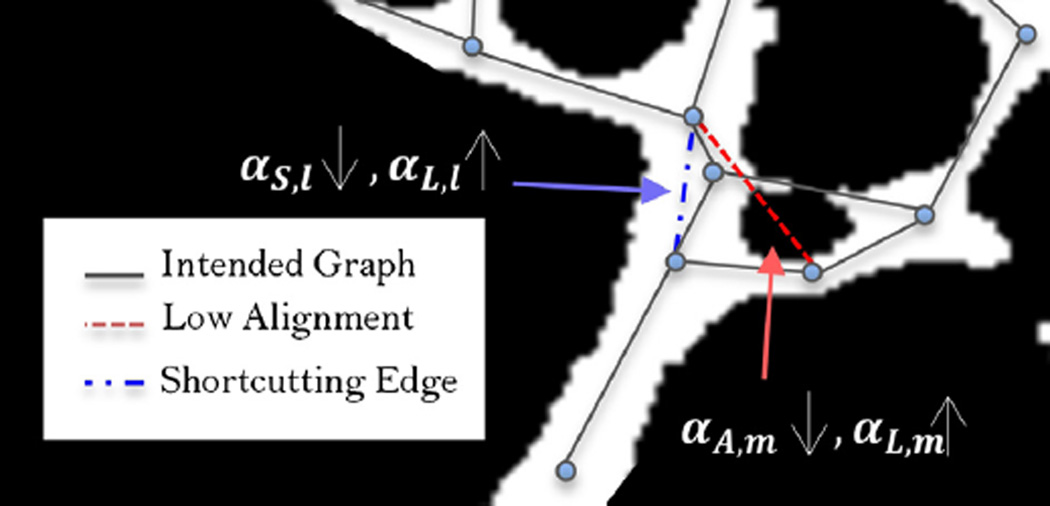
The quantity αA,l is motivated by two factors. First, due to the imperfections of fluorescence microscopy data discussed in Section 1, many smaller vessels manifest as faint and narrow structures in the image such that their accumulative intensity and consequently αL,l are quite small. Also, while the enhancement improves dim vessels’ presentation, it still fails to provide a detailed approximation of the vasculature. Most notably, many vessels remain broken. These structures would be undervalued in terms of αL,l and ultimately missed in the creation of the graph-based model. Second, for large vessels, two nodes that do not belong to the same edge may be located close enough to one another resulting a large αL,l. Such a situation is illustrated in Fig. 9 by means of a dashed red line where the true graph edges are shown by gray solid lines. Here, the directional filtering component is designed specifically to overcome these issues by selecting edges in a manner that reflects the underlying directionality of the structure in the vicinity of the potential edges. This alignment of potential edge with the corresponding vessel ensures accuracy of the final result as an estimation of the skeleton.
Fig. 9.
The motivation of alignment and skeletonness terms is shown as prevention of two cases of red and blue dashed lines that do not best match the microvasculature centerline. These edges are shown on a 2-D binarized frame with the intended graph overlaid by solid gray lines. Although αL,l and αL,m are rather large (edges being majorly located on the foreground), low skeletonness, small αS,l, of the blue line and low alignment with the local structure, small αA,m, of the red line make them undesirable results. (For interpretation of the references to color in this figure legend, the reader is referred to the web version of this article.)
To obtain the local directionality information, we have chosen to employ direction filtering ideas implemented using 3-D steerable filters (Freeman and Adelson, 1991) and define αA,l as
| (5) |
where Estr,l is the energy or Frobenius norm of the directional filter’s output calculated in a tubular region around the lth edge from the binarized image, , with ρ1 and ρ2 being the local vessel radii at two ends of the lth edge computed from IB. The energy measures the alignment of that region of interest (ROI), Īl, in the structure with the edge and is calculated as with
| (6) |
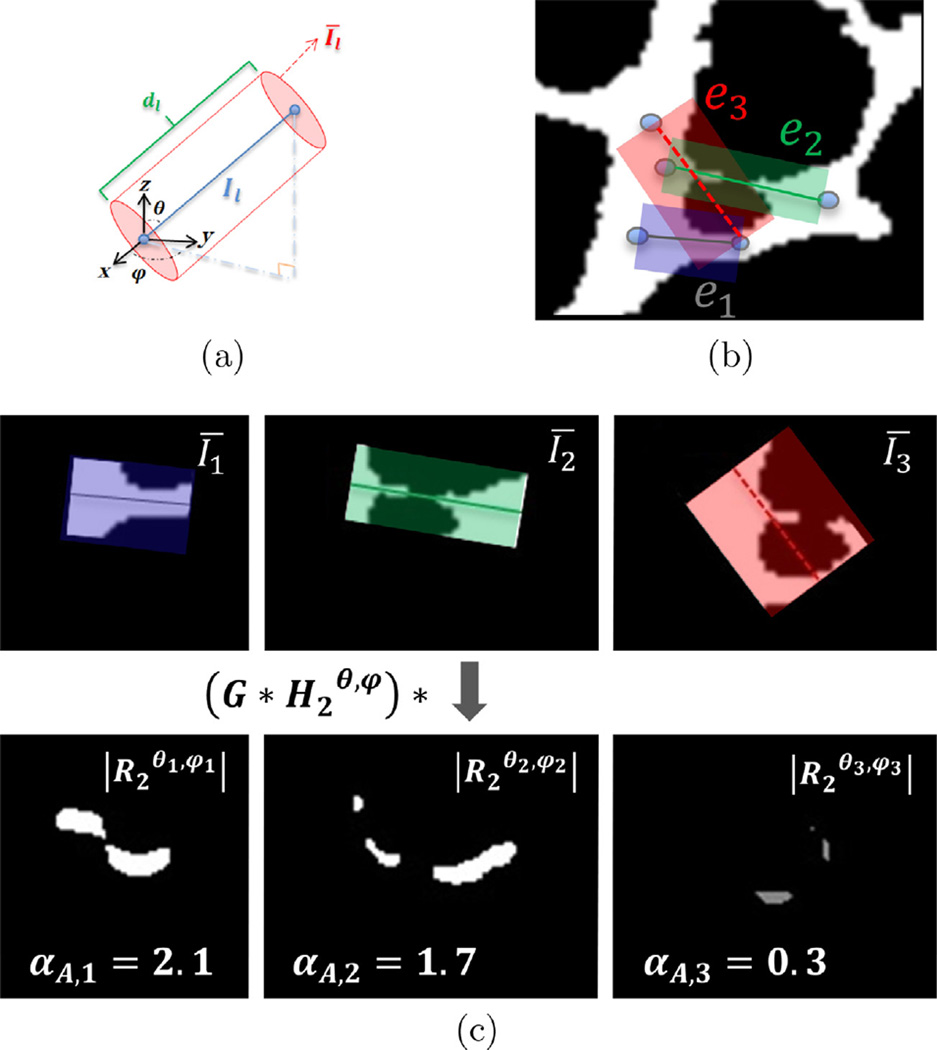
The is calculated by convolving Īl first with a Gaussian kernel with standard deviation σG = 3 to smooth the structure. Then, the result is filtered by , the Hilbert transform of (defined below), in order to map the alignment degree of the vessel boundaries with the direction made by the spherical coordinate pair (θ, ϕ) for each edge as shown in Fig. 10(a). The term refers to the second order directional derivative of a 3-D Gaussian kernel G(x, y, z) = e−(x2+y2+z2) where
| (7) |
Fig. 10.
(a) Spherical coordinates θ and ϕ of edge el along with other terms used for the directional filtering concept are shown in a Cartesian system. (b) An example consisting three different scenarios of the edge layouts on a vascular structure is provided. The utilities of e1 (which clearly passes through a vessel) and e2 (which is well aligned with the local direction of vasculature) are both higher than that of e3 (which is poorly aligned with the vasculature and passes through a good deal of the background). (c) Three ROIs of the edges (top) and the absolute value of the directionally filtered ROIs and their alignment term, αA,l, with respect to each edge’s direction (bottom). The edge e3 that is not aligned with the vasculature in its ROI has the smallest alignment value.
Finally, the αA,l quantity is normalized by the edge length dl for coherency between different edges. Fig. 10(b) shows three edges with different orientations with respect to the vasculature in a 2-D demonstration. The first edge e1 is located on a solid vascular branch. The second edge e2 represents a broken vessel. The last edge, e3, is an incorrect edge unaligned with the structure in its vicinity. Fig. 10(c) provides visual understanding of how αA,l contributes to the graph model extraction by emphasizing the first two examples and penalizing the last case. The ROIs for the three scenarios are shown in the top section of Fig. 10(c). The absolute values of the directionally filtered ROIs with respect to each edge’s direction are plotted and the computed αA,ls are shown in the bottom part of this figure. The filter’s outputs are larger in area and brighter in intensity for the e1 and e2 that are aligned with the vascular structure. The result for the e3 is smaller with lower intensity in comparison to the other edges.
The last component of the edge-based utility function is αS,l. The microvasculature network has a rather high spatial density (compactness) so that it may happen that a prospective edge “shortcuts” a path made by two or more other edges as shown by the blue line in Fig. 9. These types of edges have relatively large αL,l and αA,l that happens to increase their utility and produce spurious and false edges in the resulted graph. The term αS,l defined below penalizes such scenarios
| (8) |
where Cl is the set of two end nodes of the lth edge, ρ is the nominal vessel radius, , Pk is a CP, and G is the Gaussian function defined in the αA,l formulation. By convolving the nodes with a Gaussian (see Fig. 11), Eq. (8) effectively decreases the utility of an edge when either (a) the number of nodes around that edge increases from zero or (b) the distance of other nodes to the edge decreases to less than the vessel radius. In Fig. 11(a), two correct edges with no node in their Gaussian neighborhood are shown. The effect of close nodes to a shortcutting edge’s utility function is schematically shown in Fig. 11(b). The standard deviation of the Gaussian kernel convolving with the edge is selected as one third of the vessel radius so that farther nodes have negligible effect on the inner product.
Fig. 11.
(a) A couple of correct edges with no node in their Gaussian neighborhood. (b) The effect of close nodes to a shortcutting edge’s utility function as the inner product of the node’s and edge’s Gaussian convolution. The standard deviation of the Gaussian kernel is selected such that farther nodes have negligible effect on the shortcutting degree.
5. Experimental results
The utility of the proposed graph-based network model identification algorithm is supported by the experimental results provided in this section. We evaluate the performance of our approach using synthetic and real data. We quantify the performance in terms of the network model detection precision and, in the case of the synthetic data, robustness to noise. The proposed method needs no manual interaction or parameter tuning except for the δρ and σG parameters in the junction detection and directional filtering stages which are set as 2 and 3 respectively. The BIP has been solved by means of the built in MATLAB function “bintprog” that uses the branch and bound method for which the branch variables with the maximum integer infeasibility will be chosen for branching and the node variables with the lowest bound on the objective function will be selected in the search tree.
5.1. Validation metrics
The performance accuracy of the method has been investigated by means of six metrics that are defined to quantitatively measure the similarity degree of the identified network and the ground truth. Both of the geometrical and topological specifications of a curvilinear network are taken into account in definition of these metrics. Four of these metrics, CFPR, CFNR, GFPR, and GFNR, come from the NetMets software package (Mayerich et al., 2012) where CFPR is Topological False Positive Rate defined as
| (9) |
The Topological False Negative Rate, CFNR, is
| (10) |
The metrics, GFPR and GFNR, are defined in the same way as their topological peers except that instead of edge number, they reflect the edge lengths.
| (11) |
| (12) |
Finally, JFPR and JFNR determine the junction detection precision by calculating the following ratios respectively:
| (13) |
| (14) |
5.2. Synthetic image formation
Synthetic images are formed by developing tubular interconnected networks from ground truth graphs inspired by the approaches discussed in (Collins et al., 2011; Fudenberg and Paninski, 2009). First, the ground truth graph is transformed into a binary 3-D volume, S, by means of the Bresenhamn’s line algorithm (Bresenham, 1965). Next, each of the lines in this binary image is dilated with a spherical structuring element of the same diameter as the related vascular branch’s radius. The resulting image is then convolved with a 3-D Gaussian function with standard deviation of two in order to smoothing the boundaries. From these “noise-free” images, simulated data are generated as Poisson(λ0 + N̅q,q,q(x, y, z)). Here N̅q,q,q(x, y, z) is the mean of Nq,q,q(x, y, z) that is a 8-neighborhood of point (x, y, z) with radius q in the noise-free image. Despite the lack of meaningful structures in dark regions of fluorescence microscopy images, voxels of these areas are slightly noisy (Boulanger et al., 2010). We have modeled this background noise by adding an offset amount λ0 in the mean value. Finally, the intensity range is scaled to span the range of seen in real data.
5.3. Simulated data results and discussion
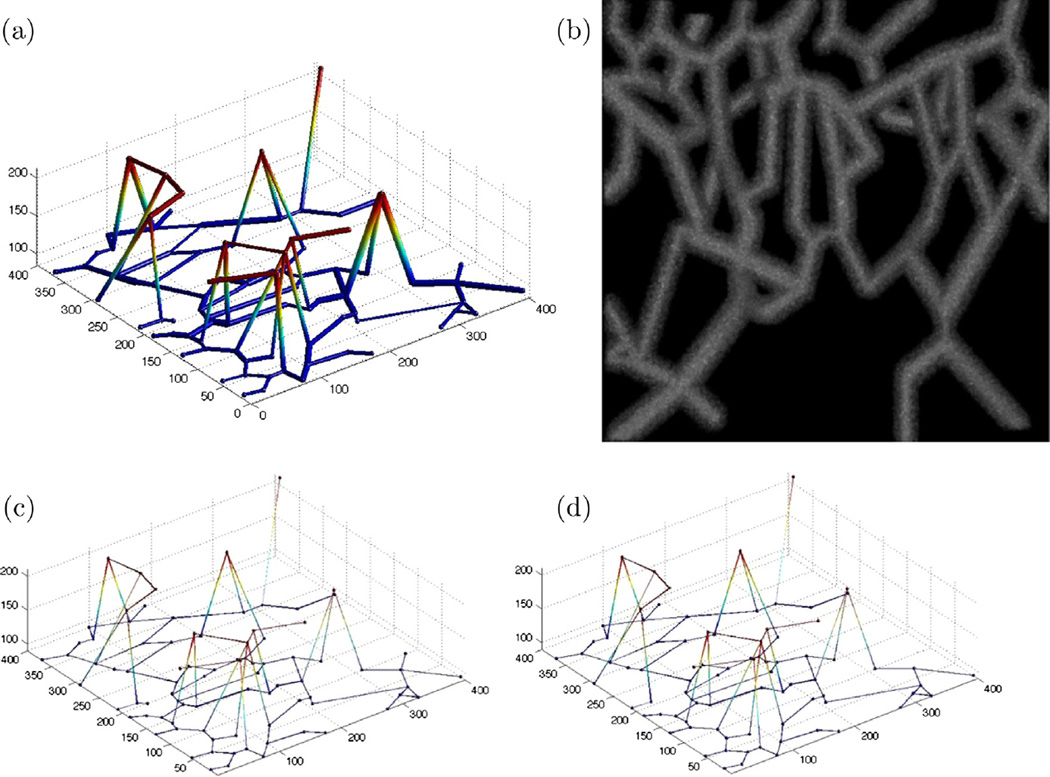
With λ0 = 10 and q = 10, we have generated an image of size 400 × 400 × 200 of a network as shown in Fig. 12(a). We have employed a common approach used in Poisson settings of scaling the maximum intensity in an image for establishing a target PSNR (Bindilatti and Mascarenhas, 2013; Luisier et al., 2011) defined as
| (15) |
with MSE being the mean square error between the clean and noisy images.
Fig. 12.
(a) Synthetic noiseless image, (b) MIP of synthetic noisy image with PSNR = 5 dB, (c) ground truth, and (d) obtained graph-based model of the noisy synthetic dataset.
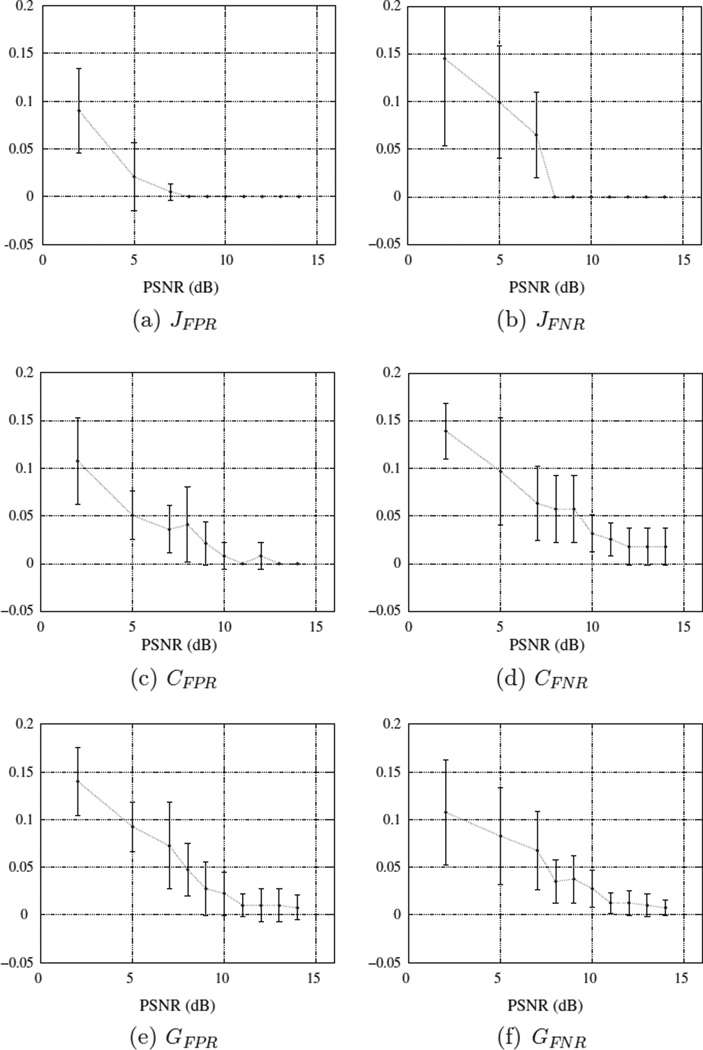
The ground truth and extracted graph model are shown in Fig. 12(c) and (d) for PSNR = 5 dB. The performance metrics are also presented in Table 1. While all the error rates are relatively low, the method’s performance in lower false negative rate of the junctions has shown to be outstanding. Higher false positive error rate in junction detection has given rise to the edge related error rates though they are still small. For the purpose of noise analysis, the noiseless synthetic image has been transformed into 100 volumes where every ten volumes have the same PSNR level. The maximum intensity has been scaled with ten discrete values to the range of (5, 255) such that the PSNRs will fall in the range of 2–15 dBs. Quantitative results are provided in Fig. 13(a)–(f). For lower PSNR values, JFNR is increased noticeably indicating that more junctions are missed by the CP detection method. In such cases, small loops involving thick vessels may be closed as all the junctions around them are transformed into a single junction. Also, thicker branches get closer to each other such that junctions that are located close to them will be omitted by the constraint in the spherical shell filtering. However, we see that JFPR is less impacted by the higher noise levels.
Table 1.
Performance metrics computed for the synthetic data.
| JFPR | JFNR | CFPR | CFNR | GFPR | GFNR | |
|---|---|---|---|---|---|---|
| Synthetic image | 0.082 | 0.013 | 0.042 | 0.047 | 0.059 | 0.043 |
Fig. 13.
Error rate bars of the (a) false positive junction detection, (b) false negative junction detection, (c) false positive topological connections, (d) false negative topological connections, (e) geometrical false positive, and (f) geometrical false negative error rates in terms of their mean and standard deviation computed over ten data volume at ten PSNR levels.
Concerning the metrics CFPR and CFNR shown in Fig. 13(c) and (d), a dependency on the noise level is more obvious. When an image is noisier, its enhanced binary version will be more dilated. The inflation of the structures comes with smoother and less concave boundaries decreasing the convexity degree. Thus, more voxels will not pass the convexity filtering step resulting in missing some of the waypoints. An increase in missed waypoints yields a less complete graph and missed connections as a consequence.
Finally, the results for GFPR and GFNR are presented in Fig. 13(e) and (f). In comparison to the CFPR values, GFPR is slightly larger especially for the lower PSNR values indicating a tendency for detection of longer edges by the method when there are missed junctions. From the analytical perspective, the utilities increase for longer edges since the “skeletonness” of them increases as a result of higher missing nodes. On the other hand, geometrical false negative rates have not deviated from the CFNR rates noticeably, and for a number of PSNRs it is higher than the CFNR. This observation complies with the above statement that the longer edges have greater utilities and consequently shorter edges will be missed with a higher rate.
5.4. Real data
Validation of the proposed algorithm has been completed by applying the method to four sets of 3-D vascular images from murine nervous tissue. Testing datasets were selected such that they show a range of structural and noise properties. To generate these data, heterozygous Plexin-D1-fGFP transgenic mice were used to visualize GFP-expressing developing blood vessels in the embryonic thalamus. All animals were maintained and treated with approved Institutional Review Board protocol according to the National Institutes of Health guidelines and approved by the Institutional Animal Care and Use Committee at Harvard Medical School. Three dimensional vascular images (z-stacks) were acquired using a Leica LSM 510 META confocal microscope in embryonic thalamus. The SNR of images ranges from 3 to 7 dB roughly. Quantitative evaluations of the acquired graphs have been performed based on the ground truth data and computation of the six error metrics. Corresponding results are provided in Table 2.
Table 2.
Performance evaluation of the method in terms of error metrics on real datasets.
| Dataset | NJ − GT | NJ − D | JFPR | JFNR | NE − GT | NE − D | CFPR | CFNR | GFPR | GFNR |
|---|---|---|---|---|---|---|---|---|---|---|
| 1 | 63 | 51 | 0.022 | 0.186 | 164 | 153 | 0.022 | 0.087 | 0.107 | 0.079 |
| 2 | 42 | 36 | 0.016 | 0.163 | 106 | 89 | 0.092 | 0.195 | 0.121 | 0.172 |
| 3 | 176 | 167 | 0.016 | 0.167 | 431 | 429 | 0.058 | 0.091 | 0.084 | 0.061 |
| 4 | 987 | 874 | 0.009 | 0.132 | 2804 | 2567 | 0.053 | 0.126 | 0.146 | 0.094 |
| Average | 0.036 | 0.162 | 0.056 | 0.125 | 0.114 | 0.102 |
5.4.1. Dataset 1
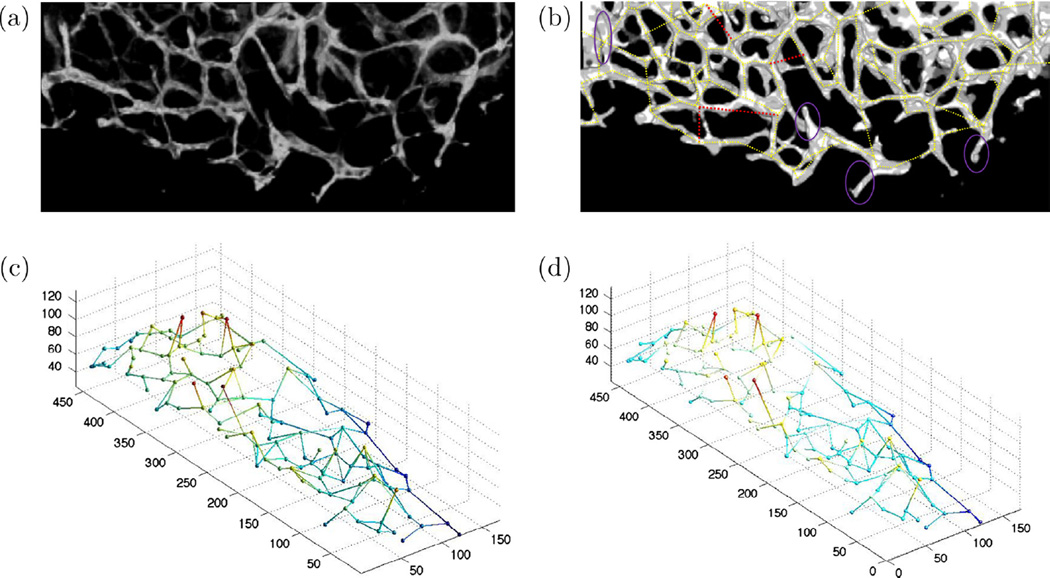
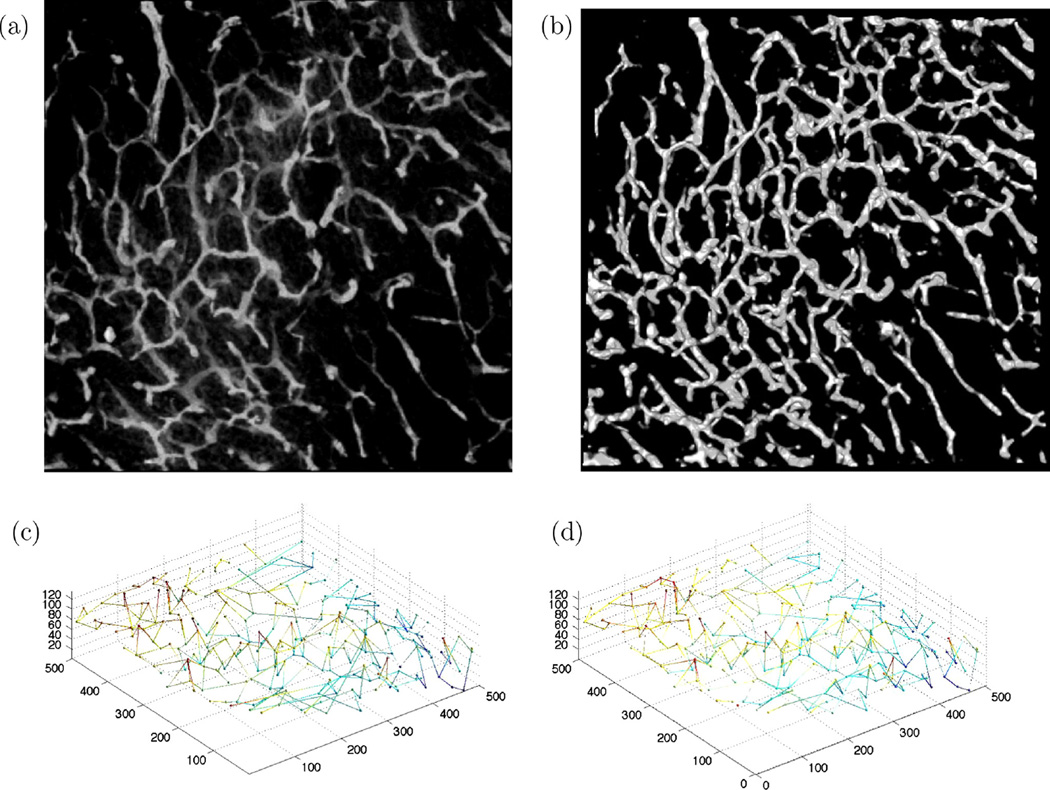
The first image which is of size 200 × 450 × 50 voxels is shown in Fig. 14(a) where the MIP of its binary version with the extracted graph overlaid is shown in Fig. 14(b). The 3-D ground truth graph model is shown in Fig. 14(c). The extracted graph through the BIP method is also shown in Fig. 14(d). The network model identification algorithm has proved to be quite accurate in obtaining the microvasculature’s model. While we generally observe good correspondence between the data and the graph in Fig. 14(b), two types of errors are highlighted. Purple ellipses identify vessels that are missed in the graph because of being connected to an end point rather than a CP. Edges shown in red are topologically correct but their locations are offset on one end. These cases occur when one end node is missed in the CP detection process, yet due to the existence of another CP close to the missing node and the strength of the directional term in the BIP utility funtion, these edges are detected. However, there are a few parts of the less visible and dimmer vessels along with the cut branches that have not been captured by the method. Quantitative measures of the performance are provided in Table 2. The NJ−GT, NJ−D, NE−GT, and NE−GT are the number of junctions and edges in the ground truth and detected graph model here.
Fig. 14.
(a) Maximum intensity projection of dataset 1, a real 3-D fluorescence microscopy image of murine cortical microvasculature, (b) enhanced binary image with illustration of the situations where graph extraction method fails to capture the correct structure. Purple ellipses identify vessels that are missed in the graph, and red edges are topologically correct but their locations are offset on one end, (c) ground truth 3-D graph model, and (d) extracted 3-D graph-based model. (For interpretation of the references to color in this figure legend, the reader is referred to the web version of this article.)
5.4.2. Dataset 2
The second set of real data is from the murine hippocampus and shown in Fig. 15(a). This image is of size 600 × 200 × 24 voxels. In spite of its larger size, the microvasculature has a simpler network layout with smaller density of vessels relative to the other datasets we consider. This image also manifests a different structural shape; specifically, the manner in which it is “bent” along the left side of the image. In order to reproduce this curvature in the vasculature model, there has to be a higher ratio of waypoints to the total CPs number testing the proposed technique from another aspect. Qualitative results for the dataset 2 are presented in Fig. 15(a)–(d). The binary image is shown in Fig. 15(b). The 3-D ground truth and derived graphs are shown in Fig. 15(c) and (d) and the performance measures computed for this dataset are provided in Table 2. The qualitative and quantitative results confirm the satisfactory performance of the method for the dataset 2. Also, the successful detection of CPs and waypoints in particular has resulted in a skeletal model quite close to ground truth.
Fig. 15.
(a) Maximum intensity projection of dataset 2, a real 3-D fluorescence microscopy image of murine hippocampal microvasculature, (b) maximum intensity projection of the binary image, (c) ground truth 3-D graph model, and (d) extracted 3-D graph-based model.
5.4.3. Dataset 3
The next data set relates to a more homogenous microvascular network in terms of vessel shape and size. However, the noise distribution differs markedly throughout the image as apparent from Fig. 16(a). This image is of size 500 × 500 × 45 voxels. The binary image is shown in Fig. 16(b). The ground truth and extracted graphs are presented in Fig. 16(c) and (d) and the quantitative metrics are provided in Table 2. In spite of the noisy voxels remained after binarization, the graph extraction approach we have developed here performs quite well on this challenging data set.
Fig. 16.
(a) Maximum intensity projection of dataset 3, a real 3-D fluorescence microscopy image of murine cortical microvasculature, (b) maximum intensity projection of the binary image, (c) ground truth 3-D graph model, and (d) extracted 3-D graph-based model.
5.4.4. Dataset 4
The last dataset, which is of size 400 × 400 × 50 voxels, incorporates a very dense microvascular network with high noise content apparent in the original and binarized images shown in Fig. 17(a) and (b). The 3-D ground truth and extracted graphs of the upper left quarter part of data are shown in Fig. 17(c) and (d). This data is too large to be processed all at the same time using the BIP approach due to the large number of nodes, 162,735, in the graph. As a result, we only have focused on the results obtained from a quarter of the full data set shown in Fig. 17(d) for this part of experiments. Quantitative results for this part are provided In Table 2.
Fig. 17.
(a) MIP display of dataset 4, (b) MIP of its binarization, (c) ground truth 3-D graph model, and (d) extracted 3-D graph-based model of the upper left quarter of the image.
5.4.5. Computational complexity
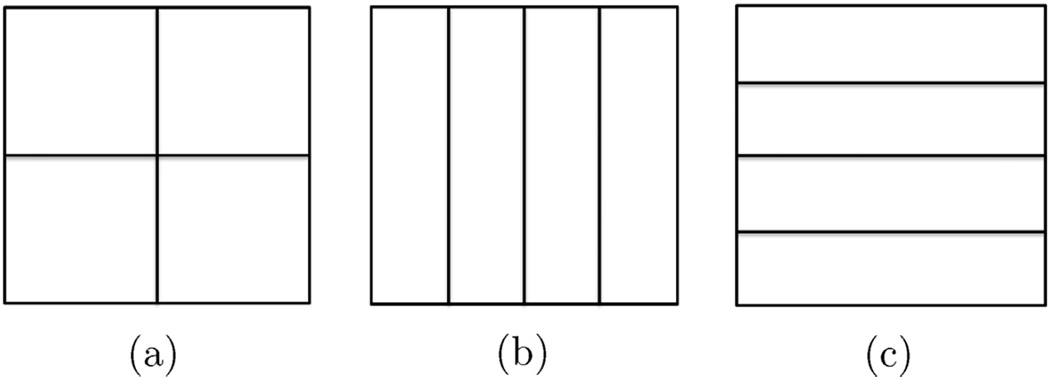
As noted in the previous subsection, large BIPs can be challenging to solve. Here we explore the computational complexity and scalability of the proposed method empirically via testing the run times as a function of problem size. We take the full dataset 4 and consider “uniform”, “horizontal”, and “vertical” tessellations at three scales the coarsest of which is illustrated in Fig. 18 and is comprised of four blocks for each tessellation. At the mid-scale, we have three sets of 16 blocks while the finest decomposition is into three sets of 64 blocks. Note that no division is performed in the third dimension since, as noted in Section 5.4.4, the dimensionality is quite low. All calculations were carried out on a PC platform with 2.53 GHz CPU, 6.00 GB RAM, and 64 bit OS running Matlab.
Fig. 18.
Three tessellations into four blocks using (a) “uniform,” (b) “horizontal,” and (c) “vertical” decompositions.
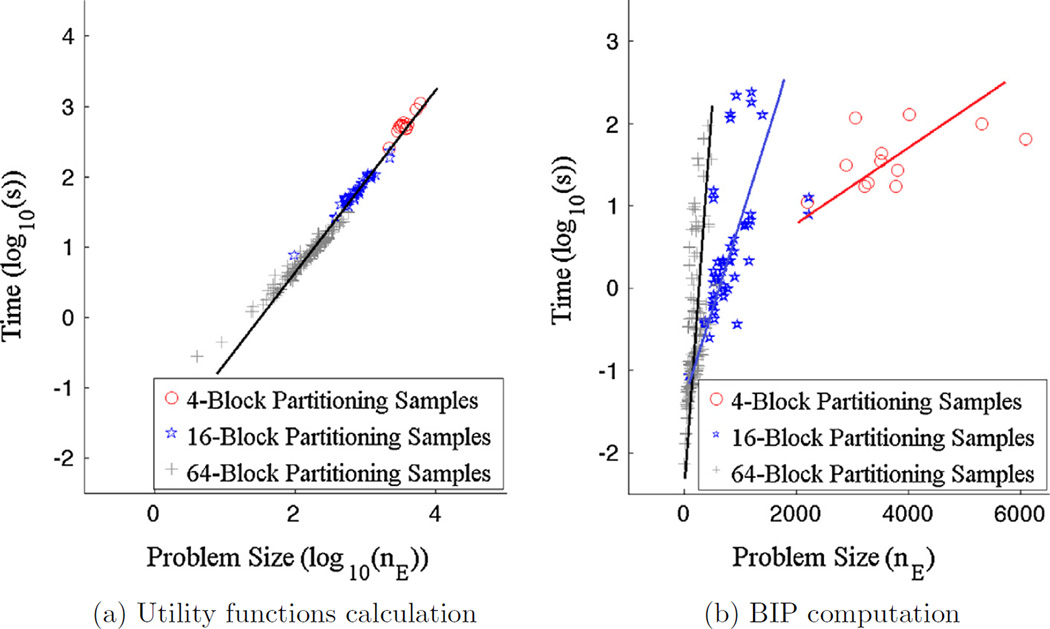
For the algorithm in our paper, there are two components that drive the computational complexity: the calculation of the terms in the utility function for the BIP and the solution of the BIP itself. In Fig. 19(a), we plot the logarithm of the computation time against the logarithm of the problems size for all 192 + 48 + 12 = 252 blocks considered while in Fig. 19(b), the logarithms of the time versus the raw problem sizes are displayed. The linear nature of the relations in these plots indicate that the complexity of the utility function terms is proportional to problem size while, interestingly, the BIP solution processing time appears to rise exponentially with the size of the problem, but in a manner that varies with the scale of decomposition. From these plots, we also see that the processing time for our current implementation of our approach is dominated by the image processing operations required to compute the utility function as opposed to the solver for the BIP. Finally, the results in Fig. 19 also suggest that an approach based on decomposing the full problem into smaller sub-problems and then combining the results may offer a more efficient means of addressing large scale problems. We consider this possibility in Section 6.
Fig. 19.
Logarithm of the computation time for all 192 + 48 + 12 = 252 blocks obtained from 4-block, 16-block, and 64-block partitioning and three different tessellations for (a) utility functions calculation and (b) BIP computation. A log–log plot is presented in (a) where the line indicates complexity rises linearly with problem size for this calculation. A log-linear plot is provided in (b) where the linear structures indicate an exponential nature of the BIP complexity that depends in the scale at which the problem is decomposed.
5.4.6. Parameter sensitivity
Finally, we turn our attention to exploring the sensitivity of the processing results to the non-automatically determined parameters, δρ and σG (the spherical shell thickness and the Gaussian kernel’s standard deviation used in directional filtering). The experiments are completed on each of the sub-images produced by 8 × 8 × 1 partitioning of dataset 4, and error rates are averaged over all the sets. First, performance measures are provided in Table 3 for δρ equal to 1, 2, and 3 given σG = 3. Based on these results, the junction detection precision shows a trade-off between false positive and negative rates when δρ deviates from 2. However, the topological error rates seem to be directly affected by the junctions and consequently the same trade-off as in junction detection performance exists for edge identification process. The GFPR follows the same pattern as CFPR and is smallest at δρ = 2. Therefore, to balance the precision of the method δρ = 2 has been chosen for which both of the false positive and negative rates are in balance.
Table 3.
Performance measures with respect to δρ.
| δρ | JFPR | JFNR | CFPR | CFNR | GFPR | GFNR |
|---|---|---|---|---|---|---|
| 1 | 0.123 | 0.060 | 0.271 | 0.069 | 0.198 | 0.115 |
| 2 | 0.019 | 0.088 | 0.033 | 0.094 | 0.079 | 0.111 |
| 3 | 0.014 | 0.105 | 0.039 | 0.156 | 0.075 | 0.254 |
The results produced by tuning the σG with 2, 3, and 4 have been given in Table 4. Higher σG leads to over-smoothing of the structure where smaller values of σG does not change the image noticeably. Since, this parameter is used in forming the alignment term in the BIP utility function, it only affects the edge-related error rates. Based on the quantitative results, the trade-off also exists for the topological and geometrical false positive and negative rates. Finally, the best error rates are obtained with the δρ = 2 and σG = 3.
Table 4.
Performance measures with respect to σG.
| σG | JFPR | JFNR | CFPR | CFNR | GFPR | GFNR |
|---|---|---|---|---|---|---|
| 2 | 0.019 | 0.088 | 0.039 | 0.112 | 0.061 | 0.130 |
| 3 | 0.019 | 0.088 | 0.033 | 0.094 | 0.079 | 0.111 |
| 4 | 0.019 | 0.088 | 0.090 | 0.075 | 0.123 | 0.095 |
5.4.7. Summary of the real data assessments
The quantitative results provided in Table 2 confirm the precision and sensitivity of the proposed algorithm. The method’s performance is quite strong in correct detection of junctions and edges where the false positive rates for both of these statistics are around 0.036 and 0.056. The method has performed the best in detecting the junctions for dataset 4. The highest false negative rate in junction detection is seen for dataset 1 which is characterized by many dim and broken vessels. Dataset 3 has the next highest rate of missed junctions because of the lack of good connectivity in the vasculature and a larger number of noisy voxels. These noisy voxels if located in the spherical shell will cause junctions to be missed due to the constraint on having one connected component in the larger sphere. In terms of edge detection, datasets 2 has the highest false positive error rate. This is caused first by the fact that a higher number of falsely detected nodes results in higher number of false edges. Second, an increase in the number of waypoints, seen in curvy structures, gives rise to the falsely detected edges. Since GFPR is higher than CFPR for all the datasets, we can conclude that falsely detected edges are mainly of longer length than the average edge lengths. On the other hand, while the false negative rates does not change in correlation with the false positive rates generally, on an absolute scale, they are still relatively low and show the efficiency of the method in identification of the graph model.
Finally, sensitivity of the method’s performance is tested for two non-automatically determined parameters δρ and σG. It has been shown that where δρ as the spherical shell thickness primarily affects the junction detection process, σG only changes the edge-based performance measures.
6. Conclusions and future work
In this work, we have developed an accurate process for skeletal model identification of 3-D microvascular networks and demonstrated its capabilities in the processing of fluorescence microscopy data collected in a murine model. Novel algorithms for critical points detection and graph extraction have been developed that enable the semi-automatic delineation of 3-D interconnected tubular networks. Critical point detection required no prior information about the degree of junctions, direction of branches, or curvature of vessels. A binary integer programming approach was used to identify optimal edges connecting the critical points where optimality was defined in terms of the degree to which possible edges in the graph aligned with and overlapped vessel structure. Exploiting the structural specifications of loopy networks in addition to the local intensity statistics in the design of these algorithms has made them robust to the data imperfections like noise and inhomogeneous illumination that are very common specifically in fluorescence microscopy images. This claim has been empirically verified by the results of experimentations presented in Section 5.
One important area of future work is related to the scalability of the approach. The potential scalability of the algorithm follows from the results in Fig. 19. Indeed, a divide-and-conquer approach could be developed in which a large data set is decomposed into a collection of non-overlapping blocks, networks are identified in each, and then “stitched together” using a bipartite matching method (Conte et al., 2004; Vázquez-Reina, 2012) to connect boundary points (defined in Section 3) across neighboring block faces. With such a decomposition of the problem, all of the blocks could, given sufficient computing resources, be processed in parallel. In this case, the latency of the processing is dictated by the maximum time needed for a given block. For the data and multiple tessellations into blocks considered here, the maximum time over all blocks generated by the 12 four-block divisions of data discussed in Section 5.4.5 was 8542 s. For the forty-eight cases of 16-block partitioning case this number is 5696 s, while the maximum time to process any block from 64-block division was 161 s. Based on these numbers a parallel implementation of the method would likely be scalable. Even where we are limited to processing blocks sequentially, the results are still encouraging. The median time to processing all four blocks one-after-the-other in the twelve cases was 15,149 s. These numbers drop to 1718 s in the 16-block case and 735 s for 64 decompositions. Again, the total run time has greatly been affected by the partitioning as we see it has been reduced by factor of 20.6 from four to 64 partitions. Key to the success of any such approach is the development of an efficient means of combining the block results together. Our initial results of extending the method in (Vázquez-Reina, 2012) indicate that accurate and computationally feasible techniques can be developed. Completing these studies and extending the method developed here to a broader range of tubular identification problems constitutes our primary areas of continued investigation.
Acknowledgments
The authors would like to thank the Enhanced Neuroimaging Core at Harvard NeuroDiscovery Center for helping with confocal imaging. We also thank Dr. Yutaka Yoshida from Cincinnati Childrens Hospital for providing the Plexin-D1-fGFP mouse. This work was supported by the National Science Foundation award 0958345 (S.A. and X.X.), the Goldenson postdoctoral fellowship (A.B.-Z.), the Harvard/MIT Joint Research Grants Program in Basic Neuroscience (X.X., B.L., and C.G.), United States. Finally, we thank the Editor as well as the Reviewers for their many helpful and constructive comments and suggestions that greatly improved this manuscript.
Footnotes
In constructing our vascular graph, these waypoints basically allow for a piecewise linear approximation of the vasculature.
References
- Almasi S, Miller EL. Microvasculature network identification in 3-D fluorescent microscopy images. IEEE International Symposium on Biomedical Imaging (ISBI); San Fransisco. 2013. pp. 444–447. [Google Scholar]
- Aylward SR, Bullitt E. Initialization, noise, singularities, and scale in height ridge traversal for tubular object centerline extraction. IEEE Trans. Med. Imaging. 2002;21:61–75. doi: 10.1109/42.993126. [DOI] [PubMed] [Google Scholar]
- Aylward SR, Jomier J, Weeks S, Bullitt E. Registration and analysis of vascular images. Int. J. Comput. Vision. 2003;55:123–138. [Google Scholar]
- Bindilatti A, Mascarenhas N. A nonlocal poisson denoising algorithm based on stochastic distances. IEEE Signal Process. Lett. 2013;20:1010–1013. [Google Scholar]
- Blinder P, Tsai PS, Kaufhold JP, Knutsen PM, Suhl H, Kleinfeld D. The cortical angiome: an interconnected vascular network with noncolumnar patterns of blood flow. Nat. Neurosci. 2013;16:889–897. doi: 10.1038/nn.3426. [DOI] [PMC free article] [PubMed] [Google Scholar]
- Bogunovic H, Pozo JM, Cárdenes R, San Román L, Frangi AF. Anatomical labeling of the circle of willis using maximum a posteriori probability estimation. IEEE Trans. Med. Imaging. 2013;32:1587–1599. doi: 10.1109/TMI.2013.2259595. [DOI] [PubMed] [Google Scholar]
- Boulanger J, Kervrann C, Bouthemy P, Elbau P, Sibarita JB, Salamero J. Patch-based nonlocal functional for denoising fluorescence microscopy image sequences. IEEE Trans. Med. Imaging. 2010;29:442–454. doi: 10.1109/TMI.2009.2033991. [DOI] [PubMed] [Google Scholar]
- Bresenham JE. Algorithm for computer control of a digital plotter. J. IBM Syst. 1965;4:25–30. [Google Scholar]
- Bullitt E, Aylward SR, Liu A, Stone J, Mukherji SK, Coffey C, Gerig G, Pizer SM. 3D graph description of the intracerebral vasculature from segmented MRA and tests of accuracy by comparison with X-ray angiograms. J. Inform. Process. Med. Imaging. 1999:308–321. [Google Scholar]
- Chan TF, Vese LA. Active contours without edges. IEEE Trans. Image Process. 2001;10:266–277. doi: 10.1109/83.902291. [DOI] [PubMed] [Google Scholar]
- Collins J, Kurcz C, Lisle C, Liu Y, Zudaire E. Assessment of vascular network segmentation. Int. J. Image Process. 2011;4:584–599. [Google Scholar]
- Conte D, Foggia P, Sansone C, Vento M. Thirty years of graph matching in pattern recognition. Int. J. Pattern Recognit. Artif. Intell. 2004;18:265–298. [Google Scholar]
- Day WHE, Edelsbrunner H. Efficient algorithms for agglomerative hierarchical clustering methods. J. Classif. 1984;1:7–24. [Google Scholar]
- Eiho S, Sekiguchi H, Sugimoto N, Hanakawa T, Urayama S. Branch-based region growing method for blood vessel segmentation; Proceedings of International Society for Photogrammetry and Remote Sensing Congress; 2004. pp. 796–801. [Google Scholar]
- Frangi AF, Niessen WJ, Vincken KL, Viergever MA. Multiscale vessel enhancement filtering. Med. Image Comput. Comput.-Assisted Interventation (MICCAI) 1998:130–137. [Google Scholar]
- Freeman WT, Adelson EH. The design and use of steerable filters. IEEE Trans. Pattern Anal. Mach. Intell. 1991;13:891–906. [Google Scholar]
- Fudenberg G, Paninski L. Bayesian image recovery for dendritic structures under low signal-to-noise conditions. IEEE Trans. Image Process. 2009;18:471–482. doi: 10.1109/TIP.2008.2010212. [DOI] [PubMed] [Google Scholar]
- Gulsun MA, Tek H. Robust vessel tree modeling. Med. Image Comput. Comput.-Assisted Intervention (MICCAI) 2008:602–611. doi: 10.1007/978-3-540-85988-8_72. [DOI] [PubMed] [Google Scholar]
- Hoffman KL, Ralphs TK. Encyclopedia of Operations Research and Management Science. US: Springer; 2013. Integer and combinatorial optimization; pp. 771–783. [Google Scholar]
- Homann H. Implementation of a 3D thinning algorithm. J. Insight. 2007 [Google Scholar]
- Jackowski M, Papademetris X, Dobrucki LW, Sinusas AJ, Staib LH. Characterizing vascular connectivity from microCT images. Med. Image Comput. Comput.-Assisted Intervention (MICCAI) 2005:701–708. doi: 10.1007/11566489_86. [DOI] [PubMed] [Google Scholar]
- Jomier J, LeDigarcher V, Aylward SR. Automatic vascular tree formation using the mahalanobis distance. Med. Image Comput. Comput.-Assisted Intervention (MICCAI) 2005:806–812. doi: 10.1007/11566489_99. [DOI] [PubMed] [Google Scholar]
- Kim J, Oh WJ, Gaiano N, Yoshida Y, Gu C. Semaphorin 3E-Plexin-D1 signaling regulates VEGF function in developmental angiogenesis via a feedback mechanism. Genes Dev. 2011;25:1399–1411. doi: 10.1101/gad.2042011. [DOI] [PMC free article] [PubMed] [Google Scholar]
- Kirbas C, Quek F. A review of vessel extraction techniques and algorithms. ACM Comput. Surv. (CSUR) 2004;36:81–121. [Google Scholar]
- Lesage D, Angelini ED, Bloch I, Funka-Lea G. A review of 3D vessel lumen segmentation techniques: models, features and extraction schemes. J. Med. Image Anal. 2009;13:819–845. doi: 10.1016/j.media.2009.07.011. [DOI] [PubMed] [Google Scholar]
- Li H, Yezzi A. Vessels as 4-D curves: global minimal 4-D paths to extract 3-D tubular surfaces and centerlines. IEEE Trans. Med. Imaging. 2007;26:1213–1223. doi: 10.1109/tmi.2007.903696. [DOI] [PubMed] [Google Scholar]
- Luisier F, Blu T, Unser M. Image denoising in mixed Poisson–Gaussian noise. IEEE Trans. Image Process. 2011;20:696–708. doi: 10.1109/TIP.2010.2073477. [DOI] [PubMed] [Google Scholar]
- Mahadevan V, Narasimha-Iyer H, Roysam B, Tanenbaum HL. Robust model-based vasculature detection in noisy biomedical images. IEEE Trans. Inform. Technol. Biomed. 2004;8(3):360–375. doi: 10.1109/titb.2004.834410. [DOI] [PubMed] [Google Scholar]
- Mayerich D, Bjornsson C, Taylor J, Roysam B. NetMets: software for quantifying and visualizing errors in biological network segmentation. J. BMC Bioinform. 2012;13:1–19. doi: 10.1186/1471-2105-13-S8-S7. [DOI] [PMC free article] [PubMed] [Google Scholar]
- Megalooikonomou V, Barnathan M, Kontos D, Bakic PR, Maidment AD. A representation and classification scheme for tree-like structures in medical images: analyzing the branching pattern of ductal trees in X-ray galactograms. IEEE Trans. Med. Imaging. 2009;28:487–493. doi: 10.1109/TMI.2008.929102. [DOI] [PMC free article] [PubMed] [Google Scholar]
- Nemhauser GL, Wolsey LA. Integer and Combinatorial Optimization. Vol. 18. New York: Wiley; 1988. [Google Scholar]
- Olabarriaga SD, Smeulders AW. Interaction in the segmentation of medical images: a survey. J. Med. Image Anal. 2001;5:127–142. doi: 10.1016/s1361-8415(00)00041-4. [DOI] [PubMed] [Google Scholar]
- Olabarriaga S, Breeuwer M, Niessen W. Minimum cost path algorithm for coronary artery central axis tracking in CT images. Med. Image Comput. Comput.-Assisted Intervention (MICCAI) 2003:687–694. [Google Scholar]
- Otsu N. A threshold selection method from gray-level histograms. IEEE Trans. Syst., Man, Cybernet. 1979;9(1):62–66. [Google Scholar]
- Pisupati C, Wolff L, Mitzner W, Zerhouni E. A central axis algorithm for 3D bronchial tree structures; IEEE International Symposium on Computer Vision; 1995. pp. 259–264. [Google Scholar]
- Qian X, Brennan MP, Dione DP, Dobrucki WL, Jackowski MP, Breuer CK, Sinusas AJ, Papademetris X. A non-parametric vessel detection method for complex vascular structures. Med. Image Anal. 2009;13(1):49–61. doi: 10.1016/j.media.2008.05.005. [DOI] [PMC free article] [PubMed] [Google Scholar]
- Rittscher J, Machiraju R, Wong ST. Microscopic Image Analysis for Life Science Applications. Artech House. 2008 [Google Scholar]
- Sage D. 2014 < http://bigwww.epfl.ch/sage/soft/localnormalization/>. [Google Scholar]
- Sarder P, Nehorai A. Deconvolution methods for 3-D fluorescence microscopy images. IEEE Signal Process. Mag. 2006;23:32–45. [Google Scholar]
- Suri JS, Liu K, Reden L, Laxminarayan S. A review on MR vascular image processing algorithms: acquisition and prefiltering: part I. IEEE Trans. Inform. Technol. Biomed. 2002;6:324–337. doi: 10.1109/titb.2002.804139. [DOI] [PubMed] [Google Scholar]
- Tsai PS, Kaufhold JP, Blinder P, Friedman B, Drew PJ, Karten HJ, Patrick DL, Kleinfeld D. Correlations of neuronal and microvascular densities in murine cortex revealed by direct counting and colocalization of nuclei and vessels. J. Neurosci. 2009;29:14553–14570. doi: 10.1523/JNEUROSCI.3287-09.2009. [DOI] [PMC free article] [PubMed] [Google Scholar]
- Türetken E, González G, Blum C, Fua P. Automated reconstruction of dendritic and axonal trees by global optimization with geometric priors. J. Neuroinform. 2011;9:279–302. doi: 10.1007/s12021-011-9122-1. [DOI] [PubMed] [Google Scholar]
- Türetken E, Benmansour F, Andres B, Pfister H, Fua P. Reconstructing Loopy Curvilinear Structures Using Integer Programming. CVPR. 2013 doi: 10.1109/TPAMI.2016.2519025. [DOI] [PubMed] [Google Scholar]
- Vázquez-Reina AA. Segmentation Strategies for Connectomics. Medford, USA: Tufts University; 2012. [Google Scholar]
- Wang L, Li C, Sun Q, Xia D, Kao CY. Active contours driven by local and global intensity fitting energy with application to brain MR image segmentation. Comput. Med. Imaging Graph. 2009;33:520–531. doi: 10.1016/j.compmedimag.2009.04.010. [DOI] [PubMed] [Google Scholar]
- Yan P, Kassim AA. MRA image segmentation with capillary active contours.Med. Image Anal. 2006;10(3):317–329. doi: 10.1016/j.media.2005.12.002. [DOI] [PubMed] [Google Scholar]


