Abstract
Aim
Colesevelam lowers glucose and low-density lipoprotein cholesterol levels in patients with type 2 diabetes mellitus. This study examined the mechanisms by which colesevelam might affect glucose control.
Methods
In this 12-week, randomized, double-blind, placebo-controlled study, subjects with type 2 diabetes and haemoglobin A1c(HbA1c) ≥7.5% on either stable diet and exercise or sulphonylurea therapy were randomized to colesevelam 3.75 g/day (n = 16) or placebo (n = 14). Hepatic/peripheral insulin sensitivity was evaluated at baseline and at week 12 by infusion of 3H-labelled glucose followed by a 2-step hyperinsulinemic–euglycemic clamp. Two 75-g oral glucose tolerance tests (OGTTs) were conducted at baseline, one with and one without co-administration of colesevelam. A final OGTT was conducted at week 12. HbA1c and fasting plasma glucose (FPG) levels were evaluated pre-and post-treatment.
Results
Treatment with colesevelam, compared to placebo, had no significant effects on basal endogenous glucose output, response to insulin or on maximal steady-state glucose disposal rate. At baseline, co-administration of colesevelam with oral glucose reduced total area under the glucose curve (AUCg) but not incremental AUCg. At week 12, neither total AUCg nor incremental AUCg were changed from pre-treatment values in either group. Post-load insulin levels increased with colesevelam at 30 and 120 min, but these changes in total area under the insulin curve (AUCi) and incremental AUCi did not differ between groups. Both HbA1c and FPG improved with colesevelam, but treatment differences were not significant.
Conclusions
Colesevelam does not affect hepatic or peripheral insulin sensitivity and does not directly affect glucose absorption.
Keywords: bile acid sequestrant, colesevelam, glucose, insulin sensitivity, type 2 diabetes mellitus
Introduction
Colesevelam hydrochloride (Welchol®; Daiichi Sankyo, Parsippany, NJ, USA) is a non-absorbed polymer that binds bile acids in the intestine, impeding their reabsorption. It was approved in 2000 for lowering low-density lipoprotein cholesterol in patients with primary hyperlipidaemia [1]. In 2008, based upon the results of three pivotal clinical studies [2–4], the US Food and Drug Administration expanded colesevelam’s indication to include improvement in glycaemic control in adults with type 2 diabetes mellitus in combination with metformin-, insulin-, or sulphonylurea-based therapy [1].
While the clinical effects of colesevelam on glycaemic control in patients with type 2 diabetes are now well established, its mechanism of action for glucose lowering remains undefined. Knowledge of the mechanism of action is important for defining the role of colesevelam among anti-diabetes agents available for use in patients with type 2 diabetes. Potential mechanisms include effects on glucose production, glucose disposal, glucose absorption and insulin secretion. To address these potential mechanisms, a 12-week, randomized, double-blind, placebo-controlled study was conducted. A 3H-glucose infusion followed by a two-step hyperinsulinemic–euglycemic clamp was used to evaluate the effect of colesevelam on basal endogenous glucose output (EGO), primarily from the liver, and its sensitivity to suppression by insulin, as well as its effects on peripheral glucose disposal during conditions of maximal suppression of hepatic glucose output. To evaluate glucose and insulin responses, an oral glucose tolerance test (OGTT) was administered before and after 12 weeks of treatment. As colesevelam is an intestinally active drug, the possibility that it might impede the absorption of glucose was also examined by monitoring glucose levels before and after acute co-administration of 3.75 g of colesevelam with a 75-g oral glucose challenge.
Materials and Methods
Subjects
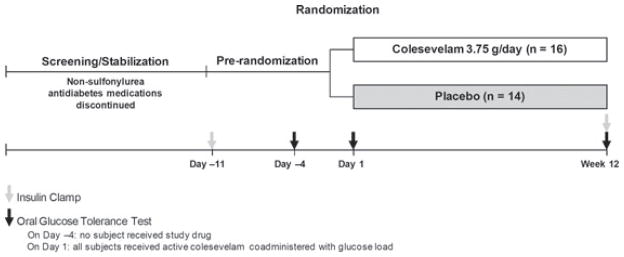
Subjects included males and females aged 18–75 years, diagnosed with type 2 diabetes for ≥3 months, with a haemoglobin A1c (HbA1c) of ≥7.5% (prior to pre-randomization procedures), and a body mass index of 25–45 kg/m2, inclusive. The study included a screening period of up to 18 weeks (during which all non-sulphonylurea anti-diabetes treatments were withdrawn), a pre-randomization period of approximately 12 days, followed by a randomized treatment period of 12 weeks (figure 1). During the screening period, if a subject was on a submaximal dose of a sulphonylurea and had ≥2 fasting glucose measurements of ≥240 mg/dl (13.3 mmol/l), then the sulphonylurea dose was up-titrated and the subject was re-evaluated in 1 week. If the subject had ≥2 consecutive fasting glucose measurements of ≥240 mg/dl (13.3 mmol/l), while receiving the maximal sulphonylurea dose, then the subject was discontinued from the study.
Figure 1.
Study design. All subjects received colesevelam 3.75 g co-administered with the glucose load on day 1.
Exclusion criteria included triglycerides ≥500 mg/dl (5.7 mmol/l; prior to pre-randomization procedures); thyroid-stimulating hormone ≤0.10 mIU/l or ≥10 mIU/l; history of allergic/toxic reaction to colesevelam, dysphagia, swallowing disorders, intestinal mobility disorders or gastrointestinal functional disorders; lipid- or blood pressure-lowering therapy that had not been stable for ≥3 months (prior to randomization); treatment with colesevelam, cholestyramine or colestipol; chronic treatment with oral corticosteroids; or use of any investigational drug within 30 days of randomization. Hormone therapy (oral contraceptives, hormone replacement and thyroid replacement) was permitted, provided a stable dose had been maintained for ≥30 days (prior to screening) and dosage changes were not anticipated during the study.
Study Design
This 12-week, randomized, double-blind, placebo-controlled, parallel-group study (ClinicalTrials.gov identifier: NCT00147 745) was conducted at two sites in the USA. Approvals from the respective Institutional Review Boards were obtained, and the study was conducted in accordance with the Declaration of Helsinki and in compliance with Good Clinical Practice Guidelines. All subjects provided written informed consent before participation.
On day 1 (after completion of the OGTT), subjects were randomized 1 : 1 to unmarked colesevelam 3.75 g/day or matching placebo. Colesevelam and placebo were both administered orally (either three tablets with the noon and evening meals, or six tablets with the evening meal).
Compliance was evaluated by counting unused tablets (for colesevelam and placebo). All standard clinical laboratory tests were performed by a certified clinical pathology laboratory (PPD Global Central Laboratories, Highland Heights, KY, USA). Insulin and free fatty acid levels for samples obtained during the two-step hyperinsulinemic–euglycemic clamp were measured at the Core Laboratory (Albert Einstein School of Medicine, Bronx, NY, USA). Insulin sensitivity was evaluated on day −11 (pre-randomization) and at week 12 by infusion of 3H-labelled glucose followed by a two-step hyperinsulinemic–euglycemic clamp. All clamp studies were conducted at the Special Diagnostic and Treatment Unit, VA San Diego Healthcare System and at the University of Alabama Birmingham using the Participant and Clinical Interaction Resource in the Center for Clinical and Translational Science.
Hyperinsulinemic–Euglycemic Clamp
A two-step hyperinsulinemic–euglycemic clamp [5] with infusion of 3H-glucose was used to assess hepatic and peripheral insulin sensitivity. The labelled glucose infusion allowed for assessment of EGO, derived from dilution of the 3H-glucose by endogenous glucose. The extent of suppression of EGO by exogenous insulin was then evaluated at low and high rates of exogenous insulin infusion. In the first step of the clamp, a low-dose submaximal insulin infusion rate (60 mU/m2/min) was used for 180 min, while in the second step, a high-dose insulin infusion rate (120 mU/m2/min) was used for an additional 120 min to maximally suppress EGO and maximally stimulate the peripheral glucose disposal rate (GDR). GDR was calculated from the rate of exogenous glucose infusion at steady state to provide a measure of peripheral insulin sensitivity. Glucose-specific activity (D-[3-3H]) was measured before and every 20 min during the clamp, while glucose and insulin were measured periodically.
EGO was calculated as follows:
where: Ra(t) = endogenous glucose appearance; SAp = specific activity of plasma (T/G, μCi/mg); p = fraction of glucose pool, that is, effectively mixed; V = total glucose distribution volume (dl/kg); SAg = specific activity of exogenous glucose infusate (μCi/mg); G = plasma glucose concentration (mg/dl); GINF(t) = glucose infusion rate; dSAp(t)/d(t) = derivative of specific activity with respect to time [6].
Oral Glucose Tolerance Test
During the OGTT, samples were collected at −30, −15, 0, 30, 60, 90, 120 and 180 min following ingestion of a 75-g glucose load to evaluate glucose and insulin levels. The Matsuda Insulin Sensitivity Index, another measure of whole-body insulin sensitivity, was calculated from fasting and post-OGTT glucose and insulin concentrations [7]. The Matsuda Index is the constant value 10 000 divided by the square root of the product of fasting glucose, fasting insulin, mean OGTT glucose concentration and mean OGTT insulin concentration:
The areas under the glucose curve (AUCg) and insulin curve (AUCi) were calculated using the trapezoidal rule. OGTTs were conducted on day −4 (baseline; prior to treatment), day 1 (pre-treatment/randomization) and at week 12. To determine whether colesevelam had acute effects on glucose kinetics or absorption, the glucose load on day 1 was co-administered with colesevelam 3.75 g and the AUCg was compared with the AUCg from the day −4 OGTT that was performed with subjects having received no study medication. At week 12, an OGTT was administered to assess the chronic effect of colesevelam on insulin sensitivity (from change in Matsuda Index from day −4) and glucose absorption [as determined by comparison of the change in AUCg from day −4 to week 12 (following 12 weeks of treatment with colesevelam)]. At week 12, the study drug was not administered at the same time as the OGTT (morning) but rather was taken according to the standard dosing regimen (three tablets each with noon or evening meals or six tablets with evening meal).
Efficacy Parameters
The primary efficacy parameters were the change in EGO and peripheral GDR from baseline to week 12. Secondary efficacy parameters included the change in Matsuda Index from baseline to week 12; evaluation of the acute effect of colesevelam (based on change in AUCg from day −4 to day 1); evaluation of the chronic effect of colesevelam (based on change in AUCg from day −4 to week 12); change in HbA1c from baseline to week 12; and change in fasting plasma glucose (FPG) from baseline to weeks 4, 8 and 12.
Safety Evaluation
Safety assessments included the incidence and severity of adverse events (AEs), as well as changes in vital signs, weight and clinical laboratory tests. Relationships between AEs and study medication were assessed by individual study investigators.
Statistical Methods
Baseline variables, pre-randomization assessments and demographic characteristics were summarized for the randomized population, which included all subjects who signed a consent form and were assigned a randomization number. The summary population was used in the analyses of all efficacy parameters and included all randomized subjects who received treatment and had a baseline and ≥1 post-randomization assessment of an efficacy parameter. The safety population included all subjects who signed a consent form and had a safety assessment on or after day −4.
An analysis of covariance model with treatment administered as a fixed effect and baseline as a covariate was applied. The treatment difference between the colesevelam and placebo groups in change from baseline to week 12 for EGO and GDR was evaluated by least-squares (LS) means and standard errors, two-tailed 95% confidence intervals and two-sided p-values. Last post-randomization observation carried forward was the imputation method for HbA1c and FPG.
Results
Subject Disposition and Baseline Characteristics
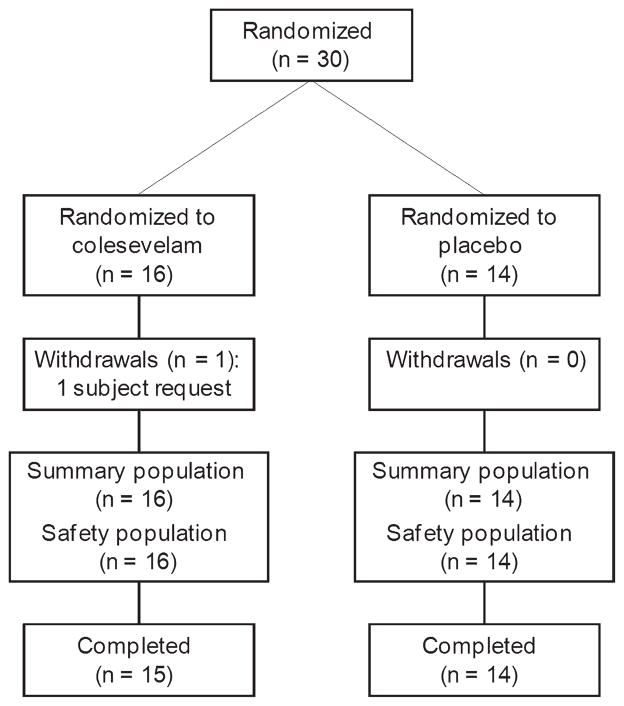
Thirty subjects were randomized: 16 to colesevelam and 14 to placebo (figure 2). In total, 29 subjects (97%) completed the study. The treatment groups were comparable with respect to demographic characteristics (Table 1). Overall mean compliance with study medication was 88% for colesevelam and 91% for placebo.
Figure 2.
Subject disposition.
Table 1.
Demographic and baseline characteristics (randomized population).
| Characteristics* | Colesevelam (n = 16) | Placebo (n = 14) |
|---|---|---|
| Age (years) | 55.7 (9.6) | 54.0 (10.3) |
| Gender, n (%) | ||
| Male | 12 (75) | 8 (57) |
| Female | 4 (25) | 6 (43) |
| Race, n (%) | ||
| Caucasian | 8 (50) | 9 (64) |
| Black | 5 (31) | 3 (21) |
| Hispanic | 1 (6) | 2 (14) |
| Other | 2 (13) | 0 (0) |
| Height (cm) | 171.7 (9.7) | 168.6 (6.6) |
| Weight (kg) | 98.6 (16.7) | 95.8 (15.8) |
| BMI (kg/m2) | 33.7 (6.77) | 33.7 (5.78) |
| HbA1c (%) | 8.2 (0.82) | 8.5 (0.81) |
| FPG (mg/dl) | 162.6 (36.3) | 207.9 (65.9) |
BMI, body mass index; FPG, fasting plasma glucose; HbA1c, glycosylated haemoglobin.
All data are presented as mean (standard deviation) unless otherwise stated.
Efficacy
Hyperinsulinemic–Euglycemic Clamp
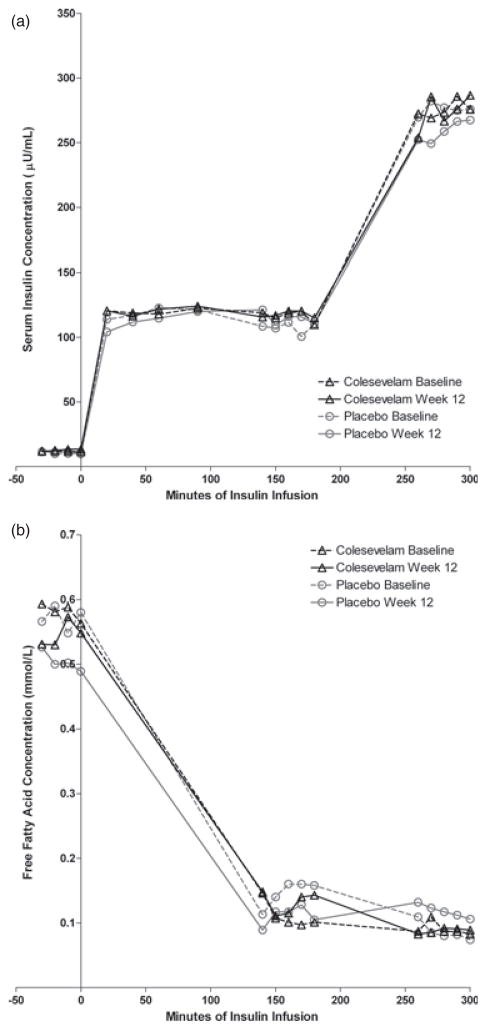
Mean insulin concentrations during the hyperinsulinemic–euglycemic clamp procedures are shown in figure 3a. The insulin concentrations were proportional to the infusion rates, and did not change from baseline in either treatment group. As shown in figure 3b, free fatty acid concentrations were decreased during insulin infusions to the same extent in both treatment groups and there were not significant changes in either group from pre-treatment values.
Figure 3.
(a) Serum insulin concentrations during the insulin clamp studies. (b) Free fatty acid concentrations during the insulin clamp studies.
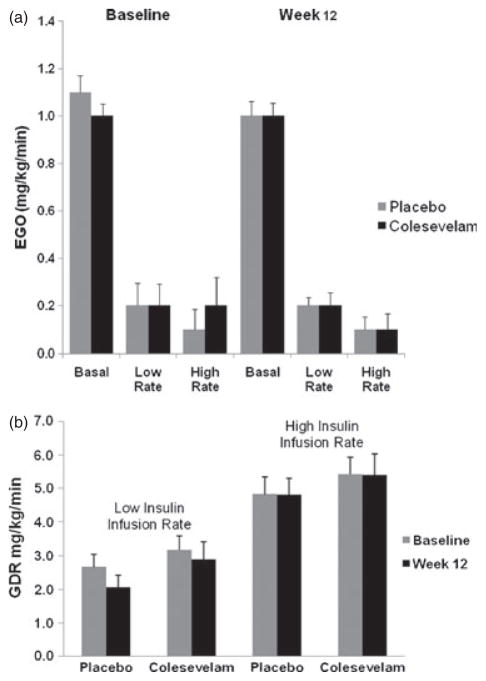
Basal EGO was similar in the placebo and colesevelam groups at baseline (1.1 ± 0.25 and 1.0 ± 0.20 mg/kg/min, respectively). After 12 weeks of treatment, the LS mean change from baseline in EGO was minimal in both the placebo group (−0.02 ± 0.05 mg/kg/min) and the colesevelam group (−0.06 ± 0.06 mg/kg/min) and did not differ between the treatment groups (LS mean treatment difference: −0.04 ± 0.07 mg/kg/min; p = 0.581; figure 4a). Changes in EGO were not correlated with changes in HbA1c or FPG in either treatment group or overall.
Figure 4.
(a) Rates of endogenous glucose output in the basal state and during the low-rate (60 mU/m2/min) and high-rate (120 mU/m2/min) insulin infusions. Results are shown for the placebo and colesevelam groups at baseline and after 12 weeks of randomized treatment. Vertical lines indicate standard errors. (b) Rates of glucose disposal during the low-rate (60 mU/m2/min) and high-rate insulin infusion (120 mU/m2/min). Results are shown for the placebo and colesevelam groups at baseline and after 12 weeks of randomized treatment. Vertical lines indicate standard errors.
The effect of low- and high-dose infusion of exogenous insulin on EGO is shown in figure 4a. During the low-dose insulin infusion, EGO was decreased by approximately 80% in both the placebo and colesevelam group. The LS mean change from baseline to week 12 in EGO during the low-dose insulin infusion was −0.16 and −0.08 mg/kg/min for the placebo and colesevelam groups, respectively. The difference in LS mean change between the treatment groups (0.08 mg/kg/min) was not statistically significant (p = 0.204). Similar results were obtained during the high-dose insulin infusion. The LS mean change from baseline to week 12 in EGO during the high-dose insulin infusion was −0.11 mg/kg/min for the placebo group and −0.06 mg/kg/min for the colesevelam group, resulting in a non-significant treatment difference of 0.04 mg/kg/min (p = 0.550). EGO during the high-dose insulin infusion was low in both treatment groups at baseline and at week 12, indicating almost complete suppression of EGO in both groups with no difference as a result of treatment.
As shown in figure 4b, the GDR, measured during the low-and high-rate insulin infusion, was essentially unchanged from baseline at week 12 in both the placebo and colesevelam group (0.06 ± 0.38 and 0.08 ± 0.40 mg/kg/min, respectively); the treatment difference was not significant. Changes in GDR did not correlate with changes in HbA1c in either treatment group. However, changes in GDR were correlated with changes in FPG in the colesevelam group (R2 = −0.29; p = 0.04), although not in the placebo group (data not shown).
Oral Glucose Tolerance Tests
All subjects underwent an OGTT on day −4 (before the start of randomized treatment). On day 1, all subjects received 3.75 g of colesevelam co-administered with the OGTT, regardless of the treatment group to which they were randomized. On day 1, the AUCg decreased from day −4 by 38.4 mg·h/dl (p = 0.036). FPG was slightly, but significantly, lower on day 1 compared to day −4 at −30, −15, 0, 30, 60 and 120 min (p < 0.05 for all), although not at 180 and 240 min. Mean insulin concentrations were similar on day −4 and day 1 at all time points, and AUCi was unchanged. At week 12, all subjects underwent another OGTT; however, colesevelam was not co-administered with the OGTT but rather was taken via the usual schedule later in the day. There was no clinically meaningful change in AUCg or AUCi within either treatment group, and the treatment difference was not significant.
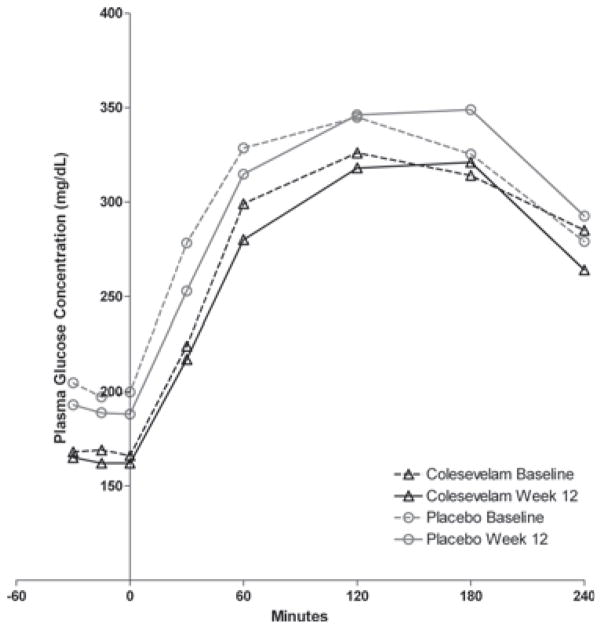
At week 12, the mean insulin concentration in the placebo group before and after the OGTT did not change from day −4 at any time point (figure 3a). In contrast, the mean post-OGTT insulin concentration was significantly greater in the colesevelam group at 30 min (26.0 ± 12.5 vs. 22.9 ± 10.7 mU/ml; p = 0.01) and 120 min (40.7 ± 24.9 vs. 30.8 ± 27.4 mU/ml; p = 0.03) at week 12 compared with day −4 (figure 3a). However, the treatment difference was not significant. In addition, there was also a small, but significant decrease in incremental glucose at 30 min in the colesevelam group compared with the placebo group (p = 0.027). Figure 5 shows the plasma glucose following the OGTT for both treatment groups at baseline and week 12.
Figure 5.
Plasma glucose concentrations following the oral glucose tolerance test. Results are shown for the placebo and colesevelam groups at baseline and after 12 weeks of randomized treatment.
At week 12, the LS mean change from baseline in Matsuda index was 0.04 [(mg/dl)(mIU/ml)]−1 with placebo and −0.26 [(mg/dl)(mIU/ml)]−1 with colesevelam, resulting in a non-significant treatment difference of −0.29 [(mg/dl)(mIU/ml)]−1 (p = 0.324).
Glycaemic Parameters
Although the LS mean change in HbA1c from baseline to week 12 was 0.16% with placebo and −0.29% with colesevelam, the treatment difference (−0.45%) was not statistically significant (p = 0.229). The LS mean change in FPG from baseline to week 12 was 13.4 mg/dl (0.7 mmol/l) with placebo and −2.9 mg/dl (0.2 mmol/l) with colesevelam; the treatment difference was not statistically significant [−16.4 mg/dl (0.9 mmol/l); p = 0.502].
Safety
During the study, 28 subjects reported an AE: 10 subjects (71%) in the placebo group and 14 subjects (88%) in the colesevelam group. A summary of AEs is listed in Table 2. No subject experienced a serious AE, and no subject discontinued from the study due to an AE or a laboratory abnormality. With regard to drug-related AEs, three subjects (21%) reported headache in the placebo group, while six subjects (38%) reported constipation in the colesevelam group. Abnormalities in electrocardiogram that were not observed at baseline and were judged to be possibly related to the study drug were observed in four subjects in the placebo group (two with QT prolongation, two with T-wave inversion) and two subjects in the colesevelam group (T waves). All other drug-related AEs were experienced by fewer than two subjects/treatment group.
Table 2.
Summary of adverse events (safety population).
| Adverse events, n (%) | Colesevelam (n = 16) | Placebo (n = 14) |
|---|---|---|
| Subjects with AEs | 14 (88) | 10 (71) |
| Subjects with drug-related AEs | 10 (63) | 8 (57) |
| Severity of AEs | ||
| Mild | 9 (56) | 9 (64) |
| Moderate | 5 (31) | 1 (7) |
| Severe | 0 (0) | 0 (0) |
| Deaths | 0 (0) | 0 (0) |
| Subjects with SAEs | 0 (0) | 0 (0) |
| Subjects discontinued because of AEs | 0 (0) | 0 (0) |
AE, adverse event; SAE, serious adverse event.
There was a discrepancy among the treatment groups in the proportions of subjects with a newly occurring or worsening abnormality in alanine aminotransferase (ALT). Two of 16 subjects (13%) in the colesevelam group, and 0 of 14 subjects (0%) in the placebo group experienced a new elevation or an exacerbation of an elevated ALT level. All the elevations in ALT were modest, and none exceeded two times the upper limit of normal (25 mU/ml). The percentages of subjects in each treatment group with newly occurring or worsening abnormalities in haematology laboratory parameters were similar.
Changes in diastolic blood pressure, systolic blood pressure and weight from baseline were similar among treatment groups and not clinically significant. All treatment groups had an increase in mean heart rate from baseline to the study endpoint, but there were no differences between groups.
Discussion
This study explored mechanisms to explain the glucose-lowering effect of colesevelam. EGO was examined in the basal state and at low and high doses of exogenous insulin infusion. Maximally stimulated GDR was measured during the high-rate insulin infusion. The study was powered to detect relatively large changes in these parameters, as might be expected with other drugs that affect insulin sensitivity. Limitations of this study include the small number of subjects and the relatively modest effect of colesevelam on HbA1c and FPG levels. The effect on HbA1c and FPG, while in the direction of improvement with colesevelam and consistent in magnitude with those observed in larger studies, was not statistically significant.
The results of this study do not support a significant effect of colesevelam on either peripheral or hepatic insulin sensitivity. The lack of effect on GDR is in agreement with another study with colesevelam using a one-step hyperinsulinemic–euglycemic clamp [8]; however, in that study, there was a small, but significant, increase in the Matsuda index, suggesting some effect on insulin sensitivity.
When colesevelam was co-administered with the oral glucose load during the OGTT (day 1), there was a small (approximately 4%), but statistically significant, decrease in the post-OGTT AUCg compared to day −4, when no drug was administered. The fasting glucose levels, however, were also decreased compared to day −4, and this accounted for the difference in AUC. The reason for this decrease in fasting levels is unclear but may represent adaptation of subjects to study conditions. Therefore, it does not appear that co-administration of colesevelam with the OGTT had any significant, immediate impact upon the post-OGTT glucose levels. This is consistent with the results in the study by Schwartz et al. after a meal tolerance test [8].
In this study, post-OGTT AUCg and AUCi values were unaltered after 12 weeks of treatment with colesevelam. Post-OGTT insulin concentrations were increased at 30 and 120 min compared to pre-treatment levels in the colesevelam group, but not in the placebo group. There was no difference, however, between the treatment groups in glucose or insulin concentrations or in the changes in these parameters from pre-treatment levels. Similarly, neither the change in incremental AUCg nor the change in incremental AUCi differed between the treatment groups.
Colesevelam treatment was safe and well tolerated by subjects with type 2 diabetes. No unexpected safety issues were noted, and all AEs were mild or moderate in severity. No subject had a serious AE or discontinued from the study because of an AE. The most common AE in the colesevelam group was constipation.
As there was no strong indication of insulin action at the level of the liver and muscle, the current data underscore the need to consider alternative mechanisms underlying the glucose-lowering effect of colesevelam. Recent mechanism studies suggest that the gut may play a pivotal role in glucose lowering and that sequestration of bile acids in the intestine may alter responses in bile acid receptors in the intestine or liver. Bile acids bound to colesevelam may affect TGR5, a G-protein-coupled receptor in the intestine that is involved in the release of the incretin glucagon-like peptide-1 (GLP-1) from L cells [9]. Another bile acid sequestrant, colestimide, has been shown to increase postprandial GLP-1 levels [10]. In addition, Nakatani et al. noted that there were increases in the concentration of primary bile acids, together with elevations in GLP-1 and gastric inhibitory polypeptide (GIP) levels in patients who had undergone bariatric surgery; the change in primary bile acid levels was positively correlated with the change in GIP and serum immunoreactive insulin levels [11]. These findings suggest that primary bile acids might enhance GIP secretion, which in turn would increase insulin secretion.
Colesevelam could also exert an incretin effect by altering the delivery of nutrients within the small intestine. It has recently been hypothesized that bile acid sequestration delays absorption of long-chain fatty acids by disrupting micelle formation. The appearance of unabsorbed long-chain fatty acids in the ileum may stimulate the G-protein-coupled receptor GPR40, which is involved in the release of GLP-1 and GIP [12,13].
In this study, colesevelam had modest but not statistically significant effects upon HbA1c and FPG levels, which is similar to those observed in larger studies. Changes in EGO and GDR, however, were small and not statistically significant, and, in general, did not correlate with changes in HbA1c and FPG levels. Similarly, the OGTT data did not provide evidence for major effects upon glucose or insulin. These findings may possibly suggest that the effects of colesevelam are mediated through pathways independent of insulin. Additional studies are needed to elucidate the mechanism of action.
Acknowledgments
This study was sponsored by Daiichi Sankyo Inc. Editorial assistance was provided by Karen Stauffer, PhD, of inScience Communications, a Wolters Kluwer business. This assistance was performed in compliance with Good Publication Practices outlined by the International Committee of Medical Journal Editors and was funded by Daiichi Sankyo Inc. Support is acknowledged in San Diego from the VA San Diego Healthcare System, Department of Veteran Affairs, Veterans Medical Research Foundation, the Diabetes Education and Research Center DK 063491, and the General Clinical Research Center MO1 RR-00827. Support is acknowledged from the University of Alabama Birmingham from the Center for Clinical and Translational Science (UL1 RR02577) and the Diabetes Research and Training Center (P60 DK079626).
Footnotes
Conflict of Interest
R. R. Henry and S. Mudaliar participated in the design and execution of the study, interpretation of data and development of the manuscript. V. R. Aroda and W. T. Garvey participated in the execution of the study, interpretation of data and development of the manuscript. H. S. Chou participated in the interpretation of data and development of the manuscript. M. R. Jones participated in the design of the study, interpretation of data and development of the manuscript. All authors have seen and approved the final version of the manuscript.
R. R. Henry received funds for this project through the Veterans Medical Research Foundation. V. R. Aroda has nothing to declare. S. Mudaliar is a consultant to Daiichi Sankyo Inc. and also receives research funds, which are paid to the Veterans Medical Research Foundation. W. T. Garvey serves on advisory boards for Daiichi Sankyo Inc., Vivus and Liposcience. W. T. Garvey receives honoraria as a member of the speaker’s bureau for Merck and Abbott Nutrition and also participates in research trials funded by Merck and Amylin. H. S. Chou and M. R. Jones are employees of Daiichi Sankyo Inc., the study sponsor.
References
- 1.Daiichi Sankyo Inc. Welchol (colesevelam hydrochloride) US prescribing information. Parsippany, NJ: Daiichi Sankyo Inc; 2010. [Google Scholar]
- 2.Bays HE, Goldberg RB, Truitt KE, Jones MR. Colesevelam hydrochloride therapy in patients with type 2 diabetes mellitus treated with metformin: glucose and lipid effects. Arch Intern Med. 2008;168:1975–1983. doi: 10.1001/archinte.168.18.1975. [DOI] [PubMed] [Google Scholar]
- 3.Fonseca VA, Rosenstock J, Wang AC, Truitt KE, Jones MR. Colesevelam HCl improves glycemic control and reduces LDL cholesterol in patients with inadequately controlled type 2 diabetes on sulfonylurea-based therapy. Diabetes Care. 2008;31:1479–1484. doi: 10.2337/dc08-0283. [DOI] [PMC free article] [PubMed] [Google Scholar]
- 4.Goldberg RB, Fonseca VA, Truitt KE, Jones MR. Efficacy and safety of colesevelam in patients with type 2 diabetes mellitus and inadequate glycemic control receiving insulin-based therapy. Arch Intern Med. 2008;168:1531–1540. doi: 10.1001/archinte.168.14.1531. [DOI] [PubMed] [Google Scholar]
- 5.DeFronzo RA, Tobin JD, Andres R. Glucose clamp technique: a method for quantifying insulin secretion and resistance. Am J Physiol. 1979;237:E214–E223. doi: 10.1152/ajpendo.1979.237.3.E214. [DOI] [PubMed] [Google Scholar]
- 6.Finegood DT, Bergman RN, Vranic M. Estimation of endogenous glucose production during hyperinsulinemic-euglycemic glucose clamps. Comparison of unlabeled and labeled exogenous glucose infusates. Diabetes. 1987;36:914–924. doi: 10.2337/diab.36.8.914. [DOI] [PubMed] [Google Scholar]
- 7.Matsuda M, DeFronzo RA. Insulin sensitivity indices obtained from oral glucose tolerance testing: comparison with the euglycemic insulin clamp. Diabetes Care. 1999;22:1462–1470. doi: 10.2337/diacare.22.9.1462. [DOI] [PubMed] [Google Scholar]
- 8.Schwartz SL, Lai YL, Xu J, et al. The effect of colesevelam hydrochloride on insulin sensitivity and secretion in patients with type 2 diabetes: a pilot study. Metab Syndr Relat Disord. 2010;8:179–188. doi: 10.1089/met.2009.0049. [DOI] [PubMed] [Google Scholar]
- 9.Katsuma S, Hirasawa A, Tsujimoto G. Bile acids promote glucagon-like peptide-1 secretion through TGR5 in a murine enteroendocrine cell line STC-1. Biochem Biophys Res Commun. 2005;329:386–390. doi: 10.1016/j.bbrc.2005.01.139. [DOI] [PubMed] [Google Scholar]
- 10.Suzuki T, Oba K, Igari Y, et al. Colestimide lowers plasma glucose levels and increases plasma glucagon-like PEPTIDE-1 (7–36) levels in patients with type 2 diabetes mellitus complicated by hypercholesterolemia. J Nippon Med Sch. 2007;74:338–343. doi: 10.1272/jnms.74.338. [DOI] [PubMed] [Google Scholar]
- 11.Nakatani H, Kasama K, Oshiro T, Watanabe M, Hirose H, Itoh H. Serum bile acid along with plasma incretins and serum high-molecular weight adiponectin levels are increased after bariatric surgery. Metabolism. 2009;58:1400–1407. doi: 10.1016/j.metabol.2009.05.006. [DOI] [PubMed] [Google Scholar]
- 12.Ahren B. Islet G protein-coupled receptors as potential targets for treatment of type 2 diabetes. Nat Rev Drug Discov. 2009;8:369–385. doi: 10.1038/nrd2782. [DOI] [PubMed] [Google Scholar]
- 13.Hofmann AF. Bile acids: trying to understand their chemistry and biology with the hope of helping patients. Hepatology. 2009;49:1403–1418. doi: 10.1002/hep.22789. [DOI] [PubMed] [Google Scholar]


