

Abstract
The dense connectivity in the brain and arrangements of cells into circuits means that one neuron’s activity can influence many others. To observe this interconnected system comprehensively, an aspiration within neuroscience is to record from as many neurons as possible at the same time. There are two useful routes toward this goal: one is to expand the spatial extent of functional imaging techniques, and the second is to use animals with small brains. Here we review recent progress toward imaging many neurons and complete populations of identified neurons in small vertebrates and invertebrates.
Introduction
Brain function relies on complex interactions between large populations of neurons across many brain areas. To build an understanding of the complete system, it may be necessary to observe neural activity across large fractions of the brain. Ideally then, one would aspire to obtain full spatiotemporal access to the whole brain at cellular and millisecond resolution. Since this is currently impossible, neuroscientific studies have to rely on recordings from relatively small numbers of neurons covering limited fractions of the entire brain. Although impressive progress has been made using this strategy, an alternative approach is to study small systems, where larger fractions of the intact brains can be studied at once. Animals with small brains might have a more limited behavioral repertoire than larger mammals, which may reduce the set of phenomena one can study in those animals; on the other hand, they might be easier to understand, although complexity appears to exist on every level of even small neural systems [1,2]. That said, the practical attraction to small brains is the ease of recording from a greater fraction of the constituting neurons, so that fewer stones are left unturned in the search for mechanism. In the past few years, optical imaging techniques have increased both in temporal and spatial capabilities [3–13], kindling the hope that the combination of large-scale imaging, small brains of genetic model organisms and tools including optogenetics, computational techniques and connectomics [14,15] may accelerate the process of uncovering general principles of the workings of animal brains (Fig. 1).
Figure 1. Schematic of large-scale imaging, analysis and perturbation methods.
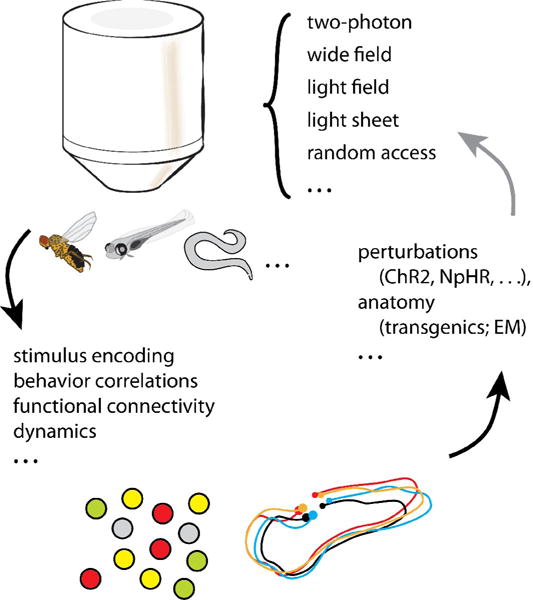
Many imaging techniques can be used for imaging neuronal activity at the population up to whole-brain level. Small brains have the advantage of fitting in the field of view of a microscope objective, and allowing orthogonal access for light-sheets. Analysis methods can be used for finding functional anatomical structure (left) and investigating neuronal dynamics (right). Optogenetic perturbations, genetic lesions and other manipulations, as well as anatomical characterization, may follow the insights gained from analysis of large-scale imaging data.
Here we review several imaging techniques that have been used to advance our understanding of different aspects of brain function, including sensorimotor processing [5,16–20], learning [21], sensation [16,22–26] and the development of functional circuits [27]. This review is not meant to be exhaustive but designed to give an idea of the past and potential applications of large-scale imaging techniques.
Knowledge of the behavioral repertoire is a crucial determinant for which questions can be studied in a given model system. The behavioral repertoire of the small species discussed here is relatively unknown, so to match the question to the model organism it is important to push for a more comprehensive understanding of their behavioral repertoire[28]. In the following we will briefly discuss various activity indicators, give an overview of established small model organisms and then discuss the respective advantages of various imaging technologies. We will conclude with a brief discussion of emerging model organisms and future perspectives.
Activity indicators and imaging techniques
Optical methods for recording neural activity depend on the sensitivity of the indicators of neural activity. The past years have seen dramatic improvements in genetically encoded calcium indicators [29], increasing the extent to which single action potentials can be decoded from calcium signals. In addition, new genetically encoded voltage sensors are under development [30–32], making it possible to record action potentials as well as subthreshold voltage signals in cell bodies and their processes. Neural communication is mediated by neurotransmitters, for which indicators are also being developed, such as the glutamate sensor iGluSnFR [33]. With the development of these genetically encoded indicators, the power of microscopy methods for neuroscience will continue to increase.
How are these activity indicators imaged in three dimensions? Two-photon microscopy [3] is the workhorse of neuronal imaging, and has been used in many neuroscience model organisms. The key feature to two-photon imaging is that only a single point in space is excited, reducing photobleaching from extraneous excitation, and increasing depth penetration, making it extremely useful for imaging at scales from the synapse level [34] to the whole-brain level [4,5,17]. Scanning a two-photon excitation point through a three dimensional volume can be slow, but techniques exist for speeding up this process to enable fast three-dimensional two-photon imaging. These methods include resonant scanning, high-speed random-access imaging using acousto-optical deflectors [6,7,35], simultaneous multi-point excitation [11] and temporal focusing [4]. Although these techniques sample the volume sparsely, along a continuous line or at a discrete set of points, they can sample in three dimensions. Advantages of these methods is that their depth penetration is good; they use only one objective; and the infrared excitation light is mostly invisible to the animals. Applications of these methods to small animal brains has so far been limited, but a combination of structured illumination and volume projection microscopy [11] has been used in zebrafish at high speeds (30 Hz) and shown to uncover consistent temporal sequences of activity in several dozens of points distributed in three dimensions across the brain.
Light-sheet imaging is a volumetric imaging method that, like two-photon imaging, relies on local excitation of the tissue, but with a line or a plane instead of a point, speeding up volumetric imaging by one or two orders of magnitude [9,10,36] while retaining high spatial resolution. One or more excitation objectives, orthogonal to the detection objective, guide a thin “pencil” or a thin “sheet” of light that scans through the sample, while a detection objective images the illuminated plane, achieving high spatial resolution and fairly good temporal resolution. In zebrafish this method can image about 3 brain volumes of 100,000 neurons per second, likely to increase in the future. The advantage of volumetric imaging fast enough to track calcium indicator dynamics is that far-away neurons are imaged at the same time, so that joint activity of populations of neurons can be interrogated – spontaneously or in response to a given stimulus or task. In addition, data rates are high, so that experimental throughput is increased.
Light field imaging [8,12] is a fast volumetric imaging technology that relies on microlens optics and deconvolution algorithms to reconstruct an imaged volume from two-dimensional images, so that for any image taken with the camera, a volume of imaged tissue can be approximated. The spatial resolution is lower than two-photon or light-sheet imaging, but the temporal resolution is limited only by the camera and photon count. Grosenick et al. used this technique to image from zebrafish [13] and mammalian brains (L. Grosenick, M. Broxton, K. Deisseroth, personal communication), and Prevedel et al. [8] used this technique to image from entire C. elegans and zebrafish brains. This technique may be especially useful for three-dimensional voltage imaging due to its high temporal resolution.
The above is not an exhaustive survey of three-dimensional imaging techniques, and other methods exist and are under development. In combination with advances in protein engineering and computational methods, further developments of microscopy techniques will generate more detailed and comprehensive datasets and a better understanding of the richness of network dynamics.
Small-brained genetic model organisms
Out of the many small-brained animal species, including Xenopus [37], the crab stomatogastric ganglion [2], the leech [38], Aplysia [39], medaka fish[40], bees[41], locusts[42], and others, three in particular have become genetic model organisms widely used in neuroscience – the fruit fly, the zebrafish and the worm. Drosophila melanogaster occupies a unique place in neuroscience primarily because of its extensive genetic toolkit. Primarily through the GAL4-UAS system [43] and large libraries of GAL4 lines [44], it is a routine matter to label, silence, excite or otherwise modify defined populations of neurons in flies. The fly has long been used for genetic studies of behaviors such as circadian rhythms [45], but more recent studies demonstrate fairly complex behaviors such as aggression[46] and place learning[47]. Combining these features with virtual reality setups [20] makes for a powerful system for large-scale imaging during behavior. The larva has the advantage of a small nervous system and quite an extensive behavioral repertoire and has also been used for calcium imaging [48,49].
Zebrafish or Danio rerio is a vertebrate genetic model organism that benefits from being transparent, making it straightforward to image large populations of neurons [5,17,24,50] without requiring any surgery to access the brain. Although genetic tools are less developed than in the fruit fly, the GAL4-UAS system has been successfully applied [51,52] and many developments are ongoing. Immobilized preparations allow for the study of behaviors such as the optokinetic response [17,24,53], motor adaptation [5,54], associative learning[21] and locomotion [55]. This model organism is especially useful for large-scale three-dimensional imaging techniques[8,10,13] which will be discussed below.
The nematode Caenorhabditis elegans is a small, transparent organism with a well-developed genetic toolkit. This animal has 302 neurons (the hermaphrodite), and its connectome has been mapped [56], which is of great utility to neuroscientific studies [1]. Its relatively slow and smooth locomotion allow for imaging and manipulation of freely moving animals at the single-cell level [8,57–59]. Its behavioral repertoire includes non-associative and associative learning [60], exploration-exploitation switching [61] and other behaviors, the neural underpinnings of which can be studied in great detail using the tools available for this animal.
Neural imaging small brains
Having briefly covered the prevalent model organisms and techniques discussed in this review, we turn to some examples of how the combination of these tools and animals has been used to gain insight into neural processing.
The combination of microscopy, genetic tools and virtual-reality systems for tethered Drosophila makes this animal a powerful model organism within systems neuroscience. These tools have been used by Seelig and Jayaraman [20] to investigate sensorimotor processing in an area in the central complex of the fly. Arborizations of ring neurons in this area (Fig. 2a) are thought to be part of a sensorimotor processing network that may subserve behaviors such as navigation [47]. The authors mapped visual responses in this population and found responses specific to different points in space (Fig. 2b), with orientation and in some cases direction tuning. Using a virtual reality setup for tethered flies (Fig. 2c) [62,63], it was additionally found that visual responses could be modulated by the locomotive state of the animal, so that visual responses were suppressed during flight. Although the number of neurons recorded from was moderate, the importance of this approach is that the recorded neurons form a complete, and genetically defined population. This provides valuable constraints on the problem of understanding what this population of central neurons is doing.
Figure 2. Two-photon imaging in Drosophila.
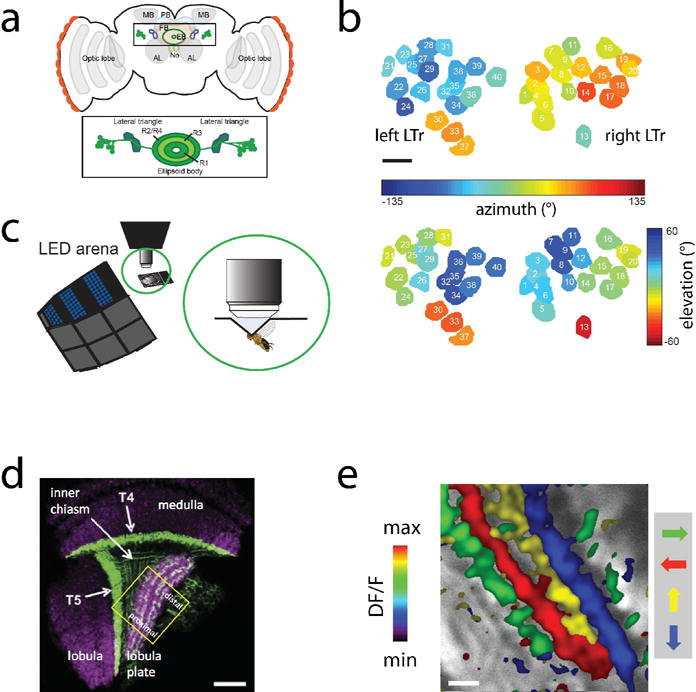
a. Anatomical structures in Drosophila central complex. LTR, lateral triangle neurons, whose glomeruli were recorded from in the ellipsoid body (EB). b. Spatial tuning of glomeruli responses. The responses were also tuned to orientation and sometimes direction (not shown). c. Virtual reality setup for flying Drosophila, which was used to study modulation of visual responses in the EB during flight. Scale bar: 5 micrometers. d. Anatomy of part of the visual system of Drosophila. Directional responses were studied in the lobula plate. Scale bar: 20 micrometers. e. Responses in lobula plate neurpil are directionally tuned. Scale bar: 5 micrometers. Panels a,b,c adapted with permission from Seelig and Jayaraman (2013) and c,d from Maisak et al. (2014).
Similar approaches have been used by Maisak et al. [22], and Strother et al. [23] for mapping visual responses along the motion pathway of the Drosophila visual system. Using both cell-type specific Gal4 lines and panneuronal GCaMP5G expression, the authors discovered layer-specific processing of visual inputs. In the medulla, visual input was found to be separated into parallel light-off and light-on pathways. These parallel pathways are then combined in the lobula plate, where neural responses to visual motion were shown to be segregated into four layers, each containing the terminals of neurons encoding motion in one of four different directions (Fig. 2d,e). Many of the imaged neurons are quite small and hard to record from using electrophysiology, so two-photon imaging has been crucial for unraveling these aspects of fly motion vision. Furthermore, much processing in invertebrates but also vertebrates occurs in the neuropil, which is easily accessible to two-photon imaging. Larger-scale recordings from many neurons in Drosophila are expected in the future, for example, in Campbell et al. [25] more than a hundred neurons were recorded simultaneously in the mushroom body of the fly to interrogate odor representations at the population level.
The above are examples of how the unique strengths of a model organism have been used for studying a specific question. The unique strength of the larval zebrafish is probably its transparency. This feature has been exploited to perform large-scale imaging [5,10,17,24,50,64] in these animals, sometimes covering the entire brain – sequentially [17] or at the same time [8,10,50]. As in Drosophila [62,63] and mice [65], setups have been created where animals can be presented with various stimulus modalities, while their behavior is monitored through camera-registered tail movement in head-embedded animals or through electrical correlates of intended behavior (fictive swimming), in paralyzed animals. These behavioral setups, designed for small transparent animals, provide a powerful platform for studying brain mechanisms of sensorimotor transformations and other neural processes at a large-scale level.
Miri et al. [53] quantified and mapped the time scales of persistent activity in the oculomotor integrator circuit using two-photon imaging of synthetic calcium indicators. Using regression analysis to relate neuronal activity to behavior (Fig. 3a), their work showed the existence of spatial gradients of time constants, which inspired a model of an attractor network that could underlie eye movements. Similar regression analyses was performed in Portugues et al. [17] to analyze whole-brain representations of eye position, visual input and swimming, generating maps of stimulus and motor representations (Fig. 3b) that were consistent across multiple fish.
Figure 3. Imaging during behavior in larval zebrafish.
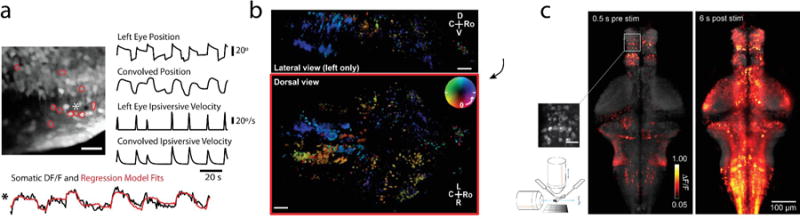
a. Imaging in the hindbrain during eye movements. Eye movements were monitored using a camera while dye-loaded cells in the hindbrain were imaged with a two-photon microscope. Regression analysis could be used to identify the combination of behavioral variables that best determined the neural activity. The example cell (1) is strongly tuned to left eye position. b. Whole-brain two-photon imaging in behaving zebrafish expressing GCaMP5G panneuronally. Individual planes are sequentially imaged with a two-photon microscope during rotational motion of a scene displayed underneath the fish, generating a phase response map across the brain representing the phase of the oscillating stimulus at which the neural response is strongest. At the same time, tail and eye position are monitored so that neural activity can be related to behavior. c. Whole-brain light-sheet imaging in fictively behaving larval zebrafish. The imaging rate is up to three brain volumes per second, so that relationships between neurons across the brain can be investigated, as well as their correlation to behavior and visual input. Depicted is a top-projection of whole-brain activity during the optomotor response, just before stimulus onset (left) and six seconds after stimulus onset (right). Electrical recordings from the motor neuron axons in the tail of the paralyzed animals record intended swimming behavior. Inset scale bar: 20 micrometers.
Panel a adapted with permission from Miri et al. (2011), b from Portugues et al. (2014), c from Vladimirov et al. (2014).
The zebrafish is well suited for light-sheet imaging, because its transparent brain allows access to both the detection objective and orthogonal excitation objectives. In the first applications to small brains, whole-brain activity in zebrafish [9,10] was imaged, leading to the discovery of brain-wide correlated patterns of activity, spanning both cell bodies and neuropil. In a further development of this imaging technique, it was paired with a virtual reality setup, this time allowing for whole-brain activity to be recorded during behavior and visual stimulation [50, 66]. Whole-brain maps of visual and motor related activity could be constructed from these data. The key advantage to this whole-brain imaging paradigm is that interdependent activity of large populations of neurons can be analyzed. This allows for the quantification of trial-by-trial and behavior-dependent variations in neural activity, as well as dynamic coupling between different neuronal populations, For example, in Freeman et al. [66] analysis of whole-brain activity during behavior led to the discovery of a small population of neurons in the dorsal hindbrain whose activity is strongly coupled and strictly anticorrelated with swimming, representing a previously known neural population that can now be investigated in more detail.
Further studies have generated insight into which circuits are involved in motor adaptation [5] and in tuning of visual neurons to motion stimuli [24], olfactory responses [67] and associative learning [21]. The behavioral repertoire of larval zebrafish is actively being explored, with recent findings pointing to the existence of relatively complex behaviors including fear behavior [68] and long-term memory from social reward in one-week old fish [69], with undoubtedly more interesting behaviors to be discovered and characterized in the future.
Brain-wide surveys such as the above are useful because the chances of unobserved nodes in the network are reduced. The leech midbody segmental ganglion represents a neural system that is similarly autonomous, in that it can independently generate different behaviors, such as swimming and crawling. The ganglion of about 400 cells (Fig. 4a) is small enough to fit under a microscope objective, so that about 1/3rd of the structure can be imaged. Using synthetic voltage indicators, Briggman et al. [38] imaged activity in over 100 neurons and used electrical stimulation to elicit either fictive swimming or crawling, reported through the large-scale voltage imaging. Identical electrical stimulation could elicit either behavior; remarkably, before the decision which behavior to execute was made, single-neuron and network-level analysis revealed that network activity already reflected the future decision (Fig. 4b,c). Here, in a tiny nervous system, decision making processes could be tracked by large-scale, single-cell voltage imaging.
Figure 4. Analysis of population response in the leech ganglion.
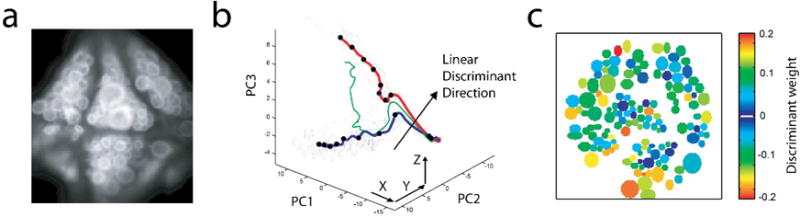
a. Micrograph of the ventral side of the ganglion, containing about 160 cells. b. The linear discriminant weights for all 143 recorded neurons that best separate trials on which neural stimulation led to fictive swimming versus fictive crawling. c. Representation of population activity in three dimensions, using projections onto the first three components arising from principal component analysis. Swimming trials are shown in blue, crawling trials in red. Using the linear discriminant weights, population activity can be decoded to predict swimming vs. crawling about a second before the behavior is evident at the nerves exiting the ganglion.
Panels a,b,c adapted with permission from Briggman et al. 2005.
The above work was all done in immobilized animals. Imaging neuronal populations in freely behaving animals would allow for monitoring network activity in their native state. In mammals, it is possible to mount electrode drives and small microscopes [70] on the heads of animals, but as organisms get smaller and microscopes get bigger, this becomes difficult. Alternative strategies have been developed, such as, in zebrafish, the use of bioluminescence as a reporter of neural activity that does not depend on excitation light from microscopes [71]. In C. elegans, a moving stage allows neurons to be imaged in freely behaving animals [57–59]. Luo et al. [72] used this strategy to image a series of single neurons, part of a sensorimotor network, in freely moving C. elegans. Larsh et al. [73] developed a strategy to record defined single neurons in many animals at the same time. Imaging activity from moving worms can be extended to volumetric imaging using e.g. light field microscopy. In most other species, it is likely that truly large-scale imaging and manipulation of neuronal activity in freely behaving animals will remain a challenge.
Emerging model organisms
Currently the most prevalent genetic model organisms with a brain small enough to fit under a microscope objective are Drosophila, zebrafish and C. elegans. It goes without mention that the mouse and the rat are widely used mammalian model organisms with a rich genetic toolkit and a huge impact on neuroscience. The development of other model organisms is an exciting venue within neuroscience. The transgenic marmoset monkey may combine the flexibility in the behavior of primates with a relatively small brain[74]; the Etruscan shrew [75] is a very small mammal; the dart frog is a small amphibian with a rich behavioral repertoire. Furthermore, the recently established CRISPR/Cas9 system [76] will be very useful for inserting transgenes into non-genetic model organisms. The Hydra is a small organism with a relatively simple nerve net which has recently been genetically manipulated to be made accessible for imaging studies (Rafael Yuste, personal communication). Not only do these species have their unique advantages for neuroscientific studies; cross-species comparison of brain function is in itself important for understanding how nervous systems use strategies to solve problems faced by animals in general.
Outlook
The best approaches toward understanding brain function in many cases remain unclear. There are advantages to using small model organisms for neuroscience, but not all behaviors can be studied in these animals, as their behavioral repertoire is generally more limited than that of larger mammals. However, a comparison to rodent work in the last decade is informative, where several behaviors traditionally studied in primates have been shown to also work in rodents [77]. Similarly, place learning, a behavior typically studied in rodents, has been shown to exist in Drosophila [47]. Modulation of visual responses by behavioral state has been observed in mouse [78] as well as in Drosophila [62,79]. Mammals fight [80] and so do many other animals including flies [81]. Large animals make decisions between exploration and exploitation of the environment, and so do C. elegans[61]. Thus, although many complex mammalian behaviors must be studied in mammals and of course a mouse or primate will likely tell us more about human brain function than a fly, fish or worm, as knowledge of the behavioral repertoire and neuroanatomy of the species discussed here expands, we expect that small brains will increasingly play a role in generating understanding of the principles of brain function.
In parallel to the progress that is being made in the quantitative characterization of many forms of behavior, advances are being made in microscopy, protein engineering, and computational methods. As reporters of neural activity continue to get more accurate and diverse, and microscopy methods increase their spatial and temporal coverage, we can expect increasingly detailed information about the large-scale function of these small brains.
Highlights.
Modern microscopy and genetic techniques enable large-scale imaging of small brains
Imaging has generated insights into visual function, motor control and network dynamics
Mapping out the behavioral repertoire of small model organisms will be crucial
Acknowledgments
We thank the authors of the reproduced figure panels for permission to use their work in this review, and we thank Eva Naumann for sharing the zebrafish artwork in figure 1. We are grateful to Emre Aksay, Vivek Jayaraman, Michael Reiser, Michael Yartsev, Jeremy Freeman and Andrew Bolton for commenting on the manuscript. This work was supported by the Howard Hughes Medical Institute (MA) and NIH grants DP1 NS082121 and R01DA030304 (FE).
Footnotes
Publisher's Disclaimer: This is a PDF file of an unedited manuscript that has been accepted for publication. As a service to our customers we are providing this early version of the manuscript. The manuscript will undergo copyediting, typesetting, and review of the resulting proof before it is published in its final citable form. Please note that during the production process errors may be discovered which could affect the content, and all legal disclaimers that apply to the journal pertain.
References
- 1.Bargmann CI, Marder E. From the connectome to brain function. Nature Methods. 2013;10:483–490. doi: 10.1038/nmeth.2451. [DOI] [PubMed] [Google Scholar]
- 2.Gutierrez GJ, O’Leary T, Marder E. Multiple mechanisms switch an electrically coupled, synaptically inhibited neuron between competing rhythmic oscillators. Neuron. 2013;77:845–858. doi: 10.1016/j.neuron.2013.01.016. [DOI] [PMC free article] [PubMed] [Google Scholar]
- 3.Denk W, Strickler JH, Webb WW. Two-photon laser scanning fluorescence microscopy. Science. 1990;248:73–76. doi: 10.1126/science.2321027. [DOI] [PubMed] [Google Scholar]
- 4.Schrödel T, Prevedel R, Aumayr K, Zimmer M, Vaziri A. Brain-wide 3D imaging of neuronal activity in Caenorhabditis elegans with sculpted light. Nature Methods. 2013;10:1013–1020. doi: 10.1038/nmeth.2637. [DOI] [PubMed] [Google Scholar]
- 5.Ahrens MB, Li JM, Orger MB, Robson DN, Schier AF, Engert F, Portugues R. Brain-wide neuronal dynamics during motor adaptation in zebrafish. Nature. 2012;485:471–477. doi: 10.1038/nature11057. [DOI] [PMC free article] [PubMed] [Google Scholar]
- 6.Katona G, Szalay G, Maák P, Kaszás A, Veress M, Hillier D, Chiovini B, Vizi ES, Roska B, Rózsa B. Fast two-photon in vivo imaging with three-dimensional random-access scanning in large tissue volumes. Nature Methods. 2012;9:201–208. doi: 10.1038/nmeth.1851. [DOI] [PubMed] [Google Scholar]
- 7.Grewe BF, Langer D, Kasper H, Kampa BM, Helmchen F. High-speed in vivo calcium imaging reveals neuronal network activity with near-millisecond precision. Nature Methods. 2010;7:399–405. doi: 10.1038/nmeth.1453. [DOI] [PubMed] [Google Scholar]
- 8••.Prevedel R, Yoon Y-G, Hoffmann M, Pak N, Wetzstein G, Kato S, Schrödel T, Raskar R, Zimmer M, Boyden ES, et al. Simultaneous whole-animal 3D imaging of neuronal activity using light-field microscopy. Nature Methods. 2014 doi: 10.1038/nmeth.2964. Here, light field microscopy is used to image from C. elegans and zebrafish neurons. Using light field optics, imaged volumes can be reconstructed from single camera frames. [DOI] [PMC free article] [PubMed] [Google Scholar]
- 9••.Panier T, Romano SA, Olive R, Pietri T, Sumbre G, Candelier R, Debrégeas G. Fast functional imaging of multiple brain regions in intact zebrafish larvae using Selective Plane Illumination Microscopy. Front Neural Circuits. 2013;7:65. doi: 10.3389/fncir.2013.00065. Light sheet microscopy is used here to image activity of many neurons in the zebrafish brain, and computational methods are applied to map correlated neuronal populations. [DOI] [PMC free article] [PubMed] [Google Scholar]
- 10••.Ahrens MB, Orger MB, Robson DN, Li JM, Keller PJ. Whole-brain functional imaging at cellular resolution using light-sheet microscopy. Nature Methods. 2013;10:413–420. doi: 10.1038/nmeth.2434. Using light sheet microscopy, entire brains of larval zebrafish are imaged at cellular resolution, and patterns of correlated neurons and neural processes identified using computational methods. [DOI] [PubMed] [Google Scholar]
- 11.Quirin S, Jackson J, Peterka DS, Yuste R. Simultaneous imaging of neural activity in three dimensions. Front Neural Circuits. 2014;8:29. doi: 10.3389/fncir.2014.00029. [DOI] [PMC free article] [PubMed] [Google Scholar]
- 12.Broxton M, Grosenick L, Yang S, Cohen N, Andrew, Deisseroth K, Levoy M. Wave optics theory and 3-D deconvolution for the light field microscope. Optics express. 2013;21:25418–25439. doi: 10.1364/OE.21.025418. [DOI] [PMC free article] [PubMed] [Google Scholar]
- 13••.Grosenick L, Anderson T, Smith SJ. Proceedings of the Sixth IEEE International Conference on Symposium on Biological Imaging: From Nano to Macro (ISBI ’09) New York: IEEE Press; 2009. Elastic source selection for in vivo imaging of neuronal ensembles; pp. 1263–1266. In this paper, computational methods are developed for extracting patterns of neural activity from light field data of the zebrafish optic tectum, while the animal is exposed to a visual stimulus. [Google Scholar]
- 14.Bock DD, Lee W-CA, Kerlin AM, Andermann ML, Hood G, Wetzel AW, Yurgenson S, Soucy ER, Kim HS, Reid RC. Network anatomy and in vivo physiology of visual cortical neurons. Nature. 2011;471:177–182. doi: 10.1038/nature09802. [DOI] [PMC free article] [PubMed] [Google Scholar]
- 15.Briggman K, Helmstaedter M. Wiring specificity in the direction-selectivity circuit of the retina. Nature. 2011;471:183–188. doi: 10.1038/nature09818. [DOI] [PubMed] [Google Scholar]
- 16.Del Bene F, Wyart C, Robles E, Tran A, Looger L, Scott EK, Isacoff EY, Baier H. Filtering of visual information in the tectum by an identified neural circuit. Science. 2010;330:669–673. doi: 10.1126/science.1192949. [DOI] [PMC free article] [PubMed] [Google Scholar]
- 17••.Portugues R, Feierstein CE, Engert F, Orger MB. Whole-brain activity maps reveal stereotyped, distributed networks for visuomotor behavior. Neuron. 2014;81:1328–1343. doi: 10.1016/j.neuron.2014.01.019. In this paper, regression-based analysis and anatomical registration techniques are used to extract activity patterns across the brain of behaving zebrafish, recorded using two-photon imaging, that relate to optokinetic behavior. [DOI] [PMC free article] [PubMed] [Google Scholar]
- 18.Kato S, Xu Y, Cho CE, Abbott LF, Bargmann CI. Temporal Responses of C. elegans Chemosensory Neurons Are Preserved in Behavioral Dynamics. Neuron. 2014;81:616–628. doi: 10.1016/j.neuron.2013.11.020. [DOI] [PMC free article] [PubMed] [Google Scholar]
- 19.Sumbre G, Muto A, Baier H, Poo M-M. Entrained rhythmic activities of neuronal ensembles as perceptual memory of time interval. Nature. 2008;456:102–106. doi: 10.1038/nature07351. [DOI] [PMC free article] [PubMed] [Google Scholar]
- 20••.Seelig JD, Jayaraman V. Feature detection and orientation tuning in the Drosophila central complex. Nature. 2013;503:262–266. doi: 10.1038/nature12601. Neural responses to visual stimuli in the central complex of behaving Drosophila are analyzed and shown to be orientation tuned, and modulated by behavior. [DOI] [PMC free article] [PubMed] [Google Scholar]
- 21.Aizenberg M, Schuman EM. Cerebellar-dependent learning in larval zebrafish. J Neurosci. 2011;31:8708–8712. doi: 10.1523/JNEUROSCI.6565-10.2011. [DOI] [PMC free article] [PubMed] [Google Scholar]
- 22••.Maisak MS, Haag J, Ammer G, Serbe E, Meier M, Leonhardt A, Schilling T, Bahl A, Rubin GM, Nern A, et al. A directional tuning map of Drosophila elementary motion detectors. Nature. 2014;500:212–216. doi: 10.1038/nature12320. Directional response properties in the visual system of Drosophila are investigated here, and shown to segregate by neuron type and anatomical location. [DOI] [PubMed] [Google Scholar]
- 23••.Strother JA, Nern A, Reiser MB. Direct Observation of ON and OFF Pathways in the Drosophila Visual System. Curr Biol. 2014;24:976–983. doi: 10.1016/j.cub.2014.03.017. In this paper, the visual system of Drosophila is investigated and shown to segregate in ON and OFF pathways that are directionally tuned. [DOI] [PubMed] [Google Scholar]
- 24•.Kubo F, Hablitzel B, Dal Maschio M, Driever W, Baier H, Arrenberg AB. Functional architecture of an optic flow-responsive area that drives horizontal eye movements in zebrafish. Neuron. 2014;81:1344–1359. doi: 10.1016/j.neuron.2014.02.043. Responses in the area pretectalis of the larval zebrafish are mapped out here, and shown to be necessary and sufficient for the optokinetic response. [DOI] [PubMed] [Google Scholar]
- 25.Campbell RAA, Honegger KS, Qin H, Li W, Demir E, Turner GC. Imaging a population code for odor identity in the Drosophila mushroom body. J Neurosci. 2013;33:10568–10581. doi: 10.1523/JNEUROSCI.0682-12.2013. [DOI] [PMC free article] [PubMed] [Google Scholar]
- 26.Niessing J, Friedrich RW. Olfactory pattern classification by discrete neuronal network states. Nature. 2010;465:47–52. doi: 10.1038/nature08961. [DOI] [PubMed] [Google Scholar]
- 27.Kinkhabwala A, Riley M, Koyama M, Monen J, Satou C, Kimura Y, Higashijima S-I, Fetcho J. A structural and functional ground plan for neurons in the hindbrain of zebrafish. Proc Natl Acad Sci USA. 2011;108:1164–1169. doi: 10.1073/pnas.1012185108. [DOI] [PMC free article] [PubMed] [Google Scholar]
- 28.Kalueff AV, Gebhardt M, Stewart AM, Cachat JM, Brimmer M, Chawla JS, Craddock C, Kyzar EJ, Roth A, Landsman S, et al. Towards a comprehensive catalog of zebrafish behavior 1.0 and beyond. Zebrafish. 2013;10:70–86. doi: 10.1089/zeb.2012.0861. [DOI] [PMC free article] [PubMed] [Google Scholar]
- 29•.Chen T-W, Wardill TJ, Sun Y, Pulver SR, Renninger SL, Baohan A, Schreiter ER, Kerr RA, Orger MB, Jayaraman V, et al. Ultrasensitive fluorescent proteins for imaging neuronal activity. Nature. 2013;499:295–300. doi: 10.1038/nature12354. New developments in genetically-encoded calcium indicators are reported here. [DOI] [PMC free article] [PubMed] [Google Scholar]
- 30•.Kralj JM, Douglass AD, Hochbaum DR, Maclaurin D, Cohen AE. Optical recording of action potentials in mammalian neurons using a microbial rhodopsin. Nature Methods. 2012;9:90–95. doi: 10.1038/nmeth.1782. In this paper, a genetically-encoded voltage senor is developed and shown to convey single action potentials. [DOI] [PMC free article] [PubMed] [Google Scholar]
- 31.St-Pierre F, Marshall JD, Yang Y, Gong Y, Schnitzer MJ, Lin MZ. High-fidelity optical reporting of neuronal electrical activity with an ultrafast fluorescent voltage sensor. Nat Neurosci. 2014;17:884–889. doi: 10.1038/nn.3709. [DOI] [PMC free article] [PubMed] [Google Scholar]
- 32.Jin L, Han Z, Platisa J, Wooltorton JRA, Cohen LB, Pieribone VA. Single action potentials and subthreshold electrical events imaged in neurons with a fluorescent protein voltage probe. Neuron. 2012;75:779–785. doi: 10.1016/j.neuron.2012.06.040. [DOI] [PMC free article] [PubMed] [Google Scholar]
- 33.Marvin JS, Borghuis BG, Tian L, Cichon J, Harnett MT, Akerboom J, Gordus A, Renninger SL, Chen T-W, Bargmann CI, et al. An optimized fluorescent probe for visualizing glutamate neurotransmission. Nature Methods. 2013;10:162–170. doi: 10.1038/nmeth.2333. [DOI] [PMC free article] [PubMed] [Google Scholar]
- 34.Holtmaat A, Svoboda K. Experience-dependent structural synaptic plasticity in the mammalian brain. Nat Rev Neurosci. 2009;10:647–658. doi: 10.1038/nrn2699. [DOI] [PubMed] [Google Scholar]
- 35.Fernández-Alfonso T, Nadella KMNS, Iacaruso MF, Pichler B, Roš H, Kirkby PA, Silver RA. Monitoring synaptic and neuronal activity in 3D with synthetic and genetic indicators using a compact acousto-optic lens two-photon microscope. J Neurosci Methods. 2014;222:69–81. doi: 10.1016/j.jneumeth.2013.10.021. [DOI] [PMC free article] [PubMed] [Google Scholar]
- 36.Holekamp TF, Turaga D, Holy TE. Fast three-dimensional fluorescence imaging of activity in neural populations by objective-coupled planar illumination microscopy. Neuron. 2008;57:661–672. doi: 10.1016/j.neuron.2008.01.011. [DOI] [PubMed] [Google Scholar]
- 37.Chen SX, Cherry A, Tari PK, Podgorski K, Kwong YKK, Haas K. The transcription factor MEF2 directs developmental visually driven functional and structural metaplasticity. Cell. 2012;151:41–55. doi: 10.1016/j.cell.2012.08.028. [DOI] [PubMed] [Google Scholar]
- 38••.Briggman KL. Optical Imaging of Neuronal Populations During Decision-Making. Science. 2005;307:896–901. doi: 10.1126/science.1103736. Here, the leech ganglion is imaged using voltage dyes, and activity analyzed at the network level. The authors show that network activity conveys future motor programs implemented by the ganglion. [DOI] [PubMed] [Google Scholar]
- 39.Bailey CH, Kandel ER. Synaptic remodeling, synaptic growth and the storage of long-term memory in Aplysia. Progress in brain research. 2008;169:179–198. doi: 10.1016/S0079-6123(07)00010-6. [DOI] [PubMed] [Google Scholar]
- 40.Okuyama T, Yokoi S, Abe H, Isoe Y, Suehiro Y, Imada H, Tanaka M, Kawasaki T, Yuba S, Taniguchi Y, et al. A neural mechanism underlying mating preferences for familiar individuals in medaka fish. Science. 2014;343:91–94. doi: 10.1126/science.1244724. [DOI] [PubMed] [Google Scholar]
- 41.Faber T, Joerges J, Menzel R. Associative learning modifies neural representations of odors in the insect brain. Nat Neurosci. 1999;2:74–78. doi: 10.1038/4576. [DOI] [PubMed] [Google Scholar]
- 42•.Cassenaer S, Laurent G. Conditional modulation of spike-timing-dependent plasticity for olfactory learning. Nature. 2012;482:47–52. doi: 10.1038/nature10776. Spike-timing dependent plasticity is shown here to mediate olfactory learning in the locust brain. [DOI] [PubMed] [Google Scholar]
- 43.Brand AH, Perrimon N. Targeted gene expression as a means of altering cell fates and generating dominant phenotypes. Development. 1993;118:401–415. doi: 10.1242/dev.118.2.401. [DOI] [PubMed] [Google Scholar]
- 44.Jenett A, Rubin GM, Ngo T-TB, Shepherd D, Murphy C, Dionne H, Pfeiffer BD, Cavallaro A, Hall D, Jeter J, et al. A GAL4-driver line resource for Drosophila neurobiology. Cell Rep. 2012;2:991–1001. doi: 10.1016/j.celrep.2012.09.011. [DOI] [PMC free article] [PubMed] [Google Scholar]
- 45.Konopka RJ, Benzer S. Clock mutants of Drosophila melanogaster. 1971 doi: 10.1073/pnas.68.9.2112. [DOI] [PMC free article] [PubMed] [Google Scholar]
- 46.Alekseyenko OV, Chan Y-B, Li R, Kravitz EA. Single dopaminergic neurons that modulate aggression in Drosophila. Proc Natl Acad Sci USA. 2013;110:6151–6156. doi: 10.1073/pnas.1303446110. [DOI] [PMC free article] [PubMed] [Google Scholar]
- 47••.Ofstad TA, Zuker CS, Reiser MB. Visual place learning in Drosophila melanogaster. Nature. 2011;474:204–207. doi: 10.1038/nature10131. In this paper it is shown that Drosophila can perform spatial learning, an example of a “complex” behavior in a small insect. [DOI] [PMC free article] [PubMed] [Google Scholar]
- 48.Okusawa S, Kohsaka H, Nose A. Serotonin and downstream leucokinin neurons modulate larval turning behavior in Drosophila. J Neurosci. 2014;34:2544–2558. doi: 10.1523/JNEUROSCI.3500-13.2014. [DOI] [PMC free article] [PubMed] [Google Scholar]
- 49.Cheng LE, Song W, Looger LL, Jan LY, Jan YN. The role of the TRP channel NompC in Drosophila larval and adult locomotion. Neuron. 2010;67:373–380. doi: 10.1016/j.neuron.2010.07.004. [DOI] [PMC free article] [PubMed] [Google Scholar]
- 50••.Vladimirov N, Mu Y, Kawashima T, Bennett DV, Yang C-T, Looger LL, Keller PJ, Freeman J, Ahrens MB. Light-sheet functional imaging in fictively behaving zebrafish. Nature Methods. 2014 doi: 10.1038/nmeth.3040. An experimental system is developed for performing light-sheet imaging in fictively behaving zebrafish, allowing whole-brain activity to be correlated to behavior. [DOI] [PubMed] [Google Scholar]
- 51.Scott EK, Mason L, Arrenberg AB, Ziv L, Gosse NJ, Xiao T, Chi NC, Asakawa K, Kawakami K, Baier H. Targeting neural circuitry in zebrafish using GAL4 enhancer trapping. Nature Methods. 2007;4:323–326. doi: 10.1038/nmeth1033. [DOI] [PubMed] [Google Scholar]
- 52.Kawakami K, Abe G, Asada T, Asakawa K, Fukada R, Ito A, Lal P, Mouri N, Muto A, Suster M, et al. zTrap: zebrafish gene trap and enhancer trap database. BMC Developmental Biology. 2010;10:105. doi: 10.1186/1471-213X-10-105. [DOI] [PMC free article] [PubMed] [Google Scholar]
- 53.Miri A, Daie K, Arrenberg AB, Baier H, Aksay E, Tank DW. Spatial gradients and multidimensional dynamics in a neural integrator circuit. Nat Neurosci. 2011;14:1150–1159. doi: 10.1038/nn.2888. [DOI] [PMC free article] [PubMed] [Google Scholar]
- 54.Portugues R, Engert F. Adaptive locomotor behavior in larval zebrafish. Front Syst Neurosci. 2011;5:72. doi: 10.3389/fnsys.2011.00072. [DOI] [PMC free article] [PubMed] [Google Scholar]
- 55.Severi KE, Portugues R, Marques JC, O’Malley DM, Orger MB, Engert F. Neural Control and Modulation of Swimming Speed in the Larval Zebrafish. Neuron. 2014;83:692–707. doi: 10.1016/j.neuron.2014.06.032. [DOI] [PMC free article] [PubMed] [Google Scholar]
- 56.White JG, Southgate E, Thomson JN, Brenner S. The structure of the nervous system of the nematode Caenorhabditis elegans. Philos Trans R Soc Lond, B, Biol Sci. 1986;314:1–340. doi: 10.1098/rstb.1986.0056. [DOI] [PubMed] [Google Scholar]
- 57.Clark DA, Gabel CV, Gabel H, Samuel ADT. Temporal activity patterns in thermosensory neurons of freely moving Caenorhabditis elegans encode spatial thermal gradients. J Neurosci. 2007;27:6083–6090. doi: 10.1523/JNEUROSCI.1032-07.2007. [DOI] [PMC free article] [PubMed] [Google Scholar]
- 58••.Faumont S, Rondeau G, Thiele TR, Lawton KJ, McCormick KE, Sottile M, Griesbeck O, Heckscher ES, Roberts WM, Doe CQ, et al. An image-free optomechanical system for creating virtual environments and imaging neuronal activity in freely moving Caenorhabditis elegans. PloS one. 2011;6:e24666. doi: 10.1371/journal.pone.0024666. Using a moving stage on which C. elegans can crawl yet be centered under a microscope objective, neural activity can be measured in freely moving worms. [DOI] [PMC free article] [PubMed] [Google Scholar]
- 59.Shipley FB, Clark CM, Alkema MJ, Leifer AM. Simultaneous optogenetic manipulation and calcium imaging in freely moving C. elegans. Front Neural Circuits. 2014;8:28. doi: 10.3389/fncir.2014.00028. [DOI] [PMC free article] [PubMed] [Google Scholar]
- 60.Ardiel EL, Rankin CH. An elegant mind: learning and memory in Caenorhabditis elegans. Learn Mem. 2010;17:191–201. doi: 10.1101/lm.960510. [DOI] [PubMed] [Google Scholar]
- 61••.Flavell SW, Pokala N, Macosko EZ, Albrecht DR, Larsch J, Bargmann CI. Serotonin and the neuropeptide PDF initiate and extend opposing behavioral states in C. elegans. Cell. 2013;154:1023–1035. doi: 10.1016/j.cell.2013.08.001. In this paper, it is shown that modulation of network activity in C. elegans causes the animal to switch between different behaviors mediating foraging strategies. [DOI] [PMC free article] [PubMed] [Google Scholar]
- 62•.Maimon G, Straw AD, Dickinson MH. Active flight increases the gain of visual motion processing in Drosophila. Nat Neurosci. 2010;13:393–399. doi: 10.1038/nn.2492. A setup is developed for recording intracellularly from neurons in tethered, flying Drosophila. [DOI] [PubMed] [Google Scholar]
- 63•.Seelig JD, Chiappe ME, Lott GK, Dutta A, Osborne JE, Reiser MB, Jayaraman V. Two-photon calcium imaging from head-fixed Drosophila during optomotor walking behavior. Nature Methods. 2010;7:535–540. doi: 10.1038/nmeth.1468. Here, a setup is developed for imaging neuronal responses in tethered, walking Drosophila. [DOI] [PMC free article] [PubMed] [Google Scholar]
- 64.Jetti SK, Vendrell Llopis N, Yaksi E. Spontaneous activity governs olfactory representations in spatially organized habenular microcircuits. Curr Biol. 2014;24:434–439. doi: 10.1016/j.cub.2014.01.015. [DOI] [PubMed] [Google Scholar]
- 65.Harvey CD, Collman F, Dombeck DA, Tank DW. Intracellular dynamics of hippocampal place cells during virtual navigation. Nature. 2009;461:941– 946. doi: 10.1038/nature08499. [DOI] [PMC free article] [PubMed] [Google Scholar]
- 66•.Freeman J, Vladimirov N, Kawashima T, Mu Y, Sofroniew NJ, Bennett DV, Rosen J, Yang C-T, Looger LL, Ahrens MB. Mapping brain activity at scale with cluster computing. Nature Methods. 2014 doi: 10.1038/nmeth.3041. Computational methods are developed for large-scale analysis of imaging data. [DOI] [PubMed] [Google Scholar]
- 67.Dreosti E, Vendrell Llopis N, Carl M, Yaksi E, Wilson SW. Left-right asymmetry is required for the habenulae to respond to both visual and olfactory stimuli. Curr Biol. 2014;24:440–445. doi: 10.1016/j.cub.2014.01.016. [DOI] [PMC free article] [PubMed] [Google Scholar]
- 68.Lee A, Mathuru AS, Teh C, Kibat C, Korzh V, Penney TB, Jesuthasan S. The habenula prevents helpless behavior in larval zebrafish. Curr Biol. 2010;20:2211–2216. doi: 10.1016/j.cub.2010.11.025. [DOI] [PubMed] [Google Scholar]
- 69.Hinz FI, Aizenberg M, Tushev G, Schuman EM. Protein synthesis-dependent associative long-term memory in larval zebrafish. J Neurosci. 2013;33:15382–15387. doi: 10.1523/JNEUROSCI.0560-13.2013. [DOI] [PMC free article] [PubMed] [Google Scholar]
- 70.Ghosh KK, Burns LD, Cocker ED, Nimmerjahn A, Ziv Y, Gamal AE, Schnitzer MJ. Miniaturized integration of a fluorescence microscope. Nature Methods. 2011;8:871–878. doi: 10.1038/nmeth.1694. [DOI] [PMC free article] [PubMed] [Google Scholar]
- 71.Naumann EA, Kampff AR, Prober DA, Schier AF, Engert F. Monitoring neural activity with bioluminescence during natural behavior. Nat Neurosci. 2010;13:513–520. doi: 10.1038/nn.2518. [DOI] [PMC free article] [PubMed] [Google Scholar]
- 72.Luo L, Wen Q, Ren J, Hendricks M, Gershow M, Qin Y, Greenwood J, Soucy ER, Klein M, Smith-Parker HK, et al. Dynamic encoding of perception, memory, and movement in a C. elegans chemotaxis circuit. Neuron. 2014;82:1115–1128. doi: 10.1016/j.neuron.2014.05.010. [DOI] [PMC free article] [PubMed] [Google Scholar]
- 73.Larsch J, Ventimiglia D, Bargmann CI, Albrecht DR. High-throughput imaging of neuronal activity in Caenorhabditis elegans. Proc Natl Acad Sci USA. 2013;110:E4266–73. doi: 10.1073/pnas.1318325110. [DOI] [PMC free article] [PubMed] [Google Scholar]
- 74.Sasaki E, Suemizu H, Shimada A, Hanazawa K, Oiwa R, Kamioka M, Tomioka I, Sotomaru Y, Hirakawa R, Eto T, et al. Generation of transgenic non-human primates with germline transmission. Nature. 2009;459:523–527. doi: 10.1038/nature08090. [DOI] [PubMed] [Google Scholar]
- 75.Roth-Alpermann C, Anjum F, Naumann R, Brecht M. Cortical organization in the Etruscan shrew (Suncus etruscus) J Neurophysiol. 2010;104:2389–2406. doi: 10.1152/jn.00762.2009. [DOI] [PubMed] [Google Scholar]
- 76.Hsu PD, Lander ES, Zhang F. Development and applications of CRISPR-Cas9 for genome engineering. Cell. 2014;157:1262–1278. doi: 10.1016/j.cell.2014.05.010. [DOI] [PMC free article] [PubMed] [Google Scholar]
- 77.Erlich JC, Bialek M, Brody CD. A cortical substrate for memory-guided orienting in the rat. Neuron. 2011;72:330–343. doi: 10.1016/j.neuron.2011.07.010. [DOI] [PMC free article] [PubMed] [Google Scholar]
- 78.Niell CM, Stryker MP. Modulation of visual responses by behavioral state in mouse visual cortex. Neuron. 2010;65:472–479. doi: 10.1016/j.neuron.2010.01.033. [DOI] [PMC free article] [PubMed] [Google Scholar]
- 79.Chiappe ME, Seelig JD, Reiser MB, Jayaraman V. Walking Modulates Speed Sensitivity in Drosophila Motion Vision. Current Biology. 2010;20:1470– 1475. doi: 10.1016/j.cub.2010.06.072. [DOI] [PMC free article] [PubMed] [Google Scholar]
- 80.Lin D, Boyle MP, Dollar P, Lee H, Lein ES, Perona P, Anderson DJ. Functional identification of an aggression locus in the mouse hypothalamus. Nature. 2011;470:221–226. doi: 10.1038/nature09736. [DOI] [PMC free article] [PubMed] [Google Scholar]
- 81.Wang L, Anderson DJ. Identification of an aggression-promoting pheromone and its receptor neurons in Drosophila. Nature. 2010;463:227–231. doi: 10.1038/nature08678. [DOI] [PMC free article] [PubMed] [Google Scholar]