Abstract
Chinchilla is a commonly used animal model for research of sound transmission through the ear. Experimental measurements of the middle ear transfer function in chinchillas have shown that the middle ear cavity greatly affects the tympanic membrane (TM) and stapes footplate (FP) displacements. However, there is no finite element (FE) model of the chinchilla ear available in the literature to characterize the middle ear functions with the anatomical features of the chinchilla ear. This paper reports a recently completed 3D FE model of the chinchilla ear based on X-ray micro-computed tomography images of a chinchilla bulla. The model consisted of the ear canal, TM, middle ear ossicles and suspensory ligaments, and the middle ear cavity. Two boundary conditions of the middle ear cavity wall were simulated in the model as the rigid structure and the partially flexible surface, and the acoustic-mechanical coupled analysis was conducted with these two conditions to characterize the middle ear function. The model results were compared with experimental measurements reported in the literature including the TM and FP displacements and the middle ear input admittance in chinchilla ear. An application of this model was presented to identify the acoustic role of the middle ear septa - a unique feature of chinchilla middle ear cavity. This study provides the first 3D FE model of the chinchilla ear for characterizing the middle ear functions through the acoustic-mechanical coupled FE analysis.
Keywords: Middle ear, Fluid-structure interaction, Finite element model, Biomechanics of hearing
1 INTRODUCTION
Chinchilla is a commonly used animal model in hearing research. The chinchilla ear has a large tympanic membrane (TM), ossicular dimensions and middle ear space for an animal of its size. The chinchilla’s range of hearing is similar to that of humans (Vrettakos et al., 1988; Rosowski et al., 2006). Experiments have been conducted to identify the acoustic and mechanical properties of chinchilla ears for sound transmission (Browning and Granich, 1978; Hanamure and Lim, 1987; Vrettakos et al., 1988; Ruggero et al., 1990; Rosowski et al., 2006; Ravicz and Rosowski, 2013).
Ruggero et al. (1990) reported the vibration measurements of the malleus and stapes using the Mössbauer technique in chinchillas and assessed the effects of opened middle ear cavity on ossicular motion. Rosowski et al. (2006) investigated the contributions of different middle ear components to middle ear admittance in chinchillas. Their results showed that the middle ear admittance curve had a narrow notch near 2,600 Hz under the experimentally vented cavity condition. Ravicz and Rosowski (2012, 2013) further presented the middle ear velocity transfer function and cochlear input admittance in chinchillas with openings in the bulla. Recently, Guan et al. (2014) reported the effects of acute otitis media on mobility of chinchilla TM. In their control experiment, the middle ear cavity was vented before the measurements, and a notch of TM displacement at about 2,400 Hz was observed. These published experimental studies suggested that the middle ear cavity boundary condition extensively affects middle ear transfer function in chinchilla ears. In addition to the middle ear cavity boundary condition, the configuration of the middle ear air space was shown to have a significant effect on the middle-ear resonance. Guina and Peake (1967), Rosowski et al. (2000) and Tuck-Lee et al. (2008) investigated the role of septum in functions of the middle ear in cat, but no such studies have yet been reported for the chinchilla.
To fully understand the measurements of TM and stapes footplate (FP) vibrations in chinchilla, the anatomy and function relationship must be established through theoretical analysis. Songer et al. (2007) proposed a transmission matrix method to study the chinchilla middle ear mechanics based on the experimental data obtained in the open middle ear cavity. The model was able to replicate some experimental data of opened cavity, but it simplified the complex middle ear with very limited degrees of freedom, lacking the detailed middle ear anatomical information and material properties. The finite element (FE) model simulates the ear anatomy precisely, and the sound transmission through middle ear ossicles can be analyzed by incorporating middle ear components with mechanical properties and boundary conditions of the middle ear cavity (Gan et al., 2004; Zhang and Gan, 2011; Wang et al. 2014).
There are several animal FE models of the ear published in the literature, such as cat (Ladak and Funnell 1996; Tuck-Lee et al. 2008), gerbil (Elkhouri et al. 2006) and guinea pig (Koike et al. 2002). However, there is no FE model of the chinchilla ear reported in the literature. The chinchilla ear has a few distinctive features from other rodents, such as large TM size, exceptionally heavy ossicles relative to skull mass (Nummela, 1995), and large middle ear air space divided into multiple sub-cavities (Browning and Granich, 1978; Rosowski et al., 2006). The difference of the anatomical structure in the middle ear cavity of chinchilla from other species would logically lead to a specialization in the middle ear function in relation to cavity conditions.
This paper reports a recently completed 3D FE model of the chinchilla ear based on X-ray micro-computed tomography (µCT) images. The model consisted of the bony external ear canal, tympanic membrane, middle ear ossicles and suspensory ligaments, and the middle ear cavity. Two boundary conditions of the middle ear cavity wall were simulated in the model as the rigid structure and the partially flexible structure to investigate the acoustic-mechanical coupled characteristics of the chinchilla middle ear. The FE model was validated with experimental measurements reported in the literature. As an application of the model, acoustic function of septa was identified by complete and partial removal of the septa. This study provides the first 3D FE model of the chinchilla ear for characterizing middle ear function through the acoustic-mechanical coupled FE analysis.
2 METHODS
2.1 3D reconstruction of chinchilla bulla
An adult chinchilla (Chinchilla lanigera) was decapitated after anesthesia overdose euthanasia. The ear canals were excised and the bullae were bilaterally removed. The left bulla was processed for X-ray micro-computed tomography (µCT) scanning, and the right bulla was dissected for visual observation of middle ear structure under a light microscope. The study protocol was approved by the Institutional Animal Care and Use Committee of the University of Oklahoma and met the guidelines of the National Institutes of Health.
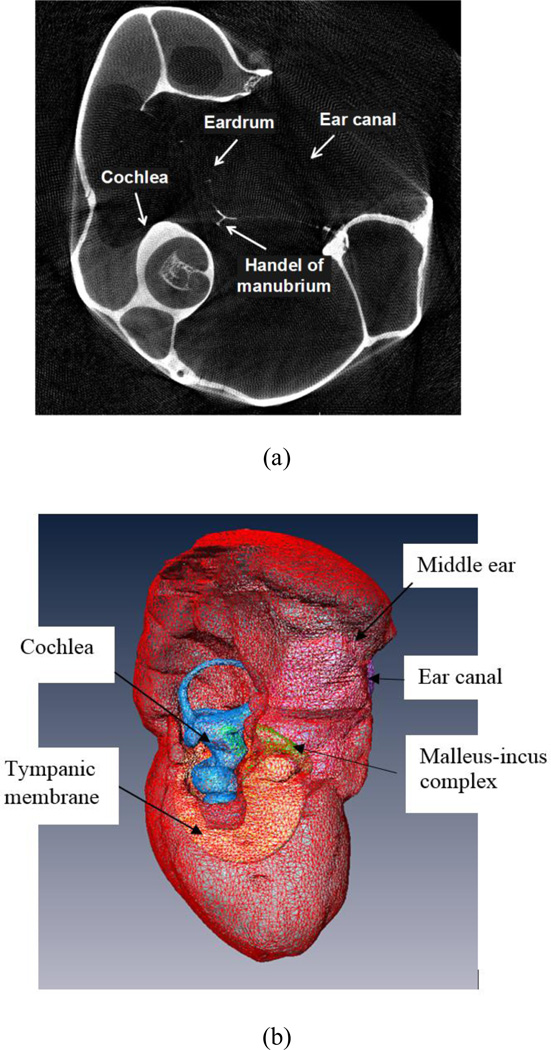
The left bulla was trimmed to fit in a cylindrical scan container 20 mm in diameter. The bulla inside the container was scanned at the Skyscan 1127 µCT (Skyscan, Belgium) at the resolution of 13.4 µm. A total of 2,040 µCT images covering the entire bulla were collected as section images. Figure 1a shows a typical µCT image of the chinchilla bulla including the outer ear canal, eardrum, manubrium, middle ear cavity and cochlear bony wall.
Figure 1.
A typical µCT image and the 3D geometrical model of a chinchilla left ear. a A µCT image of the chinchilla bulla, showing a portion of the outer ear canal, eardrum, manubrium, middle ear cavity and cochlea. b Lateral view of the 3D model of chinchilla middle ear and cochlea reconstructed from µCT images.
A total of 519 µCT images that contained the entire middle ear cavity and cochlea were segmented in Amira software (Visage imaging, Inc.) and served as the information source for 2D geometry contours. At first, the ear canal, eardrum, ossicular chain, and interior wall of the middle ear cavity were identified and generated from the contours or object boundaries using the SurfaceGen function in Amira. The segmentation was done manually for the selected sections. The marching cubes algorithm in Amira was used for extracting polygonal meshes and creating closed surfaces. The ear canal was truncated about 4.2 mm from the tympanic ring. Figure 1b displays the medial view of the chinchilla left bulla in Amira with the surface triangulation meshes.
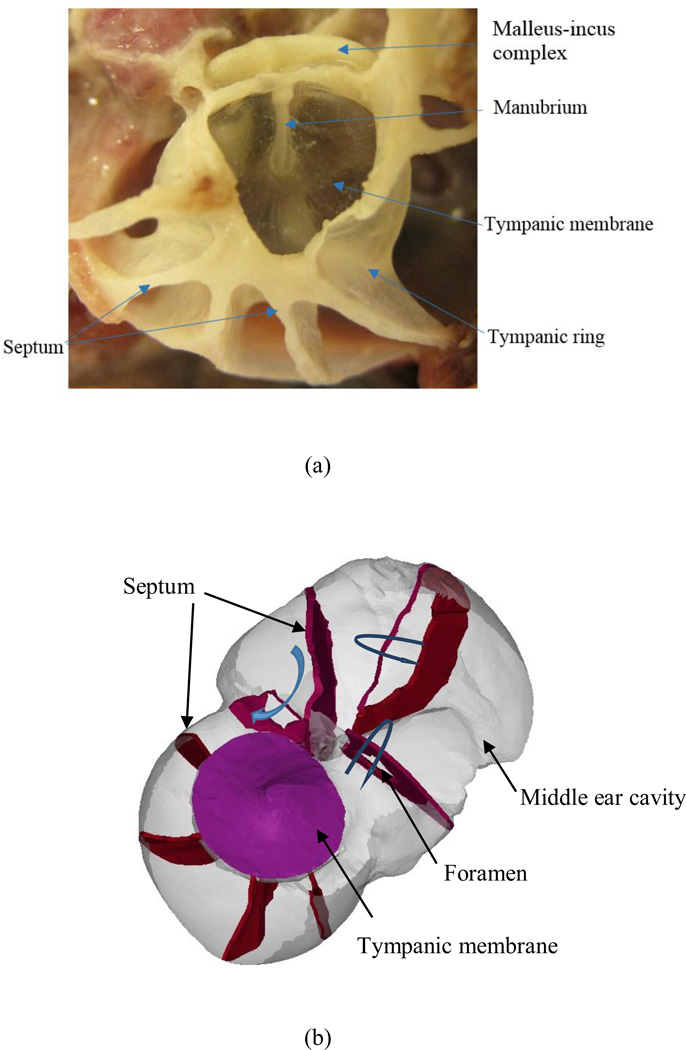
Considering the complex internal bonny structures of the bulla, we performed visual observation of the space and shape of the internal structures within the bulla to identify the anatomical details in the object images. As an example of the visual observation, Fig. 2 displays the lateral view of the chinchilla right temporal bone after the lateral bony wall of the bulla was removed to exhibit the region surrounding the TM.
Figure 2.
The septum configuration in the chinchilla middle ear cavity. a Lateral view of a chinchilla right temporal bone displaying the structures surrounding the TM. The lateral bony wall of the bulla was removed to exhibit the multiple bone struts supporting the bony meatus and tympanic ring. b Medial view of the septum configuration in the model showing superior and inferior bullae and their interconnecting foramina.
Table 1 lists characteristic dimensions of the chinchilla middle ear including those of the ear canal, TM, malleus-incus complex, stapes, and middle ear cavity. Note that the model of the cochlea was not included in this paper for the sake of conciseness and to avoid distracting from the focus on the middle ear.
Table 1.
Dimensions in the FE model of chinchilla middle ear
| Structure | Model | Published data |
|---|---|---|
| Ear canal | ||
| Volume (mm3) | 43.73 | |
| Tympanic membrane | ||
| Diameter along manubrium (mm) | 8.83 | 8.32 a |
| Diameter perpendicular to manubrium (mm) | 9.72 | 8.53 a |
| Height of the cone (mm) | 1.65 | 1.78 a |
| Surface area (mm2) | 74.71 | 60.44 a, 61.48b |
| Thickness (µm) | 15 | 7–10c, ~25d |
| Malleus-incus complex | ||
| Malleus lever arm (manubrium) (mm) | 4.59 | 4.50 a, 5.13b |
| Total length of malleus (mm) | 5.92 | |
| Incus level arm (mm) | 1.22 | 1.58 a, 1.40b |
| Length of rotational axis (mm) | 6.31 | 6.08 a |
| Distance between Levels (mm) | 1.93 | 1.90 a |
| Lever ratio | 3.76 | 2.84 a, 3.66 b |
| Stapes | ||
| Height (mm) | 1.58 | |
| Length of footplate (mm) | 2.32 | |
| Width of footplate (mm) | 1.04 | |
| Area of footplate | 2.43 | 1.98 a, 1.90b |
| Middle ear Cavity | ||
| Volume (mm3) | 2668 | 1530 a, 2313b 2800e |
2.2 FE model of middle ear components
All surfaces of the geometry model built in Amira were translated into HyperMesh (Altair Computing, Inc., Troy, MI) to generate FE meshes for the middle ear components. The ossicles, the bony walls of the middle ear cavity, and the ear canal had clear geometry after reconstruction in Amira. The middle ear ligaments and muscle tendons were generated based on µCT images, visual observation, and the descriptions of those tissues by Vrettakos et al. (1988). The middle ear components of the FE model included the TM, malleus-incus complex, incudostapedial (IS) joint, stapes, posterior incudal ligament (PIL), anterior mallear ligament (AML), stapedial annular ligament (SAL), posterior stapedial tendon (PST), tensor tympani tendon (TTT), bony septa, and the outer skull of middle ear cavity.
The chinchilla middle ear cavity is naturally divided into two main chambers, the superior and inferior bullae, by thin bony plates called septa (Hanamure and Lim, 1987). Figure 2(a) shows that the multiple septa support the bony meatus and tympanic ring belonging to the inferior bulla. The superior bulla is also divided by septa. Based on observation of the chinchilla bony structure, three septa were built inside the superior bulla cavity, and five septa in the inferior bulla cavity in the FE model. The real geometry of the septum was extremely irregular, and a simplified treatment of the shape and thickness of the septa was adopted in the model. Each septum was assumed to be a constant thickness, and connected the tympanic ring to the cavity wall in the inferior bulla and buttressed the cavity wall in the superior bulla. Figure 2(b) shows the simplified septum structure and configuration of the model in medial view. The curved arrows represent the connection of the air chambers through the foramina.
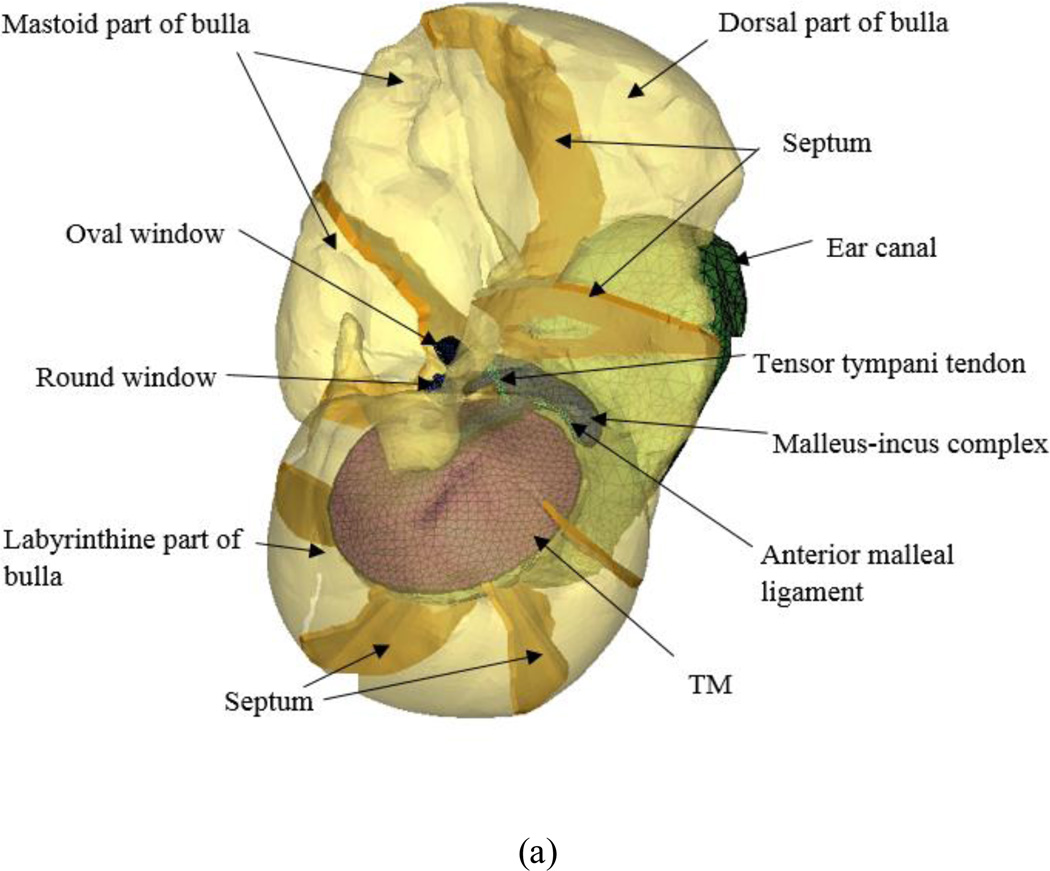
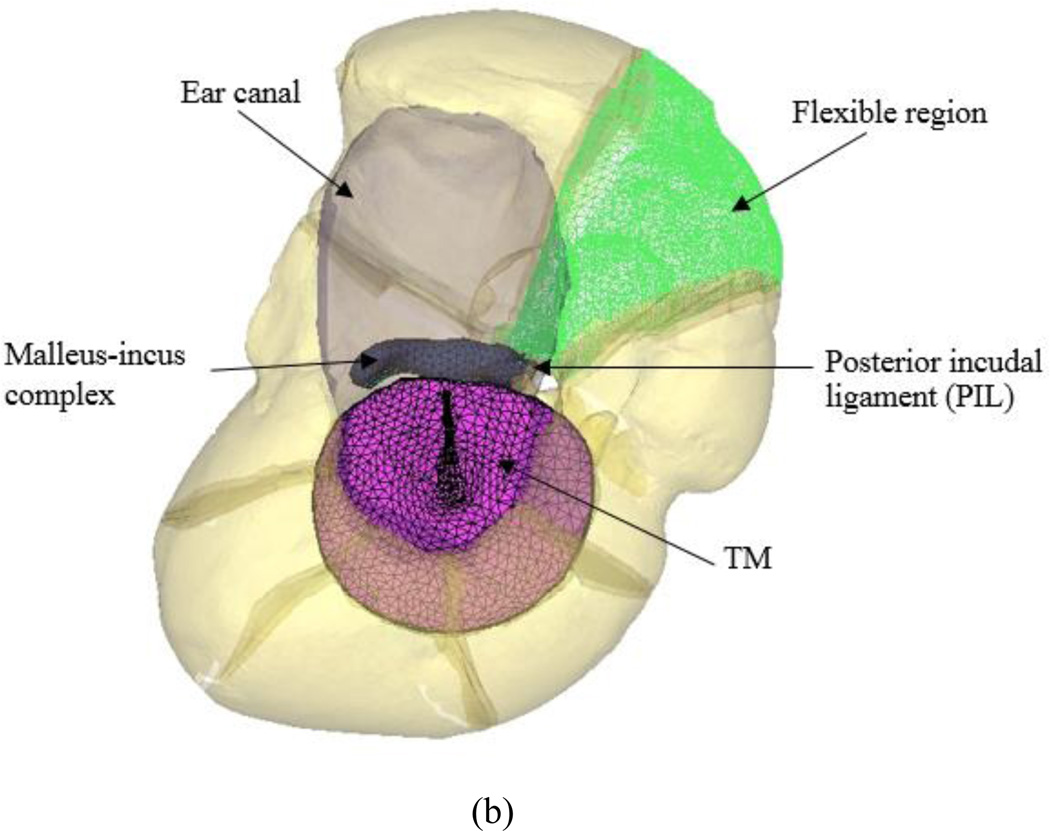
Figure 3 shows the FE model of chinchilla ear consisting of the bony ear canal, TM, ossicular chain, middle ear ligaments and tendons, septa, and middle ear cavity from medial view (Fig. 3a) and lateral view (Fig. 3b). All of the elements were meshed by four-node elements. The air spaces in the ear canal and middle ear cavity were meshed by 17,798 and 179,249 acoustic elements, respectively. The TM was meshed by 951 solid elements, and the manubrium had 535 solid elements. The chinchilla possesses a fused malleus and incus (Vrettakos et al. 1988). In this study, the whole malleus-incus complex was treated as a homogeneous material. The malleus-incus complex and stapes had 5,515 and 3,854 solid elements, respectively. The IS joint was meshed by 8,638 solid elements. The suspensory ligaments and SAL were divided into 1,474 and 1,415 solid elements, respectively. The whole FE model consisted of 219,689 elements and 47,240 nodes.
Figure 3.
FE model of the chinchilla ear with the external ear canal and middle ear inside the bulla. a Medial view of the model. The middle ear cavity was rendered transparently and the septa were displayed as 3D solid. b Lateral view of the model. The ear canal, middle ear cavity and septa were rendered transparently. The flexible region was used for modeling the acoustic coupling boundary of BC2and displayed as mesh lines.
2.3 Boundary conditions
The displacement boundaries of the middle ear vibration system (TM and ossicular chain) consisted of the tympanic annulus, middle ear suspensory ligaments/muscle tendons, and SAL. The tympanic annulus, SAL, and suspensory ligaments were all fixed at the middle ear cavity wall.
Two types of fluid-structure interactions were defined in the acoustic elements of the ear canal and middle ear. Each surface next to a movable structure, such as the TM, ossicles and round window membrane (RWM), was defined in the model as a fluid-structure interface (FSI) where the acoustic pressure was coupled into structural analysis. Each surface next to a fixed bony structure, such as the ear-canal wall and middle-ear cavity wall, was assumed to be fixed and assigned with an acoustic impedance.
In published experimental studies on chinchilla middle ear function, different conditions on the middle ear cavity wall were reported: the natural structure of sealed cavity, the experimentally vented cavity, and the opened cavity. It was a common process to place a long, narrow ventilation tube in the cavity for obtaining “closed-cavity” conditions without the build-up of static pressure (Ruggero et al., 1990; Rosowski et al., 2006). The cavity with the small ventilation tube is considered equivalent to a completely closed cavity except at very low frequencies.
In FE models of the middle ear, the sealed middle ear cavity was commonly simulated as an acoustically rigid boundary for human (Gan et al., 2004) and guinea pig (Koike et al. 2002). In acoustics, the rigid boundary implied the Neumann boundary with ∇P · n = 0 (n is the normal vector of the boundary) along the bony wall. In addition to the rigid wall model of cavity boundary, Tuck-Lee et al. (2008) applied an elastic boundary to model the closed middle ear cavity of cat in which the epithelial and mucosal linings of the whole cavity wall were simulated as elastic structures.
The air chambers and boundary conditions of the middle ear cavity may contribute fundamental features to the acoustic coupling of the ear (Rabbitt, 1990). It is a challenge to accurately identify and simulate the acoustic boundary conditions of the middle ear cavity. In this study, we created two boundary conditions for the middle ear cavity wall to model the different cavity boundaries as described below:
Acoustic Boundary Condition 1 (BC1): BC1 represents the natural or sealed middle ear cavity wall as a rigid structure. Considering the acoustic absorption condition of the middle ear cavity wall, the surfaces of acoustic elements next to the cavity bony wall were assigned the impedance value of 150,000 Pa·s/m3. This value was based on the estimate of acoustic absorption coefficient between the epithelial and mucosal linings of the bony structure and air media (Gan et al. 2006).
Acoustic Boundary Condition 2 (BC2): BC2 represents the middle ear cavity wall as a partially flexible structure, in which the cavity wall was divided into two regions: rigid region and flexible region. The flexible region is capable of either representing a deformable structure on the cavity surface, or approximately simulating a vented wall as an equivalent flexible component, where the boundary impedance is unknown. For the model of the partially flexible cavity wall, inspired by the dynamic model of a micro-perforated or porous plate coupled with acoustic wave (Horoshenkov and Sakagami, 2001; Takahashi and Tanaka, 2002; Yu et al., 2014), the fluid-structure interaction was used to represent the boundary impedance. An approximate approach to treat the acoustic coupling due to the small ventilation holes or a deformable structure was employed in the BC2 boundary. Assuming the fluid-structure interaction takes place within a limited region, the affected region was simplified as an equivalent flexible shell structure. Applying the definition of boundary admittance, the boundary conditions for acoustic media at the surface of the shell is written as (Horoshenkov and Sakagami, 2001)
| (1) |
where ρ0 is the density of air, and the shell’s velocity, frequency, and surface acoustic impedance are Vp, ω, and Zin, respectively.
To achieve the boundary condition of the affected region in Eq. (1), the flexible shell was parameterized by the thickness, density, and Young’s modulus. When a FSI is applied to couple the shell and acoustic domain within the bulla, the partially flexible boundary can simulate the pressure gradient across the cavity wall in the assumed region. Moreover, utilizing the partially flexible boundary condition, the elastic structure existing on the cavity wall can be directly modeled as an elastic shell applied FSI coupling condition. In this study, a thickness of 0.1 µm, Young’s modulus of 2 MPa and Raleigh damping coefficient (β) of 1.5×10⁻⁵ s were used for the material properties of the shell elements. The effect of the location of flexible region was analyzed and it was found that there was a very small effect on the middle ear admittance when the flexible region was located within the area of the superior bulla wall. The flexible region used in this paper is shown in Fig. 3b with mesh lines. The rest of the cavity wall except for the flexible region (Fig. 3b) was defined as the rigid structure; the acoustic elements next to the rigid region were assigned the impedance value of 150,000 Pa·s/m3.
The effect of cochlear fluid on acoustic-mechanical transmission through the ossicular chain was modeled as dashpots attached between the stapes footplate and fixed bony wall. The average cochlear impedance was about 100 GΩ as reported by Slama et al. (2010). The cochlear load was modeled as a mass block and 10 dashpots. The mass block was assumed to be 0.55 mg. The value of 100 GΩ cochlear impedance applied on 2.45 mm2 of oval window was used to determine the dashpot damping, which resulted in a damping coefficient of 0.06 Nm/s for each dashpot.
2.4 Material properties
Table 2 lists the mechanical properties of the middle ear soft tissues used in the model. Due to small displacements of the TM and middle ear ossicles in response to sound pressure, all solid materials in the model were assumed to be linear and elastic.
Table 2.
Mechanical properties of middle ear soft tissues
| Structure | Parameters |
|---|---|
| Tympanic membrane | |
| Elastic modulus (MPa) :Pars tensa | 200 |
| Pars flaccida | 15 |
| Density (kg/m3) | 1100 |
| Damping coefficient | 1.00×10⁻⁴ |
| Manubrium | |
| Elastic modulus (MPa) | 800 |
| Density (kg/m3) | 1200 |
| Damping coefficient | 7.5×10⁻⁵ |
| Incudostapedial (IS) joint | |
| Elastic modulus (MPa) | 6 |
| Density (kg/m3) | 1000 |
| Damping coefficient | 7.5×10⁻⁵ |
| Stapedial annular ligament (SAL) | |
| Elastic modulus (MPa) | 0.1 |
| Density (kg/m3) | 1000 |
| Damping coefficient | 7.5×10⁻⁵ |
| Anterior malleal ligament (AML) | |
| Elastic modulus (MPa) | 3.2 |
| Density (kg/m3) | 1000 |
| Damping coefficient | 1.0×10⁻⁴ |
| Posterior incudal ligament (PIL) | |
| Elastic modulus (MPa) | 2.5 |
| Density (kg/m3) | 1000 |
| Damping coefficient | 7.5 ×10⁻⁴ |
| Posterior stapedial tendon (PST) | |
| Elastic modulus (MPa) | 2.0 |
| Density (kg/m3) | 1000 |
| Damping coefficient | 7.5×10⁻⁵ |
| Tensor tympani tendon (TTT) | |
| Elastic modulus (MPa) | 2.0 |
| Density (kg/m3) | 1000 |
| Damping coefficient | 7.5×10⁻⁵ |
| Malleus-incus complex | |
| Elastic modulus (GPa) | 14.1 |
| Density (kg/m3) | 2000 |
| Mass (mg) | 12.05 |
| Damping coefficient | 1.5×10⁻⁴ |
| Stapes | |
| Elastic modulus (GPa) | 14.1 |
| Density (kg/m3) | 1300 |
| Mass (mg) | 0.55 |
| Damping coefficient | 1.0×10⁻⁴ |
Material properties of the TM have major effects on the middle-ear response to sound stimulation in the ear canal. As reported by Zhang and Gan (2013), the mean storage modulus of the human TM was from 15.1 to 27.6 MPa across the frequency range from 1 to 3,800 Hz. For the Young’s moduli of small animals, Aernouts and Dirckx (2012) estimated the Young’s modulus ranging from 79 to 118 MPa at 8.2 Hz for the pars tensa of gerbils. Fay estimated the Young’s modulus of fiber layer ranged 100–220 MPa posterior and 200–400 MPa anterior for the cat TM. Recently, our experimental results showed that the Young’s modulus of the chinchilla pars tensa was about 6–10 times higher than that of the human pars tensa (Yokell et al., 2015). The Young’s modulus of the TM was determined by the cross-calibration of the TM and FP displacements (Sun et al. 2002), and a modulus value of 200 MPa was achieved for the pars tensa of TM in this study. Young’s modulus of the pars flaccida was assumed to be 12 MPa.
There is no published data for material properties of chinchilla middle ear ligaments. The material property data of chinchilla middle ear ligaments in the model were based on the data of the human ear. Cheng and Gan (2008a) reported that the Young’s modulus of the anterior mallear ligament of human ear varied from 0.22 to 4.7 MPa as the stress increased from 0 to 0.5 MPa. They also reported that the stapedial and tensor tympani tendons had almost the same Young’s modulus (Cheng and Gan, 2007, 2008b). In the guinea pig model reported by Koike (2002), Young’s modulus of the PIL, PST, TTT and AML was assumed to be 2, 4, 1 and 5 MPa, respectively. In this study (see Table 2), the Young’s modulus of the PIL was set to 2.5 MPa, and Young’s moduli of the PST, TTT and AML were assumed to be 2.0, 2.0 and 3.2 MPa, respectively. In a recent measurement by Zhang and Gan (2014) in human temporal bones, the mean storage shear modulus of the SAL ranged from 31.7 to 61.9 kPa at frequency ranging from 1 to 3,760 Hz. Using this result and considering the relationship between shear modulus and Young’s modulus, an elastic modulus of 0.1 MPa was set for the chinchilla SAL. The Young’s modulus of the IS joint was determined by the cross-calibration of the stapes footplate displacement. A modulus value of 6 MPa was finally used in the model.
The ossicles were modelled with a Young’s modulus of 14.1 GPa and a Poisson’s ratio of 0.3, which were the same as those used in the FE model of the human ear (Gan et al. 2004).
Considering the complexity of dynamic properties of middle ear tissues and a lack of measurement in damping parameters, the Raleigh damping coefficients of the ligaments were assumed as α=0/s and β =7.5×10⁻⁵ s, the values were used in our previous middle ear model of the human ear (Gan et at., 2004, 2006). In this study, the stiffness damping coefficient β of the TM and ossicular chain was increased to 1.5×10⁻⁴ and 1.0×10⁻⁴ s, respectively, and α was still zero, so that the model-predicted TM displacement matched well with the experimental result (Guan et al. 2014)
For soft tissues in the middle ear, a density of 1000 kg/m3 was chosen, except for the density of the TM. Considering the higher elastic modulus of chinchilla TM, the TM may have a higher proportion of fibers than those of other middle ear soft tissues. The density of TM was assumed to be 1100 kg/m3, which is the same as that of cat TM used by Tuck-Lee et al. (2008). Buytaert et al. (2011) provided average density values for the malleus, incus and stapes in gerbil ossicles. They reported the density of 1,740 kg/m3 for the malleus and incus, and 1,370 kg/m3 for the stapes. The mass of malleus–incus complex, manubrium and stapes were respectively 11.8 mg, 0.2 mg and 0.4 mg as reported by Vrettakos et al. (1988). Based on these values and the volumes measured in the present model, the approximate density of malleus–incus complex, stapes and manubrium was 2,000, 1,300 and 1,200 kg/m3 respectively. The density of stapes used for chinchilla model was close to that of gerbil. The density of malleus-incus complex was higher than that of gerbil, but lower than that of human (Gan et al. 2004).
2.5 Finite element analysis
Acoustic-structure coupled FE analysis was conducted to calculate the middle ear transfer function and middle ear admittance when sound pressure was applied in the ear canal. For calculation of the middle ear transfer function, a uniform acoustic pressure over the frequency range of 100 – 10,000 Hz was applied 2 mm away from the TM and harmonic analysis was conducted using ANSYS (ANSYS Inc., Canonsburg, PA).
For calculation of middle ear admittance, a uniform normal velocity, representing a volume velocity input, was applied at the entrance of the bony ear canal. The canal entrance of the model was a reference location for middle ear admittance in this study. The ear canal pressure and middle ear response were derived. The input admittance YTM at this reference location is defined as the mean volume velocity of UC at the location normalized to the sound pressure in the ear canal (PCa). YTM can be calculated as: The unit of acoustic admittance is siemens (S) where 1S equals 1 m3/Pa/s.
3 RESULTS
3.1 Middle ear transfer function
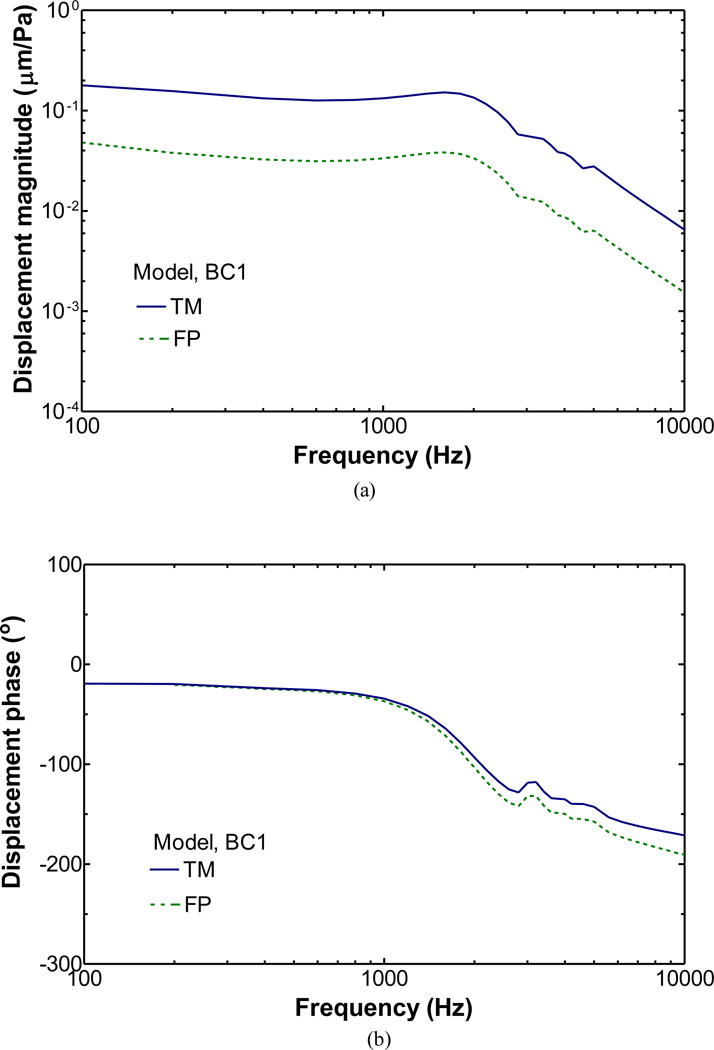
Figure 4 shows the umbo and FP displacement curves across the frequency range from 100 to 10,000 Hz derived from the BC1 boundary condition of middle ear cavity. The magnitude of the TM and FP displacement along the direction perpendicular to the footplate was normalized by the input sound pressure and expressed in units of µm/Pa. The mean TM displacement at the umbo, as shown in Fig. 4a, was 0.14 um/Pa at low frequencies. At 1,600 Hz the TM displacement of the model showed a resonance peak. The mean displacement of FP was about 0.037 µm/Pa at frequencies of 100–2,000 Hz. The maximum displacement of the FP curve also occurred at 1,600 Hz. Figure 4b shows the phase curves of the umbo and FP displacements and these two curves were very similar from 100 to 10,000 Hz. The stapes phase lagged relative to the umbo about 4 degrees at 1,000 Hz.
Figure 4.
TM and FP displacement curves derived from the chinchilla ear model under BC1 boundary condition. a Magnitude; b Phase.
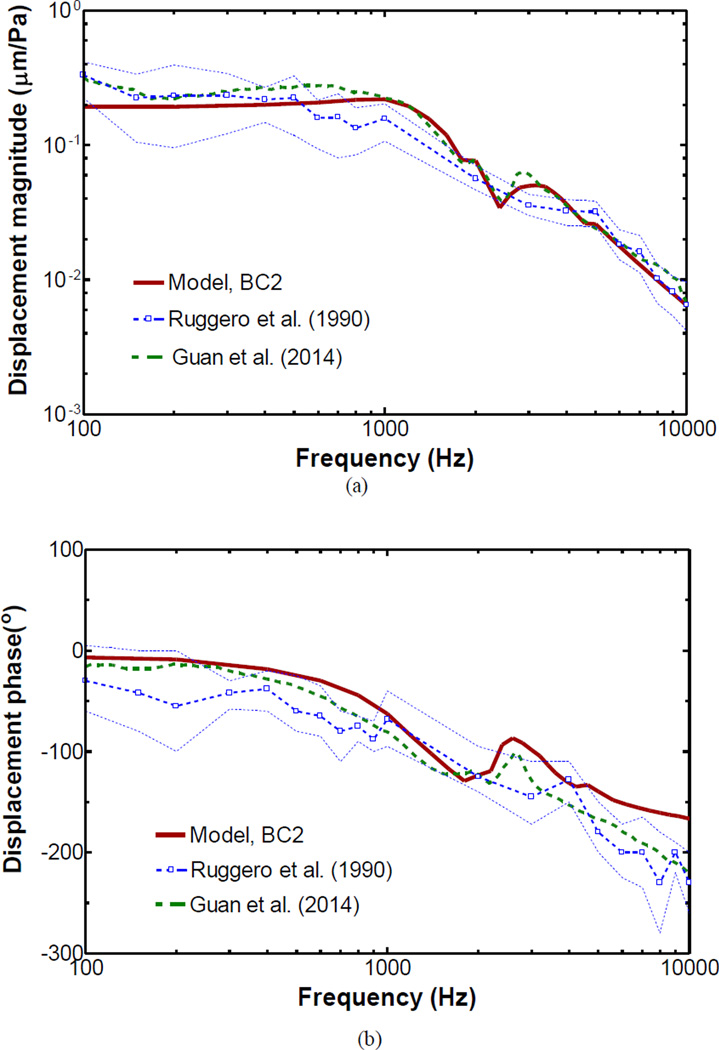
Figure 5 shows the frequency response curve of the TM displacement at umbo derived from the FE model with BC2 boundary condition (solid lines) in comparison with the published measurements in chinchillas by Ruggero et al. (1990) and Guan et al. (2014) in magnitude (Fig. 5a) and phase (Fig. 5b). Note that the scales of the published data were adjusted and normalized by the input sound pressure. As shown in Fig. 5a, the umbo displacement derived from model was about 0.2 µm/Pa at low frequencies, slightly lower than the measurements. At frequencies f > 800 Hz, the umbo displacement matched well with the measurements by Guan et al. (2014). At frequencies of 500–4,000 Hz, the model-derived TM displacement was a slightly higher than the data by Ruggero et al. (1990). An important feature in the TM displacement measured by Guan et al. (2014) was the notch appearing at about 2,400 Hz. The model-derived curve shows a minimum of TM displacement at 2,400 Hz which well reflected the feature observed in the experimental results. In addition, the corresponding phase curves displayed in Fig. 5(b) also generally agreed the experimental data except for the less lag at frequencies above 2,000 Hz.
Figure 5.
FE model-derived TM displacement with BC2 acoustic boundary condition in comparison with the published experimental data. The dash-dotted line represents the measurements by Guan et al. (2014). The dashed line with open square symbols represents the mean displacement measured at the tip of the manubrium by Ruggero et al. (1990), and the thin dashed lines denote ±1 standard deviation from the mean. a Magnitude; b Phase.
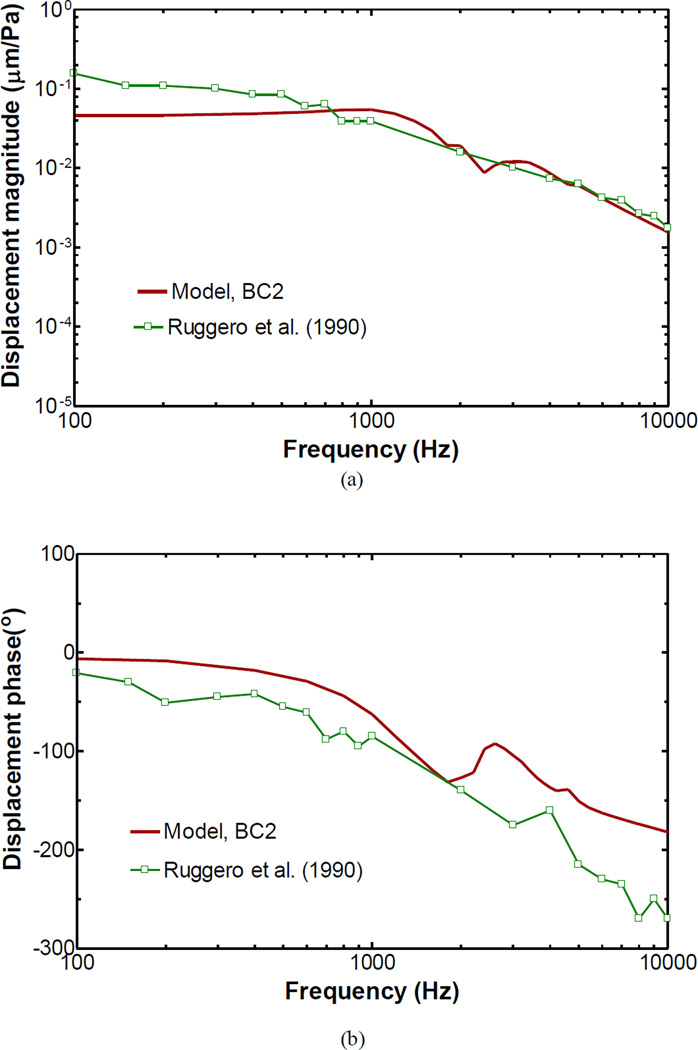
Figure 6 shows the model-derived frequency response curve of the footplate displacement with the BC2 boundary condition in comparison with the published data (Ruggero et al. 1990) across the frequency range of 100 to 10,000 Hz. Figure 6a displays the magnitude and Fig. 6b the phase angle. As can been seen in Fig. 6, the FE model-derived FP displacement curve was consistent with Ruggero’s data at high frequencies, but the magnitude was lower than the measured displacement at f < 500 Hz. Comparing with the measured phase curve, the model result showed a small delay, and a flat phase changed above 2,500 Hz.
Figure 6.
FE model-derived FP displacement with BC2 acoustic boundary condition in comparison with the published experimental data. The line with open square symbols represents the mean stapes displacement in intact bullas reported by Ruggero et al. (1990). a Magnitude; b Phase.
Observing Figs. 4, 5 and 6, the results from BC2 boundary condition better reflect the features in the TM and FP displacements.
3.2 Middle ear admittance
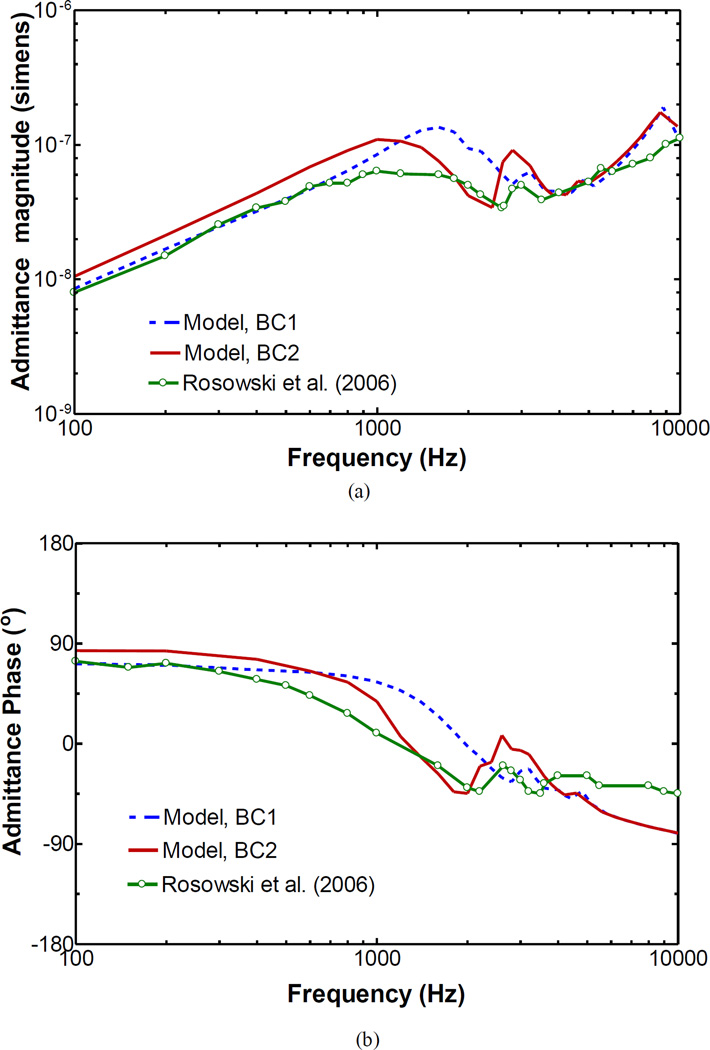
The middle ear input admittances calculated from the FE model of chinchilla middle ear with both BC1 and BC2 boundary conditions are shown in Fig. 7. The middle ear admittance measured by Rosowski et al. (2006) of the closed and vented bulla was also included in the figure for a comparison. As can be observed at frequencies below 1,000 Hz, the model-derived admittance magnitude increased proportionally with frequency. For BC1 boundary condition, the computed magnitude curve was close to the experimental result at frequencies below 800 Hz, but the magnitude was higher than the experimental data at between 1,000 and 3,000 Hz. The phase from modeling curve was flatter than the measured one at low frequencies. For BC2 boundary condition, the admittance magnitude reached a maximum of 1.45×10⁻⁷ S at 1,000 Hz and then decreased to a notch at 2,400 Hz with a value of 3.42×10⁻⁸ S. In addition, a small peak at 2,800 Hz was apparent which is also shown in the experimental data. At frequencies above 4,000 Hz, both boundary conditions had little effects on the admittance.
Figure 7.
FE model-derived middle ear admittance with BC1 and BC2 boundary conditions in comparison with the published admittance data measured under the vented cavity condition by Rosowski et al. (2006). The solid line with circles symbols represents the mean admittance measurement by Rosowski et al. a Magnitude; b Phase.
3.3 Sound pressure in the middle ear cavity
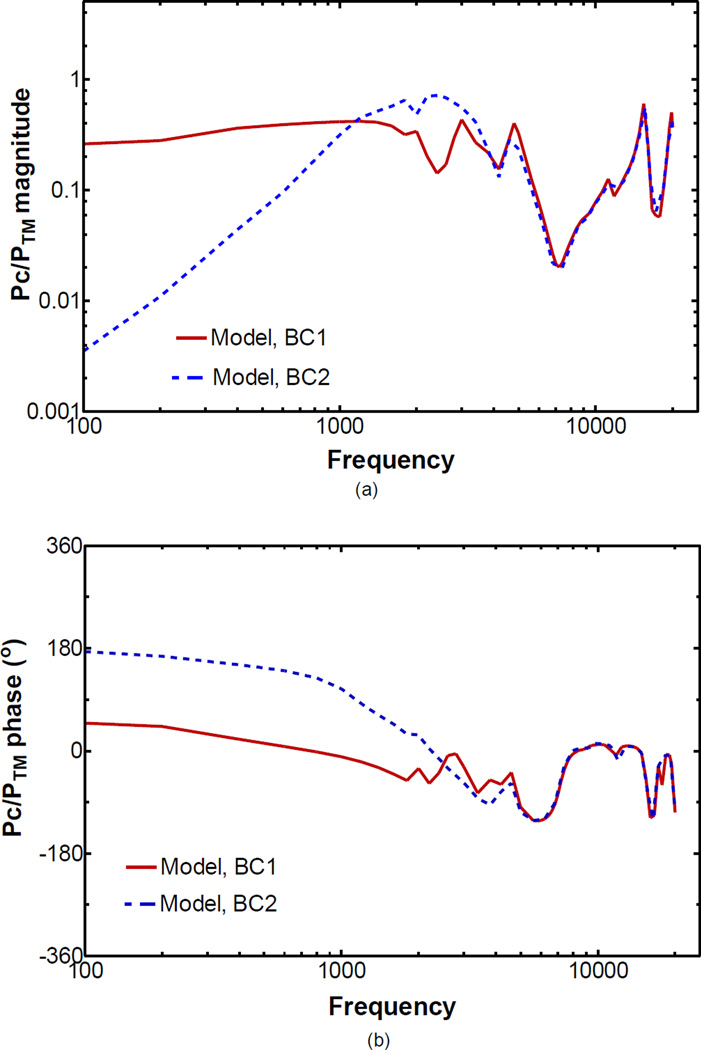
The present study focused on development of a FE model of the chinchilla ear to investigate the middle ear response with various boundary condition models of middle ear cavity. Figure 8 illustrates the tympanic cavity pressure normalized by the ear canal pressure across the frequency range of 100 to 20,000 Hz with BC1 and BC2 boundary conditions. The pressure in the tympanic cavity was computed near the umbo in the cavity side. The cavity pressure for BC1 boundary condition exhibited a flat curve at f < 2,000 Hz and the local maximum at 3,000, 4,800, 15,400 and 19,800 Hz, respectively. Comparing with BC1 boundary, the BC2 boundary resulted in much low cavity pressure at low frequencies, and the pressure increased with frequency at f < 1,800 Hz. BC1 boundary condition produced a middle ear pressure 58 times higher than that of BC2 condition at 100 Hz, and the difference in phase was 115 degrees. At high frequencies (f > 3,500 Hz), the two boundary conditions had little effect on the tympanic cavity pressure. Therefore, the partially flexible cavity wall only affected the tympanic cavity pressure at low frequencies.
Figure 8.
Comparison the effect of acoustic boundary conditions on tympanic cavity pressures predicted by the model. The tympanic cavity pressures (PC) were normalized with respect to the ear canal pressure (PTM) at TM. a Magnitude; b Phase.
3.4 Acoustical role of the septa
One of the unique features of the chinchilla middle ear cavity is the presence of multiple septa that divide the middle-ear air space into multiple air-filled cambers. To gain insight into the role of the septa in acoustic function of the chinchilla middle ear, the admittance was calculated from the model after partial and complete removal of the septa. For the partial removal of the septa, two models were created: one modeled the removal of septa in the superior bulla cavity (superior septa removal), resulting in a connected space of the superior bulla without any bony partitions, but the septa in the tympanic cavity remained intact. The other modeled the removal of the septa in the inferior bulla cavity (inferior septa removal), where the superior septa remained intact. For the complete removal of the septa (no septa), the septa in both superior bulla and the inferior bulla were removed. The purpose for the stepwise septum removal was an attempt to distinguish the acoustic roles of the septa in the superior bulla from those in the inferior bulla.
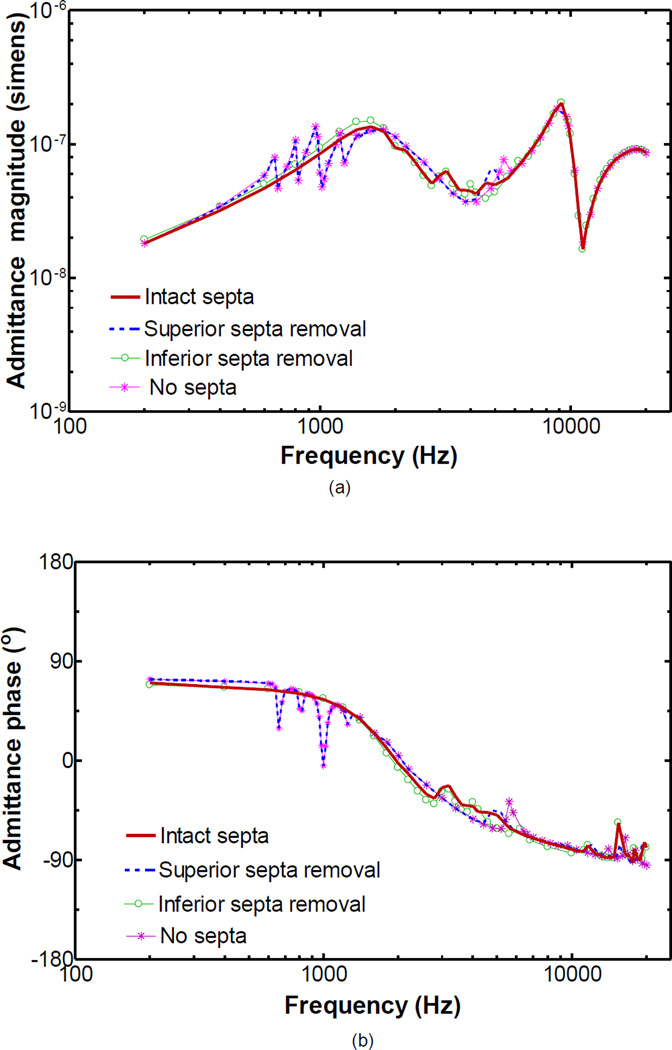
Figure 9 shows a comparison of the admittances across frequency range from 200 to 20,000 Hz under the intact, partial septa, and no septa conditions when the BC1 boundary condition was applied to middle ear cavity. Under the superior septa removal condition, the admittance curve (dotted line) became fluctuant and showed a number of minima and maxima accompanied by rapid shifts in phase angles between 650 and 1,300 Hz. A small admittance peak at 4,900 Hz was observed. When the inferior septa were removed, the admittance (thin line with circles) was little affected by the septa removal. Under the no septa condition, the admittance curve (thin line with asterisk symbols) had little variation from the removal of superior septa, and only the small peak at 4,900 Hz appeared to move upward in frequency to about 5,400 Hz. The results illustrated in Fig. 8 suggest that the septa in the superior bulla cavity act to smooth the middle ear response at medium frequencies and the septa in the tympanic cavity have little effect on the admittance under the assumed BC1 boundary condition of middle ear cavity.
Figure 9.
FE model-derived middle ear admittances with BC1 boundary condition for intact septa (solid line), superior septa removal (dotted line), inferior septa removal (thin line with circle symbols), and no septa (thin line with asterisk symbols). a Magnitude; b Phase.
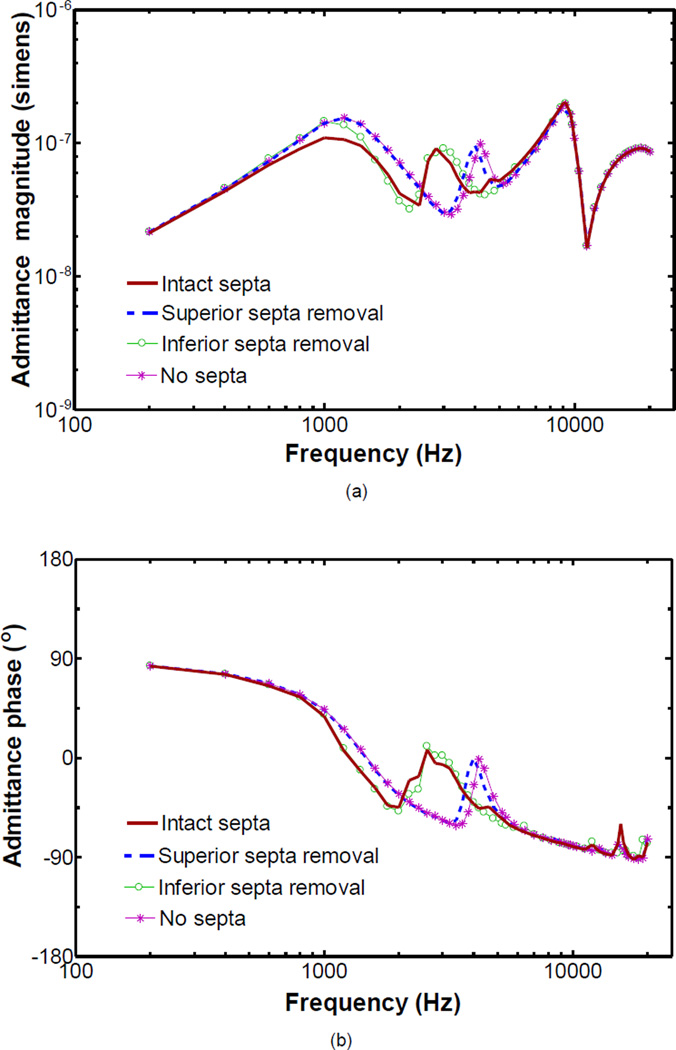
Figure 10 shows the comparison of model-derived frequency response curves of the middle ear admittance across the frequency range from 200 to 20,000 Hz for the intact, partial septa and no septa under the BC2 boundary condition. The effect of the septa on admittance occurred at 800 to 5,000 Hz. The removal of the superior septa increased the admittance from 600 to 2,400 Hz. The notch at 2,400 Hz with the intact septa appeared to move to 3,200 Hz and the peak at 2,800 Hz appeared to move to 4,000 Hz when the septa inside the superior bulla cavity were removed (dotted line). The removal of the inferior septa resulted in a slight increase of the admittance around 1,000 Hz (thin line with circle symbols). Further removal of the septa inside both the superior and inferior cavities (thin line with asterisk symbols) leaded to a slight shift in the peak frequency around 4,000 Hz from the removal of the superior septa.
Figure 10.
FE model-derived middle ear admittances with BC2 boundary condition for intact septa (solid line), superior septa removal (dotted line), inferior septa removal (thin line with circle symbols), and no septa (thin line with asterisk symbols). a Magnitude; b Phase.
4 DISCUSSION
4.1 Model geometry parameters
A 3D FE model of the chinchilla ear was developed based on a complete set of µCT images of a bulla. Compared with the anatomical measurements of the chinchilla middle ear reported by Vrettakos et al. (1988), the main differences were the sizes of the TM, FP, and middle ear cavity as listed in Table 1. The TM surface area (74.71 mm2) in the FE model was larger than the mean surface area (60.44 mm2) measured by Vrettakos. The volume of middle ear cavity in FE model was 2,668.0 mm3, larger than 1,530 mm3 reported by Vrettakos. Besides Vrettakos’ published chinchilla geometry data, the estimated bulla cavity volume of chinchilla varied over a wide range, such as 1,600 mm3 (Rosowski et al. 2006), 2,333 mm3 (Mason, 2001), and 2,800 mm3 (Teas and Nielsen, 1975). The volume of 2,800 mm3 was very close to the FE model. Overall, the present model had a larger bulla size than that reported mean data in the literature. As a result, the large bulla may contribute to a greater compliance of the middle ear air space for the model.
4.2 Middle ear function derived from the model
The model-derived results from acoustic-mechanical coupling allow us to compare the computed middle ear transfer functions from different cavity models with the experimental data, including the TM and FP displacements. The results shown in Fig. 5 demonstrate that the model can capture the major TM displacement features of the chinchilla. Ravicz and Rosowski (2013) pointed out that the TM displacement notch and phase step near 2,500 Hz presented only under the open-hole cavity condition due to a resonance between the bulla air space and the open hole in the bulla wall. In another study of TM vibration by Guan et al. (2014) in which the hole for releasing the middle ear pressure was sealed by dental cement during the TM displacement measurement, the magnitude notch and phase step in the TM displacement curves were still observed. From this study, the BC2 model matched well with the experimental results. The notch in the TM displacement at 2,400 Hz may have been associated with either a flexible structure in the cavity wall or a potential for air-leak artifacts from the cavity.
The comparison of stapes footplate displacements between the FE model and experimental data shown in Fig. 6 suggests that the displacement curve is similar to the experimental data by Ruggero et al. (1990), except that the model displayed a relatively low displacement magnitude at low frequencies. One of the factors resulting in the low footplate displacement was the dimensions of the ossicles in the model. The anatomical ossicular lever ratio, defined as the ratio between the length of the manubrium and the length of the incus long process, was 3.76 in the model as listed in Table 1. The estimated the lever ratio of chinchilla by Ruggero et al. (1990) was 2.94. The anatomical ossicular lever ratio of the model was larger than that of Ruggero’s measurement. Given the same umbo displacement, a high ossicular level ratio may theoretically produce a low FP displacement. The high anatomical ossicular lever ratio in the model was one of reasons resulting in the low FP displacement. However, the ossicular lever ratio has a wide range reported in the literature. Vrettakos et al. (1988) measured the anatomical lever ratio of 2.84 and Mason (2001) reported a level ratio of 3.66 in chinchilla. The anatomical lever ratio of 3.76 of the FE model differed little from the level ratio of 3.66 reported by Mason.
The middle ear admittance derived from the FE model with BC2 boundary condition was generally consistent with the experimental results by Rosowski (2006) as shown in Fig. 7. Slightly high middle-ear admittance was obtained from the BC2 boundary model compared to the measured admittance. One of the reasons causing the difference may be the larger volume of middle ear cavity in FE model. As indicated by Rosowski et al. (2006), the chinchilla cavity air space has a significant effect on the middle ear admittance. In the model, the volume of middle ear air space is 1.67 times larger than the estimated value of 1,600 mm3 by Rosowski et al. (2006).
In summary, good agreements between the middle ear function curves obtained from BC2 model and published experiment data displayed in Figs. 5–7 suggest that the FE model developed in this study is feasible to characterize middle ear functions in chinchillas.
4.3 Effect of boundary condition of middle ear cavity
Two acoustic boundary conditions of the middle ear cavity were used to perform the acoustic-mechanical coupling in 3D FE model of the chinchilla ear. The model-derived results indicated that the BC2 boundary condition resulted in higher TM and stapes displacements than those from BC1 boundary at low frequencies. The TM displacement magnitude with BC2 boundary was about 1.7 times larger than that of BC1 boundary at f < 1,000 Hz. Moreover, the BC2 boundary condition also caused a shift of middle-ear resonance frequency from 1,600 Hz to 1,000 Hz and increased the resonance peak displacement from 0.152 to 0.220 µm/Pa as shown in Fig 5. Recently, Maftoon et al. (2014) reported the effect of the middle ear cavity opening on TM vibration in gerbil, and their measurements demonstrated that an open cavity shifted the middle ear resonance frequencies to lower frequencies. The main increase of TM displacement at low frequencies happened upon the smallest (1 mm) hole in the cavity wall and the further progressive enlarging of the opening had little effect on low-frequency vibration magnitude.
Correlating the TM displacement with the cavity pressure, it was found that the low cavity pressure in BC2 boundary was associated with larger TM displacement at low frequencies. In Fig. 8, the BC2 boundary has much lower tympanic cavity pressure than that of the BC1 boundary at frequencies below 1,000, while the difference of cavity pressure was not significant at high frequencies (f > 3,500 Hz). Thus, the TM displacement was not affected by the boundary conditions at high frequencies. This suggests that the increase of low frequency TM displacement with BC2 boundary resulted from the low cavity pressure.
In Fig. 8, the acoustic pressure in the middle ear cavity was disturbed by the boundary condition. It is noted that several reports in the literature also provided middle ear pressure measurements (O’Connor and Puria, 2006; Voss et al., 2007; Bergevin and Olson, 2014) and pressure calculation (Gan et al. 2006) in relation to frequency. Voss et al. (2007) reported the middle ear pressure measurements in human temporal bones. Their results showed the pressure was nearly independent of frequency at low frequencies, and the pressure drop across the TM was about −12 dB below 1,000 Hz. The nearly frequency-independent feature of pressure difference across the human TM (Voss et al., 2007) at low frequencies is similar to the result in Fig. 8 of BC1 boundary condition in this study. The pressure change across the TM in gerbils reported by Bergevin and Olson (2014), in which a small ventilation hole was presented in the cavity wall, indicated that the pressure increased with frequency at frequencies below 3,000–4,000 Hz (estimated from Fig. 3 of Bergevin and Olson). The pressure difference across the TM in chinchilla model also exhibited the frequency-dependent variations under the BC2 boundary condition and the pressure increased with the frequency below 2,500 Hz, which was similar to the measured results in gerbils with a ventilation hole in the cavity.
The effects of cavity boundary condition in chinchilla model on middle ear responses were estimated through comparison between the rigid and partially flexible boundary conditions of middle ear cavity. The results demonstrated that the vented middle ear cavity or flexible boundary condition in the cavity wall affected the TM displacement and middle ear cavity pressure at low frequencies, and caused the addition of an anti-resonance to the TM and stapes displacements near 2,400 Hz.
4.4 Role of the septa
In many small mammals, the middle ear cavity is divided into multiple, connected cavities by bony septa. Some species have a single septum (e.g., cat), while chinchilla have multiple septa. Guinan and Peake (1967) reported that the opening of septum in cat had a large effect in a rather narrow frequency range from 2,000 to 4,000 Hz. Rosowski et al. (2000) measured the cat middle-ear admittances with intact and removal of septum. They found that the removal of the septa in cat bulla introduced a notch into the middle ear admittance at 10,000 Hz. Tuck-Lee et al. (2008) demonstrated the presence of the septum shift in the middle-ear resonance from near 10,000 to 4–5,000 Hz using a finite element model of cat middle ear with an elastic boundary of the middle ear cavity. According to the hypothesis of septum function, the function of the septum was to shift the middle-ear resonance away from the useful frequency range, so as not to interfere with sound localization (Puria, 1991).
The admittance curves in Fig. 9 indicate that the septa inside the superior bulla cavity acted to smooth the middle ear response at medium frequencies given the BC1 boundary condition of middle ear cavity. The admittance curves in Fig. 10 suggest the superior septa removal caused an upward shift in the resonance frequency of the cavity given the partial flexible boundary condition of middle ear cavity. However, the model results suggest that the septa inside the superior bulla cavity dominate the acoustic effect on middle ear admittance, and the acoustic role of septa may be affected by cavity boundary.
The best hearing sensitivity range of chinchilla is coincident with the best sensitivity range for human, approximately 125 Hz to 16,000 Hz (Heffner and Heffner, 1991). Unlike chinchilla, the cat’s hearing spans a range from 48 Hz to 85,000 Hz, and good hearing is from 500 Hz to 32,000 Hz. It is well known that the septum of cat results in a shift of middle-ear resonance at medium-high frequencies. The present results indicate that the septa of chinchilla affect the middle ear response at low-medium frequencies. From a comparison between cat and chinchilla, the different frequencies benefiting from septa on middle-ear function reveals the role of septa which may be associated with the different audible frequency ranges.
4.5 Effect of model parameters on middle ear admittance
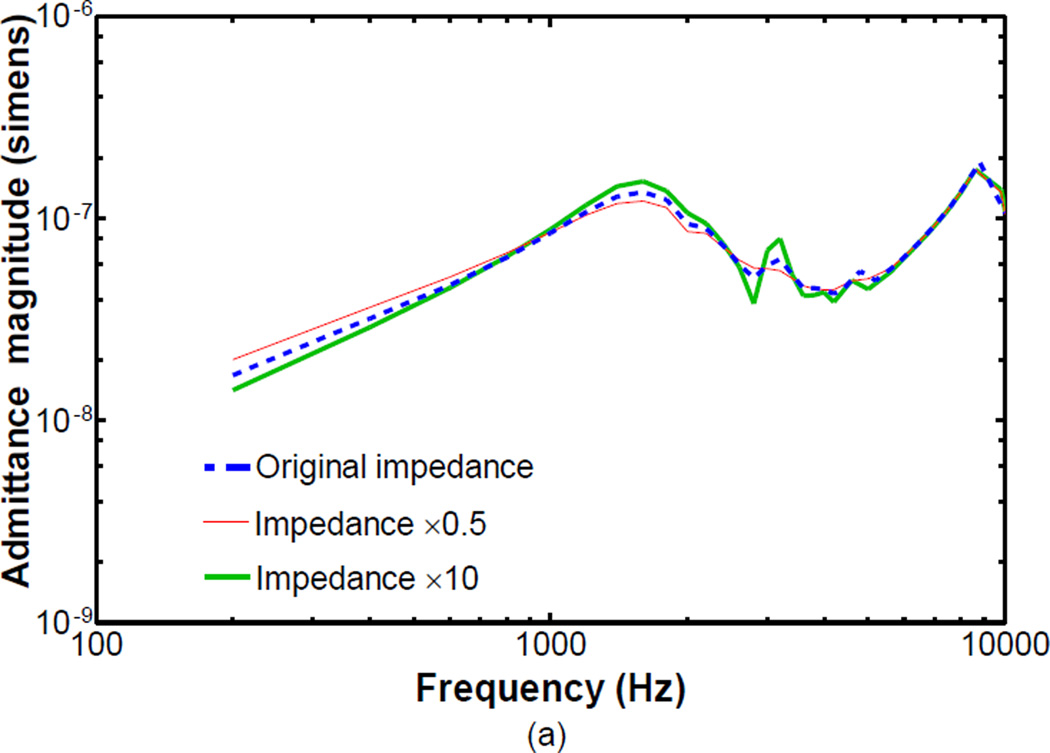
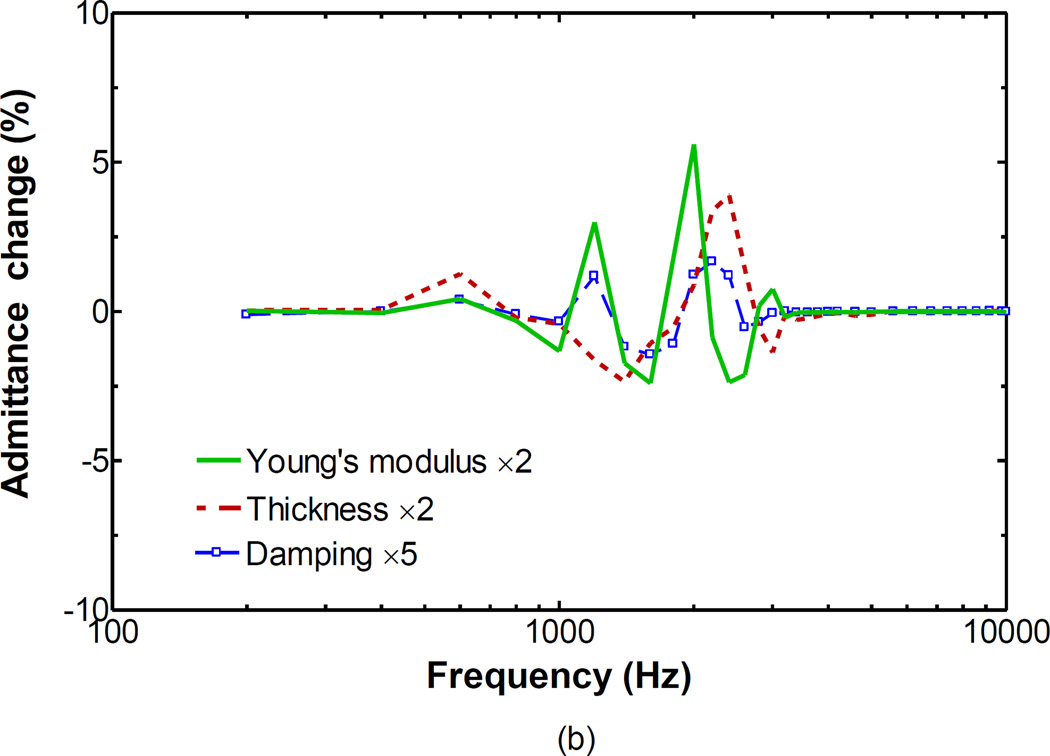
Because of a lack of acoustic property data of the middle ear cavity, the acoustic boundary of the chinchilla middle ear cavity was simulated based on two boundary condition models. The acoustic parameters were approximately determined by fitting the umbo displacement and middle ear admittance curves. Figure 11 displays how the middle ear admittance was affected by boundary parameters. In BC1 boundary condition, the boundary impedance was set to vary from 0.5 to 10 times its original value, and the model predicted middle ear admittances are shown in Fig. 11(a). Further increasing the boundary impedance, the curve almost coincided with that of 10 times impedance (not shown in the figure). The admittance magnitude was reduced with the increase of the boundary impedance of BC1 condition at low frequencies. At frequencies from 2,500 to 5,000 Hz, the increasing of boundary impedance resulted in the increasing fluctuation of the admittance. At the high frequencies, there was no significant variation of admittance as the boundary impedance increased. In BC2 boundary condition, the main model parameters of the flexible region consist of the Young’s modulus, thickness and damping coefficient. Figure 11(b) shows the variations of middle ear admittance when the model parameters varied from the original values. As can be seen in this figure, the BC2 model parameters affected the admittance in the frequency range from 500 to 3,500 Hz. When the Young’s modulus or thickness of the BC2 model was changed to 2 times the original value, the maximum change of admittance was generally less than 5%. Another parameter of the BC2 boundary condition is the damping coefficient. A 5-fold increase of the damping coefficient resulted in a change of less than 1.68% in the admittance.
Figure 11.
Effects of the acoustic model parameters on middle ear admittance. a FE model-derived middle ear admittance curves with various impedance in BC1 boundary condition; b FE model-derived middle ear admittance changes in response to variations in model parameters of BC2 boundary condition.
It should be noted that the material properties used for the middle ear components in the model are the best available in the literature, yet there may be some uncertainty in the material properties of individual tissues. The parameters in Table 2 should be considered to be acceptable for function validation of the model, but may not be the absolute values of tissue mechanical properties. Moreover, the FE model-derived results showed that the partially flexible boundary condition provided a better agreement to the experimental measurements in fine structure of the TM and FP displacement and middle ear admittance curves. However, there are two possibilities leading to the partially flexible boundary model based on the present model. One is flexible structure, the other is effect of the vented cavity. Further studies are required to clarify these questions. Additionally, the opened cavity condition used in experimental measurement has not been modeled yet. The effect of the different middle ear cavity conditions on the TM motion needs further studies.
5 CONCLUSION
A 3D finite element model of the chinchilla ear was developed based on X-ray micro-CT images to simulate the TM and FP displacements and the middle ear admittance. The FE model of the chinchilla ear consists of the ear canal, TM, middle ear ossicles and suspensory ligaments, and the middle ear cavity. Two boundary conditions of the middle ear cavity were created in the model to simulate the rigid and partially flexible cavity boundaries. Acoustic-mechanical coupled analysis was conducted with these two conditions to characterize the middle ear transfer function of the chinchilla ear. The FE model results were compared with experimental data reported in the literature including the TM and footplate displacements and the middle ear input admittance. The model results indicated that the vented middle ear cavity or the flexible boundary increasing TM displacement at low frequencies was due to low pressure in the tympanic cavity. An application of this model was presented to identify the acoustic role of the middle ear septa - a unique feature of chinchilla middle ear cavity. The 3D FE model of the chinchilla ear developed from this study provides a useful research tool for characterizing the middle ear functions through acoustic-mechanical coupled FE analysis.
Acknowledgments
The authors thank the former graduate student Dr. Xiying Guan for his work on image processing of the middle ear ossicels and the undergraduate students Rebecca L. Browder and Kegan W. Leckness for their participations in 3D-reconstruction of the chinchilla model at the University of Oklahoma. This work was supported by NIH R01DC011585.
REFERENCES
- Browning GG, Granich MS. Surgical anatomy of the temporal bone in the chinchilla. Ann Otol Rhinol Larynqol. 1978;87(6):875–883. doi: 10.1177/000348947808700616. [DOI] [PubMed] [Google Scholar]
- Buytaert JAN, Salih WHM, Dierick M, Jacobs P, Dirckx JJJ. Realistic 3D Computer Model of the Gerbil Middle Ear, Featuring Accurate Morphology of Bone and Soft Tissue Structures. Journal of the Association for Research in Otolaryngology. 2011;12(6):681–696. doi: 10.1007/s10162-011-0281-4. [DOI] [PMC free article] [PubMed] [Google Scholar]
- Bergevin C, Olson ES. External and middle ear sound pressure distribution and acoustic coupling to the tympanic membrane. J Acoust Soc Am. 2014;135(3):1294–1312. doi: 10.1121/1.4864475. [DOI] [PMC free article] [PubMed] [Google Scholar]
- Cheng T, Dai C, Gan RZ. Viscoelastic Properties of Human Tympanic Membrane. Ann of Biomed Eng. 2007;35(2):305–314. doi: 10.1007/s10439-006-9227-0. [DOI] [PubMed] [Google Scholar]
- Cheng T, Gan RZ. Mechanical properties of stapedial tendon in human middle ear. ASME J Biomech Eng. 2007;129(6):913–918. doi: 10.1115/1.2800837. [DOI] [PubMed] [Google Scholar]
- Cheng T, Gan RZ. Mechanical properties of anterior malleolar ligaments from experimental measurement and material modeling analysis. Biomech Model Mechanobiol. 2008a;7(5):387–394. doi: 10.1007/s10237-007-0094-x. [DOI] [PMC free article] [PubMed] [Google Scholar]
- Cheng T, Gan RZ. Experimental measurement and modeling analysis on mechanical properties of tensor tympani tendon. Med Eng Phy. 2008b;30(3):358–366. doi: 10.1016/j.medengphy.2007.04.005. [DOI] [PubMed] [Google Scholar]
- Elkhouri N, Liu H, Funnell WRJ. Low-frequency finite element modeling of the gerbil middle ear. JARO. 2006;7(4):399–411. doi: 10.1007/s10162-006-0055-6. [DOI] [PMC free article] [PubMed] [Google Scholar]
- Heffner RS, Heffner HE. Behavioral hearing range of the chinchilla. Hear Res. 1991;52(1):13–16. doi: 10.1016/0378-5955(91)90183-a. [DOI] [PubMed] [Google Scholar]
- Gan RZ, Feng B, Sun Q. Three-dimensional finite element modeling of human ear for sound transmission. Ann Biomed Eng. 2004;32(6):847–859. doi: 10.1023/b:abme.0000030260.22737.53. [DOI] [PubMed] [Google Scholar]
- Gan RZ, Sun Q, Feng B, Wood MK. Acoustic-structural coupled finite element analysis for sound transmission in human ear-pressure distributions. Med Eng Phys. 2006;28(5):395–404. doi: 10.1016/j.medengphy.2005.07.018. [DOI] [PubMed] [Google Scholar]
- Guan X, Chen Y, Gan RZ. Factors affecting loss of tympanic membrane mobility in acute otitis media model of chinchilla. Hear Res. 2014;309:136–146. doi: 10.1016/j.heares.2013.12.005. [DOI] [PMC free article] [PubMed] [Google Scholar]
- Guinan JJ, Jr, Peake WT. Middle-ear characteristics of anesthetized cats. J. Acoust. Soc. Am. 1967;41(5):1237–1261. doi: 10.1121/1.1910465. [DOI] [PubMed] [Google Scholar]
- Hanamure Y, Lim DJ. Anatomy of the chinchilla bulla and eustachian tube: I. Gross and microscopic study. Am J Otolaryngol. 1987;8(3):127–143. doi: 10.1016/s0196-0709(87)80035-2. [DOI] [PubMed] [Google Scholar]
- Horoshenkov KV, Sakagami K. A method to calculate the acoustic response of a thin, baffled, simply supported poroelastic plate. J Acoust Soc Am. 2001;110(2):904–917. [Google Scholar]
- Hsu GS, Margolis RH, Schachern PA. Development of the middle ear in neonatal chinchilla. I. Birth to 14 days. Acta Otolaryngol. 2000;120(8):922–932. doi: 10.1080/00016480050218645. [DOI] [PubMed] [Google Scholar]
- Koike T, Wada H, Kobayashi T. Dynamic frequency characteristic of the middle ear in guinea pig: The finite element analysis. Audiology Japan. 2002;45(4):289–297. [Google Scholar]
- Ladak HM, Funnel WRJ. Finite-element modeling of the normal and surgically repaired cat middle ear. J Acoust Soc Am. 1996;100(2):933–944. doi: 10.1121/1.416205. [DOI] [PubMed] [Google Scholar]
- Maftoon N, Funnell WRJ, Daniel SJ, Decraemer WF. Effect of opening middle-ear cavity on vibration of gerbil tympanic membrane. JARO. 2014;15(3):319–334. doi: 10.1007/s10162-014-0442-3. [DOI] [PMC free article] [PubMed] [Google Scholar]
- Masaki M, Wright CG, Lee DH, Meyerhoff WL. Experimental cholesteatoma: Epidermal ingrowth through tympanic membrane following middle ear application of propylene glycol. Acta Otolaryngol (stockh) 1989;108(1–2):113–121. doi: 10.3109/00016488909107401. [DOI] [PubMed] [Google Scholar]
- Mason MJ. Middle ear structures in fossorial mammals: a comparison with non-fossorial species. J Zool Lond. 2001;255(4):467–486. [Google Scholar]
- Nummela S. Scaling of the mammalian middle ear. Hear Res. 1995;85(1–2):18–30. doi: 10.1016/0378-5955(95)00030-8. [DOI] [PubMed] [Google Scholar]
- Puria S. A theory of cochlear input impedance and middle ear parameter estimation. City University of New York: Ph.D. Thesis; 1991. [Google Scholar]
- Rabbitt R. A hierarchy of examples illustrating the acoustic coupling of the eardrum. J. Acoust. Soc. Am. 1990;87(6):2566–2582. doi: 10.1121/1.399050. [DOI] [PubMed] [Google Scholar]
- Ravicz ME, Rosowski JJ. Middle-ear velocity transfer function, cochlear input impedance and middle-ear efficiency in chinchilla. J Acoust Soc Am. 2013;134(4):2852–2865. doi: 10.1121/1.4818745. [DOI] [PMC free article] [PubMed] [Google Scholar]
- Rosowski JJ, Huang GT, Atencio CA, Peake WT. Acoustic effects of multiple middle-ear air spaces: Measurements in cats. In: Wada H, Takasaka T, Ikeda K, Ohyama K, Koike T, editors. Recent Developments in Auditory Mechanics. Singapore: World Scientific; 2000. pp. 15–21. [Google Scholar]
- Rosowski JJ, Ravicz ME, Songer JE. Structures that contribute to middle-ear admittance in chinchilla. J Comp Physiol A. 2006;192(12):1287–1311. doi: 10.1007/s00359-006-0159-9. [DOI] [PMC free article] [PubMed] [Google Scholar]
- Ruggero MA, Rich NC, Robles L, Shivapuja BG. Middle-ear response in the chinchilla and its relationship to mechanics at the base of the cochlea. J Acoust Soc Am. 1990;87(4):1612–1629. doi: 10.1121/1.399409. [DOI] [PMC free article] [PubMed] [Google Scholar]
- Slama MC, Ravicz ME, Rosowski JJ. Middle ear function and cochlear input impedance in chinchilla. J Acoust Soc Am. 2010;127(3):1397–1410. doi: 10.1121/1.3279830. [DOI] [PMC free article] [PubMed] [Google Scholar]
- Songer JE, Rosowski JJ. Transmission matrix analysis of the chinchilla middle ear. J Acoust Soc Am. 2007;122(2):932–942. doi: 10.1121/1.2747157. [DOI] [PMC free article] [PubMed] [Google Scholar]
- Sun Q, Gan RZ, Chang HK, Dormer KL. Computer-integrated finite element modeling of human middle ear. Biomech. Model. Mechanobiol. 2002;1:109–122. doi: 10.1007/s10237-002-0014-z. [DOI] [PubMed] [Google Scholar]
- Takahashi D, Tanaka M. Flexural vibration of perforated plated and porous elastic materials under acoustic loading. J Acoust Soc Am. 2002;112(4):1456–1464. doi: 10.1121/1.1497624. [DOI] [PubMed] [Google Scholar]
- Teas DC, Nielsen DW. Interaural attenuation versus frequency for guinea pig and chinchilla CM response. J Acoust Soc Am. 1975;58(5):1066–1072. doi: 10.1121/1.380766. [DOI] [PubMed] [Google Scholar]
- Tuck-Lee JP, Pinsky PM, Steele CR, Puria S. Finite element modeling of acoustic mechanical coupling in the cat middle ear. J Acoust Soc Am. 2008;124(1):348–362. doi: 10.1121/1.2912438. [DOI] [PMC free article] [PubMed] [Google Scholar]
- Vrettakos PA, Dear SP, Saunders JC. Middle-ear structure in the chinchilla: A quantitative study. Am J Otolaryngol. 1988;9(2):58–67. doi: 10.1016/s0196-0709(88)80009-7. [DOI] [PubMed] [Google Scholar]
- Wang X, Wang L, Zhou J, Hu Y. Finite element modelling of human auditory periphery including a feed-forward amplification of the cochlea. Comput Method in Biomech Biomed Eng. 2014;17(10):1096–1107. doi: 10.1080/10255842.2012.737458. [DOI] [PubMed] [Google Scholar]
- Wang X, Nakmali D, Gan RZ. Complex modulus of round window membrane over auditory frequencies in normal and otitis media chinchilla ears. Int J Exp Comput Biomech. 2015;3(1):27–44. [Google Scholar]
- Yu X, Cheng L, Guyader JL. On the modeling of sound transmission through a mixed separation of flexible structure with an aperture. J Acoust Soc Am. 2014;135(5):2785–2796. doi: 10.1121/1.4870707. [DOI] [PubMed] [Google Scholar]
- Yokell Z, Wang X, Gan RZ. Dynamic Properties of Tympanic Membrane in a Chinchilla Otitis Media Model Measured with Acoustic Loading. ASME J Biomech Eng. 2015 doi: 10.1115/1.4030410. [DOI] [PMC free article] [PubMed] [Google Scholar]
- Zhang X, Gan RZ. Dynamic properties of human tympanic membrane based on frequency-temperature superposition. Ann Biomed Eng. 2013;41(1):205–214. doi: 10.1007/s10439-012-0624-2. [DOI] [PMC free article] [PubMed] [Google Scholar]
- Zhang X, Gan RZ. Dynamic properties of human stapedial annular ligament measured with frequency-temperature superposition. ASME J Biomech Eng. 2014;136(8) doi: 10.1115/1.4027668. [DOI] [PMC free article] [PubMed] [Google Scholar]


