

In 1978, Casscells et al1 published a small but important study showing that the majority of physicians, house officers, and students overestimated the positive predictive value (PPV) of a laboratory test result using prevalence and false positive rate. Today, interpretation of diagnostic tests is even more critical with the increasing use of medical technology in health care. Accordingly, we replicated the study by Casscells et al1 by asking a convenience sample of physicians, house officers, and students the same question: “If a test to detect a disease whose prevalence is 1/1000 has a false positive rate of 5%, what is the chance that a person found to have a positive result actually has the disease, assuming you know nothing about the person’s symptoms or signs?”
Methods
During July 2013, we surveyed a convenience sample of 24 attending physicians, 26 house officers, 10 medical students, and 1 retired physician at a Boston-area hospital, across a wide range of clinical specialties (Table). Assuming a perfectly sensitive test, we calculated that the correct answer is 1.96% and considered “2%,” “1.96%,” or “<2%” correct. 95% Confidence intervals were computed using the exact binomial and 2-sample proportion functions in R. The requirement for study approval was waived by the institutional review board of Department of Veterans Affairs Boston Healthcare System.
Table.
Survey Respondentsa
| No. of Respondents | ||
|---|---|---|
| Level of Training | Casscells et al1 | Present Study |
| Medical student | 20 | 10 |
| Intern | 20b | 12 |
| Resident | 8 | |
| Fellow | 6 | |
| Attending physician | 20 | 24 |
| Retired | 0 | 1 |
| Total | 60 | 61 |
This table gives the breakdown of the physicians and trainees surveyed in our study and the study of Casscells et al.1 The study by Casscells et al was performed at Harvard Medical School in 1978. Our study included Harvard and Boston University medical students along with residents and attending physicians affiliated with these 2 medical schools. Of the 30 fellows and attending physicians, the most represented specialties were internal medicine (n = 10), cardiology (n = 4), spinal cord injury (n = 2), pulmonology (n = 2), and psychiatry (n = 2), with 1 attending physician or fellow from each of 8 other specialties.
Casscells et al1 split their sample into students, house officers, and attending physicians. They did not break down the house officers category further.
Results
Approximately three-quarters of respondents answered the question incorrectly (95% CI, 65% to 87%). In our study, 14 of 61 respondents (23%) gave a correct response, not significantly different from the 11 of 60 correct responses (18%) in the Casscells study (difference, 5%; 95% CI, −11% to 21%). In both studies the most common answer was “95%,” given by 27 of 61 respondents (44%) in our study and 27 of 60 (45%) in the study by Casscells et al1 (Figure). We obtained a range of answers from “0.005%” to “96%,” with a median of 66%, which is 33 times larger than the true answer. In brief explanations of their answers, respondents often knew to compute PPV but accounted for prevalence incorrectly. For example, one attending cardiologist wrote that “PPV does not depend on prevalence,” and a resident wrote “better PPV when prevalence is low.”
Figure. Distribution of Responses to Survey Question Provided in the Article Text.
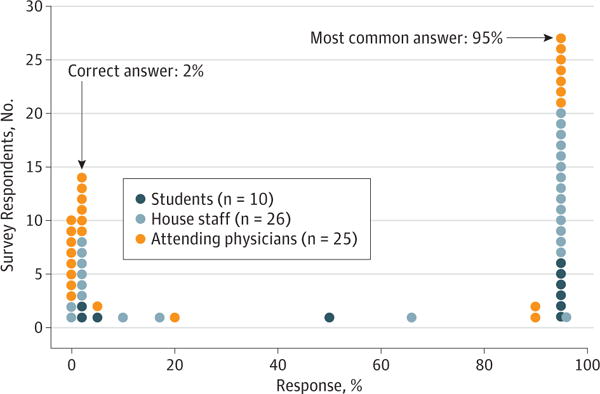
Of 61 respondents, 14 provided the correct answer of 2%. The most common answer was 95%, provided by 27 of 61 respondents. The median answer was 66%, which is 33 times larger than the true answer.
Discussion
With wider availability of medical technology and diagnostic testing, sound clinical management will increasingly depend on statistical skills. We measured a key facet of statistical reasoning in practicing physicians and trainees: the evaluation of PPV. Understanding PPV is particularly important when screening for unlikely conditions, where even nominally sensitive and specific tests can be diagnostically uninformative. Our results show that the majority of respondents in this single-hospital study could not assess PPV in the described scenario. Moreover, the most common error was a large overestimation of PPV, an error that could have considerable impact on the course of diagnosis and treatment.
We advocate increased training on evaluating diagnostics in general. Statistical reasoning was recognized to be an important clinical skill over 35 years ago,1–3 and notable initiatives like the Association of American Medical Colleges–Howard Hughes Medical Institute collaboration have developed recommendations to improve the next generation of medical education.4,5 Our results suggest that these efforts, while laudable, could benefit from increased focus on statistical inference. Specifically, we favor revising premedical education standards to incorporate training in statistics in favor of calculus, which is seldom used in clinical practice. In addition, the practical applicability of medical statistics should be demonstrated throughout the continuum of medical training—not just in medical school.
To make use of these skills, clinicians need access to accurate sensitivity and specificity measures for ordered tests. In addition, we support the use of software integrated into the electronic ordering system that can prevent common errors and point-of-care resources like smartphones that can aid in calculation and test interpretation. The increasing diversity of diagnostic options promises to empower physicians to improve care if medical education can deliver the statistical skills needed to accurately incorporate these options into clinical care.
Footnotes
Author Contributions: Messrs Manrai and Bhatia had full access to all of the data in the study and take responsibility for the integrity of the data and the accuracy of the data analysis. Messrs Manrai and Bhatia contributed equally.
Study concept and design: Manrai, Bhatia, Strymish, Jain.
Acquisition, analysis, or interpretation of data: Manrai, Bhatia, Kohane.
Drafting of the manuscript: Manrai, Bhatia.
Critical revision of the manuscript for important intellectual content: All authors.
Statistical analysis: Manrai, Bhatia.
Study supervision: Strymish, Jain.
Conflict of Interest Disclosures: None reported.
Additional Contributions: Paul R. Conlin, MD, VA Boston Healthcare System, helped in designing and executing the study.
References
- 1.Casscells W, Schoenberger A, Graboys TB. Interpretation by physicians of clinical laboratory results. N Engl J Med. 1978;299(18):999–1001. doi: 10.1056/NEJM197811022991808. [DOI] [PubMed] [Google Scholar]
- 2.Berwick DM, Fineberg HV, Weinstein MC. When doctors meet numbers. Am J Med. 1981;71(6):991–998. doi: 10.1016/0002-9343(81)90325-9. [DOI] [PubMed] [Google Scholar]
- 3.Elstein AS. Heuristics and biases: selected errors in clinical reasoning. Acad Med. 1999;74(7):791–794. doi: 10.1097/00001888-199907000-00012. [DOI] [PubMed] [Google Scholar]
- 4.Association of American Medical Colleges. MR5: 5th Comprehensive Review of the Medical College Admission Test® (MCAT®) https://www.aamc.org/initiatives/mr5/. Accessed October 9, 2013.
- 5.Association of American Medical Colleges, Howard Hughes Medical Institute. Scientific Foundations for Future Physicians. 2009 https://www.aamc.org/download/271072/data/scientificfoundationsforfuturephysicians.pdf. Accessed March 6, 2014.