

Abstract
Background & Aims
Serum levels of aminotransferases are used as markers of non-alcoholic fatty liver disease in epidemiology research. However, it is not clear whether they can be to identify patients with fatty liver. We investigated the accuracy of serum levels of aminotransferases in detection of hepatic steatosis. Additionally, we derived a Framingham steatosis index (FSI), and tested its ability to identify patients with hepatic steatosis in an independent cohort.
Methods
We performed a cross-sectional study of 1181 members of the Framingham Third Generation Cohort (46.1% women, mean age 50.3±6.7 years). People with hepatic steatosis were identified by computed tomography, performed from 2008 through 2011. We compared the abilities of levels of alanine aminotransferase (ALT) and aspartate aminotransferase (AST), and the ratio of ALT:AST, to identify people with hepatic steatosis using c-statistic analyses. We performed a stepwise regression procedure to identify demographic and clinical factors that correlated with hepatic steatosis; we used these, along with biochemical factors associated with steatosis, to develop the FSI. We validated the FSI using data from the third National Health and Nutrition Examination Survey (NHANES III).
Results
The prevalence of hepatic steatosis in the Framingham Third Generation Cohort was 26.8%. The ratio of ALT:AST identified people with hepatic steatosis with the highest c-statistic value (0.728); the value for only ALT was 0.706 and the value for only AST was 0.589. We derived the FSI based on patient age, sex, body mass index, levels of triglycerides, hypertension, diabetes, and ratio of ALT:AST. The FSI identified patients with hepatic steatosis with a c-statistic value of 0.845. When it was applied to the NHANES III cohort, the FSI identified patients with steatosis with a c-statistic value of 0.760 and was well calibrated.
Conclusions
In an analysis of the Framingham Third Generation Cohort, we found the ratio of ALT:AST to identify people with hepatic steatosis more accurately than either ALT or AST alone. We used data from this cohort to develop and validate the FSI, which identifies patients with steatosis with a c-statistic value of about 0.8.
Keywords: NAFLD, diagnostic score, liver fat, diagnostic
Introduction
With the increasing prevalence of obesity, non-alcoholic fatty liver disease (NAFLD) has become the most common chronic liver disease in the United States, with a general population burden ranging from 10-35%.1, 2 The definition of NAFLD requires evidence of hepatic steatosis on liver biopsy or imaging; however, both of these methods are costly, burdensome, and impractical to implement on a large scale.3
In many cases, NAFLD causes asymptomatic elevations in alanine aminotransferase (ALT), aspartate aminotransferase (AST), and γ-glutamyltransferase (GGT); with ALT being most closely related to liver fat accumulation.4, 5 The appropriate aminotransferase level to detect NAFLD is not known, as patients with ALT within the normal range can also have NAFLD.6, 7 ALT elevation also does not correlate with worsening liver histology 6 and no ALT cut off level to accurately detect steatohepatitis or fibrosis has been identified. Additionally, in a prior study, the ALT/AST ratio, rather than ALT or AST alone, has been correlated with the degree of liver fat on liver biopsy.8 Historically, ALT has been used as a surrogate marker for NAFLD in epidemiologic studies.9 Studies assessing the sensitivity and specificity of ALT, AST, or the ALT/AST ratio as a marker of NAFLD are limited.10-12 Additionally, the available diagnostic scores for NAFLD based on clinical and laboratory parameters have limited utility as they contain parameters that are not readily available and have limited calibration when applied to external cohorts.13
Thus, the purpose of the present study was to determine the cross-sectional association between ALT, AST, and the ALT/AST ratio and hepatic steatosis in a large community based sample. Additionally, we derived a simple diagnostic model for hepatic steatosis based on readily available demographic, anthropometric, and laboratory data which can be used for diagnosis of hepatic steatosis in population based studies. Finally, we applied our diagnostic model to another large study for external validation.
Participants and Methods
Study sample
We evaluated participants in the Framingham Heart Study (FHS) Third Generation Cohort. Between September 2008 and December 2011, Third Generation Cohort participants were enrolled in the Multi-detector Computed Tomography (CT) 2 sub-study when chest and abdominal CT scans were performed. For the present investigation, our sample was derived from a total of 1,429 women and men who participated in the Multi-detector CT sub-study and attended the second examination cycle (May 2008 to March 2011) when aminotransferase levels were measured. Individuals were excluded from analysis if the CT scan was not interpretable for liver attenuation (n=13), they had missing covariate information (n=23), they had heavy alcohol intake, defined as >7 drinks per week for women and >14 drinks per week for men (n=204), or if information regarding alcohol use was missing (n=5), or if aminotransferase levels were >3 times the upper limit of normal (n=3) yielding a total sample size of 1,181 participants. The institutional review boards of the Boston University Medical Center and Massachusetts General Hospital approved the study protocol. All participants provided written informed consent.
Multi-detector CT scan protocol and measurement of liver attenuation
The Multi-detector CT scan protocol has been described in detail previously and additional information is available in the online supplement.14 To measure the liver attenuation, three areas from the liver and one from an external phantom were measured and averaged to create liver phantom ratios (LPR) as has been described previously.15 We defined hepatic steatosis as a LPR of ≤ 0.33, based on our prior work.1
Please see online supplement for methods regarding baseline covariates.
Statistical analysis
Descriptive statistics were used to characterize the analysis population and those with and without hepatic steatosis. Comparisons of characteristics among those with and without hepatic steatosis were performed using the Wilcoxon rank sum test (continuous traits) or chi square tests (categorical traits). We determined the prevalence of elevated ALT (defined as > 31 U/L for women and > 40 U/L for men) and elevated AST (defined as > 31 U/L for women and >37 U/L for men) using standard laboratory definitions for the upper limits of normal as has been done in prior studies.4 We plotted receiver operating characteristic curves (ROC) and calculated the c-statistics from models of each laboratory parameter (ALT, AST, or ALT/AST ratio) predicting hepatic steatosis (based on a LPR ≤ 0.33) to determine which parameter was most predictive of hepatic steatosis. To derive the Framingham Steatosis Index (FSI), we performed a stepwise logistic regression procedure to determine the combination of demographic and clinical parameters most associated with hepatic steatosis. A significance level of 0.10 was used for model entry and a significance level of 0.05 was used for retention. Age and sex were forced into the model. Candidate variables for the selection model included smoking status, BMI, waist circumference, diabetes, hypertension, total cholesterol, triglycerides, HDL cholesterol, or low-density lipoprotein (LDL) cholesterol. The continuous liver laboratory variable (from ALT, AST and ALT/AST ratio) determined to be most predictive (highest c-statistic) of hepatic steatosis was subsequently added to the FSI model to assess the impact on the model's discriminatory ability of adding this parameter. Before adding the lab variable to the model, we empirically determined the cutoff value of the liver lab that univariately yielded a good combination of sensitivity and specificity; the dichotomized value of the lab variable was then entered into the FSI model. We used the DeLong test16 to measure differences in the c-statistics. We calculated the integrated discrimination index (IDI) to determine the relative improvement in the discrimination slope after adding the laboratory variable to the model.17 We also calculated the net reclassification index (NRI) to assess the incremental ability to reclassify participants based on the new model compared to the base model.17, 18 To evaluated calibration, we used calibration plots to allow for visual assessment which can be more informative than formal tests.13 All analyses in FHS participants were conducted using SAS 9.3 (SAS Institute Inc., Cary, NC).
External validation in the third National Health and Nutrition Examination Survey
For validation of the FSI, we utilized a subset of participants in the third National Health and Nutrition Examination Survey (NHANES III) (1988-1994) who underwent ultrasound of the gallbladder at a mobile examination center.19 Video images from the ultrasounds were reviewed for hepatic steatosis as has been previously described.20 All participants provided written informed consent and the institutional review board of the National Center for Health Statistics approved of the protocol. A total of 14,797 NHANES III participants completed an ultrasound of the gallbladder. By design, only a subset of participants were asked to attend a morning examination and provide a fasting blood sample (n=6,374). We excluded participants if their video images could not be evaluated for hepatic steatosis (n=683), participants with excessive alcohol use (> 7 drinks/week for women and > 14 drinks/week for men) (n=503), evidence of viral hepatitis (HBsAg or Anti-HCV positive) (n=333), pregnant women (n=95), evidence of iron overload (transferrin saturation ≥ 50%) (n=217), or missing covariates (n=54) for a final sample of 4,489 adults with complete data.
See online supplement for additional methods regarding hepatic steatosis and covariate definitions in the NHANES III participants.
Statistical methods for validation cohort
The performance of the FSI was assessed in NHANES III participants by using discrimination and calibration metrics for the overall population and among non-Hispanic Whites to be consistent with the demographics of the FHS. We derived a calibration plot to enable visual assessment of model calibration.13 To construct the calibration plot, NHANES III participants were divided into deciles of predicted risk based on the FSI. For each decile of predicted risk, the corresponding observed risk was calculated among NHANES III participants. We used Taylor series methods (linearization) to calculate the 95% confidence intervals for observed risks. Finally, we performed a best-fit logistic regression model for hepatic steatosis among NHANES III participants in the overall sample and, separately, in the sample of non-Hispanic Whites using the same set of covariates included in the FSI. All analyses in NHANES III participants were conducted using SAS 9.3 (SAS Institute Inc., Cary, NC), weighted to represent the US population, and accounting for the complex sampling design of this study.
Results
Study sample characteristics
The characteristics of the study sample (n=1,181) are summarized in Table 1. The sample included 544 women (46.1%) and the mean age was 50.3 ± 6.7 years. Overall, 26.8% of the sample had a LPR ≤ 0.33 consistent with hepatic steatosis.
Table 1. Clinical characteristics of the Framingham Heart Study (FHS) Cohort and the validation sample from the third National Health and Nutrition Survey (NHANES III).
| Clinical Characteristics* | FHS | NHANES III | |
|---|---|---|---|
| Overall | Non-Hispanic Whites | ||
| n | 1,181 | 4,489 | 1,714 |
| Age (years) | 50.0 (0.19) | 42.9 (0.46) | 43.9 (0.53) |
| Women, % | 46.1% | 53.8% | 53.3% |
| Race, % | |||
| non-Hispanic White | 97.7% | 76.0% | 100.0% |
| non-Hispanic Black | 0.2% | 10.5% | 0.0% |
| Mexican American | NA | 5.4% | 0.0% |
| Other/Did not answer | 0.2% | 8.1% | 0.0% |
| Current smoking, % | 7.8% | 26.5% | 26.6% |
| BMI (kg/m2) | 28.7 (0.17) | 26.5 (0.16) | 26.4 (0.19) |
| Waist circumference (cm) | 99.3 (0.43) | 91.4 (0.39) | 91.4 (0.44) |
| Drinks per week | 3.2 (0.12) | 2.2 (0.10) | 2.2 (0.12) |
| HTN, % | 25.7% | 19.9% | 19.7% |
| Diabetes, % | 5.1% | 4.7% | 4.4% |
| Metabolic Syndrome, % | 29.8% | 23.2% | 23.9% |
| Total Cholesterol (mg/dl) | 188 (0.93) | 203 (1.00) | 204 (1.17) |
| Estimated LDL Cholesterol (mg/dl) | 108 (0.87) | 128 (0.95) | 129 (1.18) |
| HDL Cholesterol (mg/dl) | 58 (0.49) | 49 (0.39) | 49 (0.46) |
| Triglycerides (mg/dl) | 113 (1.75) | 134 (2.63) | 137 (3.12) |
| ALT (U/L) | 22 (17-31)** | 14 (8-20)** | 13 (10-19)** |
| AST (U/L) | 20 (17-24)** | 18 (15-22)** | 18 (15-21)** |
| Liver Phantom Ratio (LPR) | 0.34 (0.003) | NA | NA |
| Hepatic steatosis (LPR ≤ 0.33), % | 26.8% | NA | NA |
| Hepatic steatosis (ultrasound defined)***, % | NA | 19.2% | 19.4% |
BMI, body mass index; HTN, hypertension; LDL, low-density lipoprotein; HDL, high-density lipoprotein; AST, aspartate aminotransferase; ALT, alanine aminotransferase.
Clinical characteristics are represented as mean (standard error) for the FHS sample and for the NHANES III sample unless noted
Values represent the median (interquartile range)
Includes moderate and severe hepatic steatosis.
Aminotransferase levels and hepatic steatosis
Participants with hepatic steatosis had a higher median ALT (30.5 U/L, interquartile range 21-42.5 U/L) compared to those without hepatic steatosis (median ALT 21 U/L, interquartile range 16-28 U/L) (p< 0.001). The median AST was also slightly higher among those with hepatic steatosis (median AST 22 U/L, interquartile range 18-27 U/L) compared to those without hepatic steatosis (median AST 20 U/L, interquartile range 17-24 U/L) (p< 0.001). The prevalence of elevated ALT was 34.8% for participants with hepatic steatosis and 8.4% for participants without hepatic steatosis (Figure 1) (p< 0.001).
Figure 1.
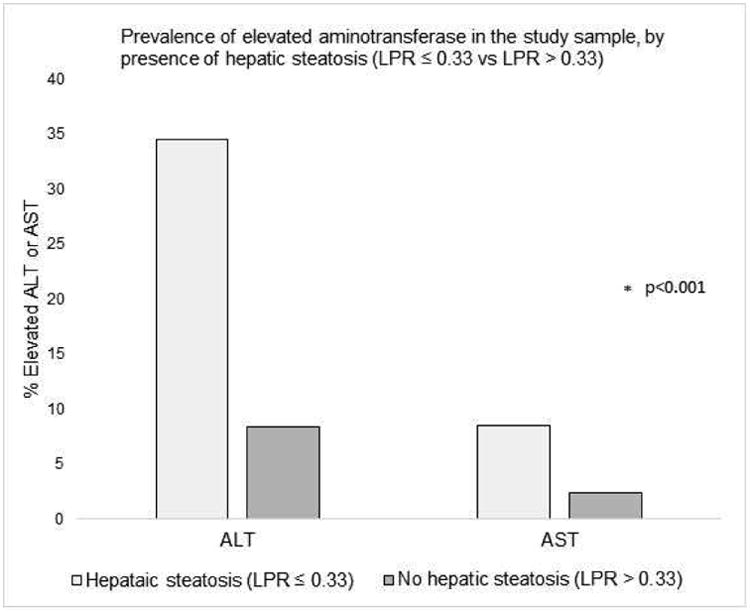
Prevalence of elevated aminotransferase in the FHS sample, by presence of hepatic steatosis (LPR ≤ 0.33 vs LPR > 0.33). ALT was considered elevated if >31 U/L for women or > 40 U/L for men and AST was considered elevated if > 31 U/L for women or >37 U/L for men.4
LPR, liver phantom ratio; ALT, alanine aminotransferase; AST, aspartate aminotransferase.
Models predicting hepatic steatosis from aminotransferase levels or ALT/AST ratio
The model which predicted hepatic steatosis (LPR ≤ 0.33) from the ALT/AST ratio alone (no covariates) had the highest c-statistic (0.728) as compared with models including ALT alone (c-statistic = 0.706) or AST alone (c-statistic = 0.589). The ROC curve for the model predicting hepatic steatosis from the ALT/AST ratio alone is shown in Figure 2. A cut-off of 1.33 for the ALT/AST ratio had a sensitivity of 55% and a specificity of 80% for detecting hepatic steatosis in our sample. The sensitivity, specificity, positive predictive value and negative predictive value at various ALT/AST ratio cut points are shown in Table 2.
Figure 2.
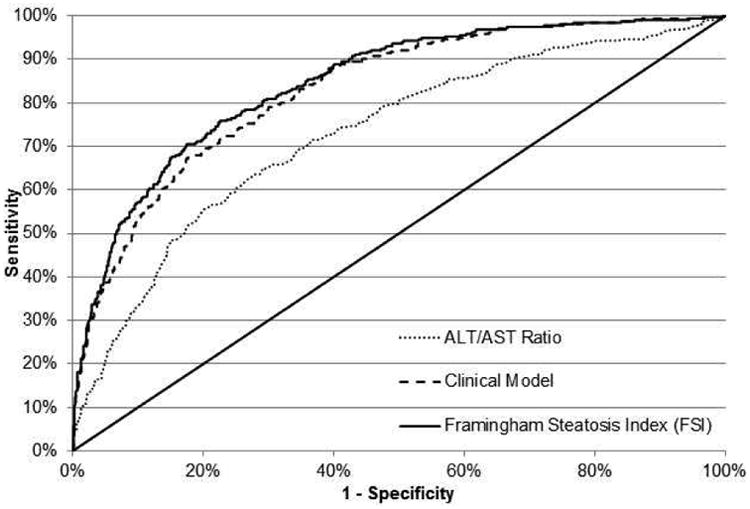
(a) Receiver-operating characteristic (ROC) curves for models predicting hepatic steatosis in the FHS (derivation cohort) from the ALT/AST ratio alone (dot), the Clinical Model (dash) and the Framingham Steatosis Index (solid). For the ALT/AST ratio (dot), the area under the ROC curve was 0.728. At a cut off value of 1.33, sensitivity and specificity were 55% and 80% respectively. The Clinical Model (dash) had an area under the ROC curve of 0.830. The FSI (solid) had an area under the ROC curve of 0.845.
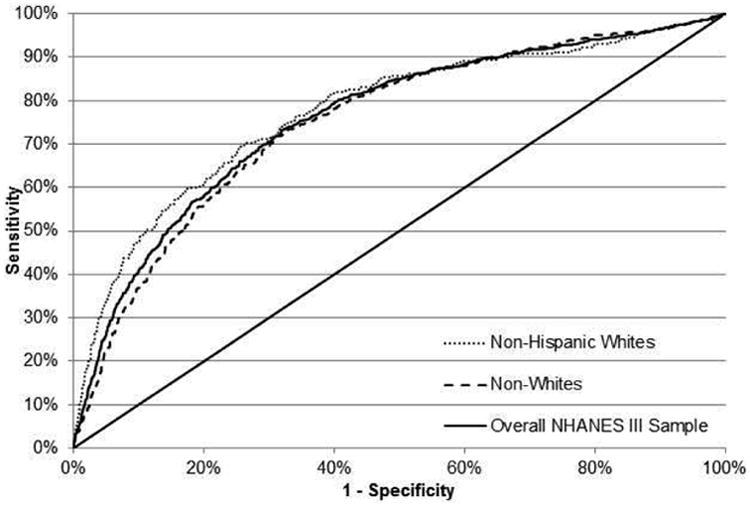
(b) ROC curve for the FSI for the detection of hepatic steatosis in the NHANES III cohort (validation cohort) in the overall NHANES III sample (solid), among non-Hispanic White NHANES III participants (dot) and among non-White NHANES III participants (dash).
Table 2. Diagnostic accuracy of ALT/AST ratio alone at various ALT/AST ratio cut-points compared to the presence of hepatic steatosis on computed tomography scan in the Framingham Heart Study.
| ALT/AST ratio cut-points | Prevalence steatosis (%)* | Sensitivity (%) | Specificity (%) | PPV (%) | NPV (%) |
|---|---|---|---|---|---|
| 0.9 | 74 | 90 | 33 | 33 | 90 |
| 1.05 | 56 | 80 | 51 | 37 | 87 |
| 1.18 | 44 | 70 | 65 | 42 | 85 |
| 1.22 | 39 | 66 | 70 | 44 | 85 |
| 1.33 | 29 | 55 | 80 | 50 | 83 |
| 1.5 | 17 | 34 | 91 | 54 | 79 |
ALT, alanine aminotransferase; AST, aspartate aminotransferase; PPV, positive predictive value; NPV, negative predictive value
Prevalence of hepatic steatosis in the Framingham Heart Study sample based on ALT/AST ratio cut-point.
Derivation of a simple clinical model for predicting hepatic steatosis
Results of the multivariable stepwise regression model for predicting hepatic steatosis (LPR ≤ 0.33) are shown in Table 3. After age and sex were forced in, BMI, triglycerides, hypertension (yes or no), and diabetes (yes or no) entered the model. Overall, the model's c-statistic was 0.830. When an indicator for the ALT/AST ratio greater than or equal to the 1.33 cut point was added to the model, the overall c-statistic improved to 0.845 (Figure 2) (p < 0.001, difference in c-statistics 0.015, 95% CI of difference (0.005, 0.025)). The IDI was 0.03 (p<0.001), with the relative IDI showing a 12% improvement in the discrimination slope when the ALT/AST ratio was added to the model. The addition of the ALT/AST ratio to the model resulted in the reclassification of 68.8% of the sample (p<0.0001, NRI 95% CI 56.6%, 81.1%) with 10% of “events” correctly reclassified to higher risk (p=0.06) and 58% of “non-events” correctly reclassified to lower risk (p<0.0001). The addition of AST or ALT to the model (in lieu of the ALT/AST ratio) resulted in the reclassification of 17% and 45% of the sample, respectively (AST NRI p=0.01, 95% CI 4.5%, 29.8%; ALT NRI p<0.0001, 95% CI 32.5%, 57.6%). In the final model, after adjusting for the clinical variables, the odds of hepatic steatosis was 3.0 times higher (95% CI 2.15, 4.0) among those with an elevated ALT/AST ratio (≥ 1.33). The equation for the Framingham Steatosis Index (FSI) is as follows:
Table 3. Models predicting hepatic steatosis (LPR ≤ 0.33) in the Framingham Heart Study Cohort.
| Models | Covariate | Odds Ratio (95% CI) | P- Value | C-statistic** |
|---|---|---|---|---|
| Clinical model* | Age (per 1 year increase) | 1.00 (0.98, 1.03) | 0.68 | 0.830 |
| Sex (Women vs. Men) | 0.65 (0.47, 0.91) | 0.01 | ||
| BMI (per 1 kg/m2 increase) | 1.20 (1.16, 1.24) | <0.0001 | ||
| Triglycerides (per 1 mg/dl increase) | 1.01 (1.00, 1.01) | <0.0001 | ||
| Hypertension (yes vs. no) | 1.94 (1.38, 2.72) | 0.0001 | ||
| Diabetes (yes vs. no) | 2.56 (1.31, 5.00) | 0.006 | ||
| Framingham Steatosis Index* | Age (per 1 year increase) | 1.01 (0.99, 1.04) | 0.36 | 0.845 |
| Sex (Women vs. Men) | 0.86 (0.61, 1.23) | 0.42 | ||
| BMI (per 1 kg/m2 increase) | 1.19 (1.15, 1.23) | <0.0001 | ||
| Triglycerides (per 1 mg/dl increase) | 1.01 (1.00, 1.01) | <0.0001 | ||
| Hypertension (yes vs. no) | 1.81 (1.28, 2.57) | 0.0009 | ||
| Diabetes (yes vs. no) | 2.20 (1.12, 4.33) | 0.02 | ||
| ALT/AST Ratio (> 1.33 vs ≤ 1.33) | 3.00 (2.15, 4.20) | <0.0001 |
BMI, body mass index; ALT, alanine aminotransferase; AST, aspartate aminotransferase
Multivariable stepwise regression models. Age and sex were forced into the model. Candidate variables for the selection model included smoking status, BMI, waist circumference, diabetes, hypertension, total cholesterol, triglycerides, HDL cholesterol, or low-density lipoprotein (LDL) cholesterol. The ALT/AST ratio was added to the clinical model to derive the Framingham Steatosis Index.
Difference in c-statistic between the clinical model and the FSI=0.015, 95% CI of difference (0.005, 0.025), p<0.001
NHANES III cohort characteristics
The characteristics of the NHANES III cohort sample are presented in Table 1.
Validation of FSI in NHANES III cohort
The ROC for the FSI in NHANES III, stratified by race, is presented in Figure 2b. The c-statistic among non-Hispanic White NHANES III participants was 0.775 (n=1,714) and 0.760 in the overall NHANES III sample (n=4,489). The calibration plot was consistent with good model fit (Supplemental Figure 1). On visual inspection, the calibration plot for the FSI shows better model calibration compared to the clinical model (Supplemental Figure 2). The performance of the FSI at various cut-points in the FHS Cohort and NHANES III cohort sample are presented in Table 4. At a cut point of 23, the FSI has a sensitivity of 79%, a specificity of 71%, a PPV of 50%, and a NPV of 90% for hepatic steatosis in the FHS cohort. Results were similar in the NHANES III cohort sample at this cut-point, but with a lower sensitivity and PPV and higher specificity for hepatic steatosis.
Table 4. Performance of the Framingham Steatosis Index using cut-points of predicted risk.
| FSI cut-points | Sensitivity (%) | Specificity (%) | PPV (%) | NPV (%) |
|---|---|---|---|---|
| FHS Cohort | ||||
| ≥9 vs <9 | 95 | 44 | 38 | 96 |
| ≥14 vs <14 | 90 | 58 | 44 | 94 |
| ≥20 vs < 20 | 83 | 67 | 48 | 91 |
| ≥23 vs < 23 | 79 | 71 | 50 | 90 |
| ≥26 vs < 26 | 77 | 75 | 53 | 90 |
| ≥28 vs < 28 | 75 | 78 | 55 | 89 |
| ≥32 vs <32 | 70 | 83 | 60 | 88 |
| NHANES III | ||||
| ≥9 vs <9 | 84 | 52 | 30 | 93 |
| ≥14 vs <14 | 76 | 66 | 35 | 92 |
| ≥20 vs < 20 | 66 | 76 | 40 | 90 |
| ≥23 vs < 23 | 62 | 80 | 42 | 90 |
| ≥26 vs < 26 | 58 | 81 | 43 | 89 |
| ≥28 vs < 28 | 55 | 84 | 45 | 89 |
| ≥32 vs <32 | 51 | 87 | 48 | 88 |
FSI, Framingham steatosis index; PPV, positive predictive value; NPV, negative predictive value; NHANES, National Health and Nutrition Survey
Discussion
Principle findings
In this large, cross-sectional study of community-based FHS participants who underwent abdominal CT scans, the ALT/AST ratio was more predictive of hepatic steatosis compared to either ALT or AST alone. We derived the FSI which is a simple clinical model including BMI, triglycerides, hypertension, diabetes, and the ALT/AST ratio for prediction of hepatic steatosis. This diagnostic score demonstrated good discrimination and the model performed well with respect to discrimination and calibration when applied to an external population of NHANES III participants. Finally, although derived from a nearly exclusively white population, the FSI performed well in the overall, multi-ethnic NHANES III cohort which is more representative of the general US population.
In the context of the current literature
In the FHS, we determined that the ALT/AST ratio was more predictive of liver fat on CT scan compared to either ALT or AST alone. Previously, the ALT/AST ratio was shown to correlate with the degree of fatty infiltration on liver biopsy in a population of morbidly obese adults.8 More recently, the ALT/AST ratio has been shown to be a better surrogate marker than ALT for predicting insulin resistance in a Japanese cohort.21 In prior epidemiologic studies, elevation in ALT has most frequently been utilized as a surrogate marker for NAFLD.7, 22 It is well established that NAFLD may be present in those with aminotransferase levels within the normal range.6, 12 This finding was confirmed in our sample where we found that the majority of participants with significant liver fat accumulation on CT scan did not have elevated ALT or AST. The ALT/AST ratio may be a better surrogate marker for hepatic steatosis than either AST or ALT alone, especially when the aminotransferase values are within the normal range. When liver biopsy or liver specific imaging is not available in large population-based cohorts, we suggest that the ALT/AST ratio may be a more useful surrogate marker for hepatic steatosis compared to ALT alone. We determined that an ALT/AST ratio of >1.33 has a specificity of 80% and a sensitivity of 55% for detecting hepatic steatosis.
Hepatic imaging with either CT or ultrasonography have been utilized to assess hepatic steatosis with reasonable accuracy.23, 24 However, imaging is expensive and not feasible on the population level, so a simple noninvasive index to help diagnosis hepatic steatosis is needed. A number of models already exist and include the Fatty Liver Index (FLI)25, the Fatty Liver Disease (FLD) Index26 and the Hepatic Steatosis Index (HSI)27, derived from case-control datasets, and the index of Non-Alcoholic Steatohepatitis (NASH) (ION)28 which was derived from a community-based sample. The FLI includes waist circumference and gamma-glutamyl transferase, both of which are often not readily available in population cohorts or clinical samples. The FLD index was derived in a large Chinese case-control dataset and has not been externally validated. The HSI was derived in a large Korean case-control data set and includes the ALT/AST ratio, BMI, gender, and diabetes; however, this model was recently shown to perform worse than the FLI and may not be generalizable to a white population.13 Additionally, because the FLI, FLD, and HSI were derived from case-control data sets which tend to overestimate the relationship between risk factors and disease, they have been shown to overestimate the risk of hepatic steatosis in the general population.13 The recently described ION has a different equation for women and men and includes the waist-to-hip ratio and homeostasis model assessment (HOMA), both of which may not be readily available. In our study, we derived the FSI which includes simple clinical information that is likely to be easily accessible in clinical practice or population-based cohorts. Additionally, we externally validated the FSI in the multi-ethnic NHANES III cohort and demonstrated good discrimination, reclassification, and calibration.
Implications
There are several potential implications of this work. First, in large epidemiologic studies where liver imaging or liver biopsy is not available, the FSI may be a useful surrogate diagnostic index for hepatic steatosis. Since the individual components of the FSI are usually readily available, this model significantly improves over currently available diagnostic scores. Future studies are needed to assess if the FSI can be used longitudinally to evaluate the incidence of hepatic steatosis in high risk individuals. In the clinical setting, the FSI may be useful to help identify NAFLD patients or identify patients at high risk for steatosis who may benefit from abdominal imaging. Studies evaluating the utility and cost-effectiveness of the FSI in the clinical setting are needed before its use can be recommended. Finally, our data suggest that the ALT/AST ratio cut off of 1.33 has reasonable accuracy at predicting hepatic steatosis. In population-based studies when detailed participant-level information is often lacking, the ALT/AST ratio may be considered a useful surrogate for hepatic steatosis with a moderate improvement in the c-statistic for detecting steatosis compared to ALT or AST alone.
Strengths and limitations
The main strength of our study includes the use of a large, unselected sample with standardized demographic, anthropometric, and laboratory measures. Additionally, when deriving the model for predicting hepatic steatosis, we limited the candidate variables to simple clinical and laboratory measures that are readily available to improve the clinical utility of our index. Additionally, we have applied the FSI to a multi-ethnic external validation cohort and demonstrated good discrimination and calibration of the model for the identification of moderate to severe hepatic steatosis. A number of important limitations deserve mention. First of all, this is a cross-sectional, observational study with only single values of aminotransferase levels available per participant. Secondly, we utilized CT scans for the diagnosis of hepatic steatosis, which has a high specificity but is relatively insensitive to mild steatosis.29 This may have led to under-diagnosis of hepatic steatosis in our population, particularly among those with mild steatosis. The usefulness of FSI as a diagnostic index for patients with mild hepatic steatosis is not known. Our evaluation of aminotransferase levels and the derivation of the FSI is not based on liver biopsy, which is considered the gold standard. However, liver biopsy in an unselected community sample is not clinically indicated and the use of hepatic imaging is considered an acceptable surrogate.3 CT imaging does not reliably detect steatohepatitis or fibrosis so the ability of the FSI to diagnosis patients with NASH or hepatic fibrosis is not known. Finally, we lack information about viral hepatitis status in the FHS cohort which can cause the appearance of liver fat on CT scan and may have been a source of misclassification. The seropositivity of hepatitis C is low in the general population (1-2%) so the possibility of confounding because of chronic hepatitis C in our population is low.30 Despite these limitations, when applied to a multi-ethnic external validation cohort which utilized ultrasound for the diagnosis of hepatic steatosis, our model continued to demonstrated excellent discrimination and calibration.
Conclusion
The FSI is a diagnostic model that includes age, sex, BMI, triglycerides, hypertension, diabetes, and the ALT/AST ratio which was found to be highly predictive of hepatic steatosis in the FHS and in NHANES III. When using serum aminotransferases to diagnosis hepatic steatosis, the ALT/AST ratio predicted hepatic steatosis better than either ALT or AST alone. The FSI may be a useful surrogate for the diagnosis of hepatic steatosis in epidemiologic studies. Future studies are needed to determine the accuracy and cost effectiveness of the FSI as a diagnostic index for hepatic steatosis in clinical practice.
Acknowledgments
Grant Support: This work was supported by the Boston University School of Medicine and the National Heart, Lung, and Blood Institute's Framingham Heart Study (contract N01-HC-25195 and HHSN268201500001I), and the Division of Intramural Research of the National Heart, Lung, and Blood Institute.
Abbreviations
- ALT
alanine aminotransferase
- AST
aspartate aminotransferase
- BMI
body mass index
- CT
computed tomography
- DBP
diastolic blood pressure
- HDL
high-density lipoprotein
- HOMA
homeostasis model assessment
- HSI
Hepatic Steatosis Index
- HU
Hounsfield units
- ION
index of Non-Alcoholic Steatohepatitis
- FHS
Framingham Heart Study
- FLI
Fatty Liver Index
- FSI
Framingham Steatosis Index
- LDL
low-density lipoprotein
- LPR
liver phantom ratio
- NAFLD
Non-Alcoholic Fatty Liver Disease
- NASH
Non-Alcoholic Steatohepatitis
- NHANES
National Health and Nutrition Examination Survey
- ROC
receiver operator characteristic
- SBP
systolic blood pressure
Footnotes
Disclosures: Alison Pedley is an employee of Merck. The other authors have no conflicts to report.
Writing Assistance – None
Specific Author Contributions: Study concept and design (MTL, CSF); acquisition of data (CSF,JMM, LDC, PM); Analysis and interpretation of data (MTL, AP, LDC, JMM, UH, PM, CSF); drafting of the manuscript (MTL); critical revision of the manuscript for important intellectual content (CSF); statistical analysis (AP, LDC, JMM, PM); administrative, technical, or material support (UH); study supervision (CSF). All authors approved of the final draft prior to submission.
Publisher's Disclaimer: This is a PDF file of an unedited manuscript that has been accepted for publication. As a service to our customers we are providing this early version of the manuscript. The manuscript will undergo copyediting, typesetting, and review of the resulting proof before it is published in its final citable form. Please note that during the production process errors may be discovered which could affect the content, and all legal disclaimers that apply to the journal pertain.
References
- 1.Speliotes EK, Massaro JM, Hoffmann U, et al. Fatty liver is associated with dyslipidemia and dysglycemia independent of visceral fat: the Framingham Heart Study. Hepatology. 2010;51(6):1979–87. doi: 10.1002/hep.23593. [DOI] [PMC free article] [PubMed] [Google Scholar]
- 2.Vernon G, Baranova A, Younossi ZM. Systematic review: the epidemiology and natural history of non-alcoholic fatty liver disease and non-alcoholic steatohepatitis in adults. Alimentary pharmacology & therapeutics. 2011;34(3):274–85. doi: 10.1111/j.1365-2036.2011.04724.x. [DOI] [PubMed] [Google Scholar]
- 3.Chalasani N, Younossi Z, Lavine JE, et al. The diagnosis and management of non-alcoholic fatty liver disease: practice Guideline by the American Association for the Study of Liver Diseases, American College of Gastroenterology, and the American Gastroenterological Association. Hepatology. 2012;55(6):2005–23. doi: 10.1002/hep.25762. [DOI] [PubMed] [Google Scholar]
- 4.Clark J. The prevalence and etiology of elevated aminotransferase levels in the United States. The American Journal of Gastroenterology. 2003;98(5):960–7. doi: 10.1111/j.1572-0241.2003.07486.x. [DOI] [PubMed] [Google Scholar]
- 5.Westerbacka J, Corner A, Tiikkainen M, et al. Women and men have similar amounts of liver and intra-abdominal fat, despite more subcutaneous fat in women: implications for sex differences in markers of cardiovascular risk. Diabetologia. 2004;47(8):1360–9. doi: 10.1007/s00125-004-1460-1. [DOI] [PubMed] [Google Scholar]
- 6.Mofrad P, Contos MJ, Haque M, et al. Clinical and histologic spectrum of nonalcoholic fatty liver disease associated with normal ALT values. Hepatology. 2003;37(6):1286–92. doi: 10.1053/jhep.2003.50229. [DOI] [PubMed] [Google Scholar]
- 7.Oh SY, Cho YK, Kang MS, et al. The association between increased alanine aminotransferase activity and metabolic factors in nonalcoholic fatty liver disease. Metabolism: clinical and experimental. 2006;55(12):1604–9. doi: 10.1016/j.metabol.2006.07.021. [DOI] [PubMed] [Google Scholar]
- 8.Nanji AA, French SW, Freeman JB. Serum alanine aminotransferase to aspartate aminotransferase ratio and degree of fatty liver in morbidly obese patients. Enzyme. 1986;36(4):266–9. doi: 10.1159/000469304. [DOI] [PubMed] [Google Scholar]
- 9.Schindhelm RK, Diamant M, Dekker JM, et al. Alanine aminotransferase as a marker of non-alcoholic fatty liver disease in relation to type 2 diabetes mellitus and cardiovascular disease. Diabetes/metabolism research and reviews. 2006;22(6):437–43. doi: 10.1002/dmrr.666. [DOI] [PubMed] [Google Scholar]
- 10.Nomura K, Yano E, Shinozaki T, et al. Efficacy and effectiveness of liver screening program to detect fatty liver in the periodic health check-ups. Journal of occupational health. 2004;46(6):423–8. doi: 10.1539/joh.46.423. [DOI] [PubMed] [Google Scholar]
- 11.Kunde SS, Lazenby AJ, Clements RH, et al. Spectrum of NAFLD and diagnostic implications of the proposed new normal range for serum ALT in obese women. Hepatology. 2005;42(3):650–6. doi: 10.1002/hep.20818. [DOI] [PubMed] [Google Scholar]
- 12.Oh HJ, Kim TH, Sohn YW, et al. Association of serum alanine aminotransferase and gamma-glutamyltransferase levels within the reference range with metabolic syndrome and nonalcoholic fatty liver disease. The Korean journal of hepatology. 2011;17(1):27–36. doi: 10.3350/kjhep.2011.17.1.27. [DOI] [PMC free article] [PubMed] [Google Scholar]
- 13.Meffert PJ, Baumeister SE, Lerch MM, et al. Development External Validation, and Comparative Assessment of a New Diagnostic Score for Hepatic Steatosis. Am J Gastroenterol. 2014 doi: 10.1038/ajg.2014.155. [DOI] [PubMed] [Google Scholar]
- 14.Roseman DA, Hwang SJ, Manders ES, et al. Renal Artery Calcium, Cardiovascular Risk Factors, and Indexes of Renal Function. The American journal of cardiology. 2014;113(1):156–61. doi: 10.1016/j.amjcard.2013.09.036. [DOI] [PMC free article] [PubMed] [Google Scholar]
- 15.Speliotes EK, Massaro JM, Hoffmann U, et al. Liver fat is reproducibly measured using computed tomography in the Framingham Heart Study. Journal of gastroenterology and hepatology. 2008;23(6):894–9. doi: 10.1111/j.1440-1746.2008.05420.x. [DOI] [PMC free article] [PubMed] [Google Scholar]
- 16.DeLong ER, DeLong DM, Clarke-Pearson DL. Comparing the areas under two or more correlated receiver operating characteristic curves: a nonparametric approach. Biometrics. 1988;44(3):837–45. Epub 1988/09/01. [PubMed] [Google Scholar]
- 17.Pencina MJ, D'Agostino RB, Sr, D'Agostino RB, Jr, et al. Evaluating the added predictive ability of a new marker: from area under the ROC curve to reclassification and beyond. Stat Med. 2008;27(2):157–72. doi: 10.1002/sim.2929. discussion 207-12. [DOI] [PubMed] [Google Scholar]
- 18.Pencina MJ, D'Agostino RB, Sr, Steyerberg EW. Extensions of net reclassification improvement calculations to measure usefulness of new biomarkers. Stat Med. 2011;30(1):11–21. doi: 10.1002/sim.4085. [DOI] [PMC free article] [PubMed] [Google Scholar]
- 19.Lazo M, Hernaez R, Eberhardt MS, et al. Prevalence of nonalcoholic fatty liver disease in the United States: the Third National Health and Nutrition Examination Survey, 1988-1994. American journal of epidemiology. 2013;178(1):38–45. doi: 10.1093/aje/kws448. [DOI] [PMC free article] [PubMed] [Google Scholar]
- 20.Statisitics NCfH. NHANES III Hepatic Steatosis Ultrasound Images Assessment Procedures Manual. Nov 2010;:43. updated December 30, 2014. Available from: http://www.cdc.gov/nchs/data/nhanes/nhanes3/Hepatic_Steatosis_Ultrasound_Procedures_Manual.pdf.
- 21.Kawamoto R, Kohara K, Kusunoki T, et al. Alanine aminotransferase/aspartate aminotransferase ratio is the best surrogate marker for insulin resistance in non-obese Japanese adults. Cardiovascular diabetology. 2012;11:117. doi: 10.1186/1475-2840-11-117. [DOI] [PMC free article] [PubMed] [Google Scholar]
- 22.Ioannou GN, Weiss NS, Boyko EJ, et al. Contribution of metabolic factors to alanine aminotransferase activity in persons with other causes of liver disease. Gastroenterology. 2005;128(3):627–35. doi: 10.1053/j.gastro.2004.12.004. [DOI] [PubMed] [Google Scholar]
- 23.Duman DG, Celikel C, Tuney D, et al. Computed tomography in nonalcoholic fatty liver disease: a useful tool for hepatosteatosis assessment? Digestive diseases and sciences. 2006;51(2):346–51. doi: 10.1007/s10620-006-3136-9. [DOI] [PubMed] [Google Scholar]
- 24.Zeb I, Li D, Nasir K, et al. Computed tomography scans in the evaluation of fatty liver disease in a population based study: the multi-ethnic study of atherosclerosis. Academic radiology. 2012;19(7):811–8. doi: 10.1016/j.acra.2012.02.022. [DOI] [PMC free article] [PubMed] [Google Scholar]
- 25.Bedogni G, Bellentani S, Miglioli L, et al. The Fatty Liver Index: a simple and accurate predictor of hepatic steatosis in the general population. BMC gastroenterology. 2006;6:33. doi: 10.1186/1471-230X-6-33. [DOI] [PMC free article] [PubMed] [Google Scholar]
- 26.Fuyan S, Jing L, Wenjun C, et al. Fatty liver disease index: a simple screening tool to facilitate diagnosis of nonalcoholic fatty liver disease in the Chinese population. Digestive diseases and sciences. 2013;58(11):3326–34. doi: 10.1007/s10620-013-2774-y. Epub 2013/08/01. [DOI] [PubMed] [Google Scholar]
- 27.Lee JH, Kim D, Kim HJ, et al. Hepatic steatosis index: a simple screening tool reflecting nonalcoholic fatty liver disease. Digestive and liver disease : official journal of the Italian Society of Gastroenterology and the Italian Association for the Study of the Liver. 2010;42(7):503–8. doi: 10.1016/j.dld.2009.08.002. [DOI] [PubMed] [Google Scholar]
- 28.Otgonsuren M, Estep MJ, Hossain N, et al. A Single Non-invasive Model to Diagnose Non-alcoholic Fatty Liver Disease (NAFLD)and Non-alcoholic Steatohepatitis (NASH) Journal of gastroenterology and hepatology. 2014 doi: 10.1111/jgh.12665. [DOI] [PubMed] [Google Scholar]
- 29.Park SH, Kim PN, Kim KW, et al. Macrovesicular hepatic steatosis in living liver donors: use of CT for quantitative and qualitative assessment. Radiology. 2006;239(1):105–12. doi: 10.1148/radiol.2391050361. [DOI] [PubMed] [Google Scholar]
- 30.Ioannou GN, Boyko EJ, Lee SP. The prevalence and predictors of elevated serum aminotransferase activity in the United States in 1999-2002. The American journal of gastroenterology. 2006;101(1):76–82. doi: 10.1111/j.1572-0241.2005.00341.x. [DOI] [PubMed] [Google Scholar]