

Abstract
Purpose
We have previously reported that DCE-MRI perfusion patterns, obtained from LABC patients prior to neoadjuvant therapy, predicted pathologic clinical response. Genomic analyses were also independently conducted on the same patient population. This retrospective study was performed to test two hypotheses: i) gene expression profiles are associated with DCE-MRI perfusion patterns; ii) association between long term overall survival data and gene expression profiles can lead to identification of novel predictive biomarkers.
Methods
We utilized RNA microarray and DCE-MRI data from 47 LABC patients, including 13 IBC patients. Association between gene expression profile and DCE-MRI perfusion patterns (centrifugal and centripetal) was determined by Wilcoxon rank sum test. Association between gene expression level and survival was assessed using a Cox rank score test. Additional genomic analysis of the IBC subset, with up to an 11-year period of follow-up, was conducted. Associations between gene expression and overall survival were further assessed in TCGA database.
Results
Differences in gene expression profiles were seen between centrifugal and centripetal perfusion patterns in the: sulfotransferase family, cytosolic, 1A, phenol-preferring, member 1 and 2 (SULT1A1, SULT1A2), poly (ADP-ribose) polymerase, member 6 (PARP6), and metastasis tumor antigen1 (MTA1). In the IBC subset, our analyses demonstrated that differential expression of 45 genes was associated with long term survival.
Conclusions
Here we have demonstrated an association between DCE-MRI perfusion patterns and gene expression profiles. In addition we have reported on candidate prognostic biomarkers in IBC patients, with some of the genes being significantly associated with survival in IBC and LABC.
Keywords: Breast Cancer, Inflammatory Breast Cancer, Locally Advanced Breast Cancer, Survival, DCE-MRI, Genomic, Imaging, Perfusion Patterns
Introduction
Locally advanced breast cancer (LABC) and inflammatory breast cancer (IBC) have poor 5-year survival rates (55% and 33%, respectively) when compared to early-stage breast cancer (80%). (1–3) The purpose of neoadjuvant chemotherapy is to improve the treatment outcome of the breast cancer patients by down staging the tumor. Effective downstaging of the tumor before surgery will provide for more conservative surgery and potentially converting inoperable tumors to an operable state. (4, 5) In breast cancer patients who receive neoadjuvant chemotherapy, 20–30% will achieve pathologic clinical response (pCR). It has been shown that patients who achieve a pCR have a better prognosis. However, not all patients respond to neoadjuvant treatment, and thus there is a clear need for biomarkers that accurately predict response to treatment. (5)
Between 2000 and 2004, 47 LABC patients were enrolled in an IRB-approved phase I/II clinical trial at Duke University Medical Center (Durham, NC). (6) The patients enrolled in this clinical trial received a neoadjuvant combination of breast hyperthermia, liposomal doxorubicin (Evacet™), and paclitaxel. Hyperthermia was administered within one hour of completing chemotherapy infusion. The hyperthermia prescription was to achieve 41–41.5 °C in greater than 90% of measured points for 60–70 minutes. The neoadjuvant treatment was followed by surgery, radiation therapy and adjuvant chemotherapy. Safety, tolerability and pathological response of this combination treatment has been reported previously. (4, 6)
RNA from pre-treatment ultrasound guided core biopsies were assayed using Affymetrix GeneChip® Human Genome U133 Plus 2.0 arrays. Of the 47 patients enrolled in the clinical trial, a 20-patient subgroup in the phase II portion of the trial, received the same paclitaxel and liposomal drug dose. Pre-treatment DCE-MRI (dynamic contrast-enhanced magnetic resonance imaging) studies were performed on this subset. The DCE-MRI enhancement features were analyzed for association with treatment response. (7) DCE-MRI patterns can vary between tumors, based on factors such as the size of the extra cellular space and vascularity of the tumor. Thus, the results can be indicative of angiogenesis, perfusion and/or hypoxic conditions in the tissue, all of which play vital roles in tumor development, progression and sensitivity to treatment. (7–11) In this patient dataset, we observed two distinct patterns of image enhancement: i) centripetal (CP), an inhomogeneous ring-type enhancement and ii) centrifugal (CF), characterized by more homogenous signal enhancement from center to periphery (Figure 1). (7, 9, 10)
Figure 1. Wash in Parameter maps generated from DCE-MRI in LABC patients.
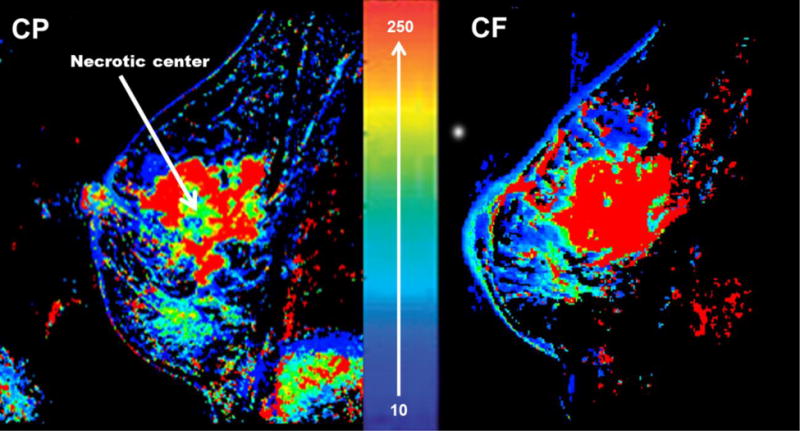
Wash in Parameter (WiP) maps are surrogates for perfusion/permeability. (7) The right side image shows the CF enhancement pattern which is a uniform enhancement from center to periphery. The left side image is the CP enhancement pattern which is an inhomogeneous ring-type enhancement. The 10–250 scale represents the range of the WiP as previously described in detail. (7)
In this current study, we tested two hypotheses: i) gene expression profiles are associated with the DCE-MRI perfusion patterns; ii) association between long term overall survival (OS) data and gene expression profiles can lead to identification of novel predictive biomarkers.
In order to test our hypotheses, we analyzed potential linkages between gene expression profiles and DCE-MRI parameters in LABC patients. In addition, we analyzed associations between long term OS and gene expression profiles in the IBC subgroup. Our OS analysis results were further validated using “The Cancer Genome Atlas” (TCGA) database.
Materials and Methods
Study population
Institutional Review Board (IRB) approval was obtained for this retrospective study (Protocol # Pro00028021). The Duke Health System Institutional Review Board for Clinical Investigations (DUHS IRB) has determined the specific components above to be in compliance with all applicable Health Insurance Portability and Accountability Act (“HIPAA”) regulations. In addition, DUHS IRB has approved and provided us with a “Waiver of Consent and HIPAA Authorization”. We were not required to register this study on clinicaltrials.gov, because retrospective studies do not qualify as ACT (Applicable Clinical trial) studies.
The original selection of the study population has been described in detail elsewhere including the patients’ treatment, clinical characteristics, and demographic data. (4, 6) Briefly, between 2000 and 2004, 47 LABC patients (Stage IIB and III) were enrolled on an IRB-approved phase I/II clinical trial at Duke University Medical Center (Durham, NC, Protocol # Pro1884-99-10). Patients were treated with neoadjuvant liposomal doxorubicin and paclitaxel in combination with breast hyperthermia, every three weeks for four cycles. The median patients’ age was 50 years (range 27–75 years). From the total of 47 patients enrolled in the clinical trial, pretreatment biopsies, collected under ultrasound guidance, were available from 37 patients, including 13 with a diagnosis of IBC. All 37 pretreatment biopsies were confirmed to have at least 60% invasive disease throughout the core sample before RNA harvesting. RNA was prepared, probe generated, and hybridized to the Affymetrix GeneChip® Human Genome U133 Plus 2.0 array. (4, 6) For the current analysis, our study population had long term surveillance of 11 years (median=8.4 years; range 0.3 – 11 years). All genomic data and samples were linked to clinical data.
DCE-MRI
The image analysis protocol has previously been described in detail for characterization of the CP and CF perfusion patterns. (7, 12) A 20-patient subgroup in the phase II portion of the trial was chosen for the DCE_MRI analysis from the 47 patients. These 20 patients were chosen because their breast DCE-MRI data was attained using the same protocol, and because all received the same dosage of neoadjuvant chemotherapy and hyperthermia. The DCE-MRI was done over 30 minutes following bolus injection of gadopentetate-based contrast agent (gadopentetate dimeglumine (Gd-DTPA). The contrast agent was administered through an indwelling IV catheter with a 2cm3/sec rate. (7)
Data Analysis & Statistical Considerations
The genomic data discussed in this paper has been deposited in the NCBI’s Gene Expression Omnibus (GEO, http://www.ncbi.nlm.nih.gov/geo/). (13) The deposited data are accessible though the GEO Series accession number GSE52322; “Novel linkages between DCE-MRI and genomic profiling in locally advanced and inflammatory breast cancer”. (http://www.ncbi.nlm.nih.gov/geo/query/acc.cgi?acc=GSE52322)
A) Analysis of association between gene expression profiles and DCE-MRI perfusion patterns
LABC samples were assayed using the Affymetrix GeneChip® Human Genome U133 Plus 2.0 array, which interrogates mRNA expression, based on 54,675 probe sets. All statistical analyses were conducted using the R statistical environment. (14, 15) Pre-processing was conducted on the basis of all available samples from the LABC study deemed to be of good quality, regardless of the availability of the imaging phenotype. (16) The arrays were pre-processed using the RMA algorithm. (17) Ordination methods (e.g., multi-dimensional scaling) were used to identify experimental artifacts, such as batch effects. (18) From the 20 patients subgroup who had the DCE-MRI, 15 had both imaging and genomic data available. Association between the gene expression profile and the DCE-MRI CP versus CF morphology was determined by the Wilcoxon rank sum test to prioritize the features (probesets) according to statistical significance. (16, 19)
B) Analysis of gene expression profiles and patient survival
Association between feature expression level and survival was assessed using a Cox rank score test. (16) Corresponding effect size was quantitatively assessed using a hazard ratio assuming proportional hazards. Conditional inference trees were used to find optimal cutpoints. (20) As the feature selection process was considered to be hypothesis generating, the P-values reported have not been adjusted for multiple testing. The associations between expression level and OS for the implicated genes were further assessed in a published cohort from TCGA (https://tcga-data.nci.nih.gov/tcga/) using the Breast Invasive Carcinoma project dataset. (21) The TCGA mRNA data were retrieved from the Cancer Genomic Data Server (CGDS) through the Computational Biology Center Portal (cBio): http://www.cbioportal.org/. The cdgsr extension package (cran.rproject.org/web/packages/cgdsr/) was used to execute the retrieval.
Results
A) Association between gene expression profiles and DCE-MRI perfusion patterns
Of the fifteen patients with both genomic and imaging information, ten patients had the CP perfusion pattern while five had the CF pattern. (Figure 1) Following data analysis on RNA microarray results we identified genes that were differentially expressed in the CP vs CF. (Figure 2) The CP pattern was found to have higher expression of genes involved in a component of sulfur metabolism pathway. In particular, genes included those in the sulfotransferase family: i) sulfotransferase family, cytosolic, 1A, phenol-preferring, member 1 (SULT1A1), and ii) sulfotransferase family, cytosolic, 1A, phenol-preferring, member 2 (SULT1A2). (Figure 3-A and 3-B) In addition, CP had similarly higher RNA expression levels of poly (ADP-ribose) polymerase, member 6 (PARP6). (Figure 3-C) The metastasis tumor antigen1 (MTA1) was also differentially expressed in the CP vs. CF morphology. However in contrast to the previous three genes, MTA1 was overexpressed in CF when compared to CP (Figure 3-D). Even though MTA functions as an estrogen receptor 1 (ESR1) co-repressor, we did not find a positive association between the CP and CF enhancement patterns and levels of ESR1 expression in our dataset. Only one of the nine probe sets representing ESR1 demonstrated a positive association. (ESR1:205225_at; p-value=0.028; with lower ESR1 expression in the CF cases compared to CP)
Figure 2. Heatmap cluster plot of Affymetrix microarray data in LABC samples.
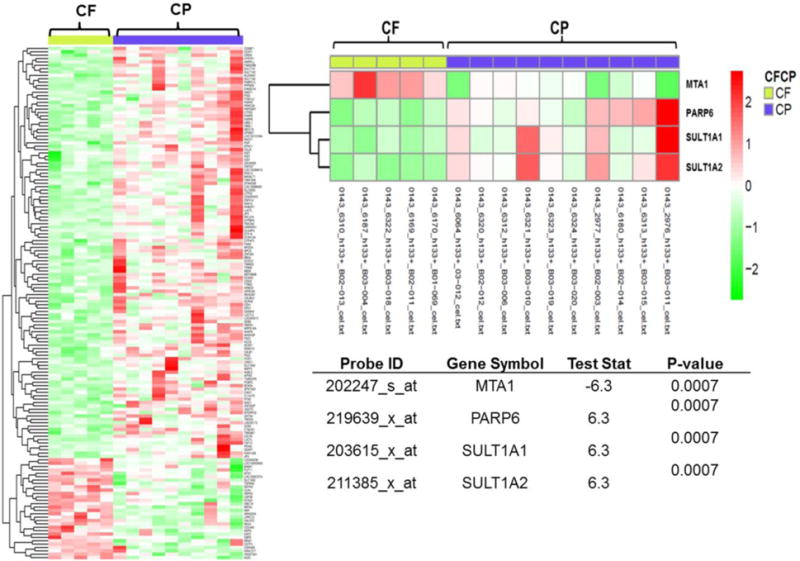
This heatmap plot records post-normalization between-probes distances measured by their absolute median difference. The left diagram represents all the top probesets associated with144 genes, which were differentially expressed in CF vs. CP (p-value < 0.008). 80% of the probes had higher expression levels in the CP enhancement pattern and only 20% had higher expression levels in CF. The right diagram is the enlarged heatmap for MTA1, PARP6, SULT1A1 and SULT1A2. In the table test statistic (teststat) is the smaller of two sums of ranks of given sign. The negative test statistics represent higher expression level of a gene in the CF pattern, and a positive test statistics represents higher expression level in the CP perfusion pattern.
Figure 3. Differential expression levels in the CF enhancement pattern compare to the CP.
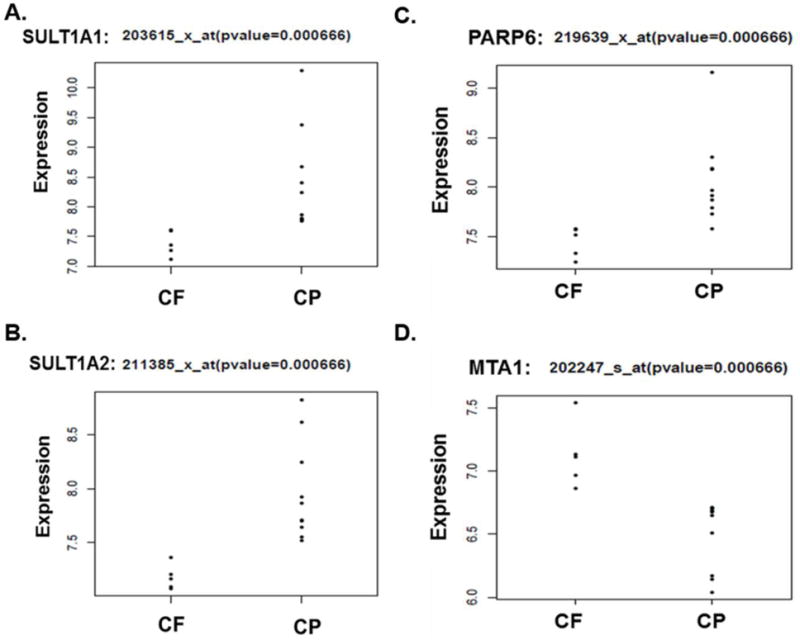
A–B) Our analysis demonstrates an over expression of SULTs (SULT1A1 and SULT1A2) in the CP enhancement compare to CF. C) The CP enhancement pattern is associated with higher expression levels of PARP6. D) MTA1 shows higher expression levels in the CF enhancement pattern compared to the CP.
B) Association between long term overall survival (OS) data and gene expression profiles
Our follow up time for the patients in this trial was 11 years and the median follow up time was 8.4 years. We analyzed the association between the genomic expression data and OS in the subgroup of 13 IBC patients. We limited the sample analysis to the IBC cases because they provided the largest subgroup out of the total 47 that had a uniform tumor type. In our survival analysis overexpression of 45 genes were found to be associated with OS in IBC patients (p-value <0.001). The genes identified were involved in the sulfur metabolism pathway and the focal adhesion kinase (FAK) pathway. (Table 1 and supplemental data) Overexpression of two genes involved in the sulfur metabolism pathway was associated with shorter OS, these included carbohydrate (chondroitin 4) sulfotransferase 11 (CHST11, p-value= 7.88E-05, HR= 2.4) and carbohydrate (chondroitin 6) sulfotransferase 3 (CHST3, p-value= 5.84E-04, HR= 1.5). In addition, over expression of four members of the FAK pathway were significantly associated with shorter OS in IBC patients. These included: collagen, type IV, alpha 4 (COL4A4, p-value= 7.82 E-04, HR= 1.6), protein kinase C, alpha (PRKCA, p-value= 6.56 E-04, HR= 1.6), talin 2 (TLN2, p-value= 5.25E-04, HR= 1.6) and tenascin C (TNC p-value= 9.01E-04, HR= 1.7). In our OS analysis we also noticed that our list included two of the genes associated tumor invasiveness and treatment resistance: i) hypoxia up-regulated protein 1 (HYOU1, p–value= 2.00E-04, HR=1.7), and ii) apoptosis caspase activation inhibitor (AVEN, p–value= 1.03E-03, HR=1.5).
Table 1.
Association between gene expression patterns and overall survival in IBC patients.
| Probe | Symbol | p-value | HR | Sctest p-value | Cox HR |
|---|---|---|---|---|---|
| 226914_at | ARPC5L | 4.00E-04 | 1.8 | 4.42E-04 | 1.8 |
| 219366_at | AVEN | 1.90E-03 | 1.5 | 1.03E-03 | 1.5 |
| 236331_at | CDKL2 | 1.50E-03 | 1.5 | 1.20E-03 | 1.5 |
| 226372_at | CHST11 | 0.00E+00 | 2.4 | 7.88E-05 | 2.4 |
| 32094_at | CHST3 | 7.00E-04 | 1.5 | 5.84E-04 | 1.5 |
| 229779_at | COL4A4 | 9.00E-04 | 1.6 | 7.82E-04 | 1.6 |
| 213274_s_at | CTSB | 6.00E-04 | 1.6 | 4.63E-04 | 1.6 |
| 200825_s_at | HYOU1 | 1.00E-04 | 1.7 | 1.99E-04 | 1.7 |
| 213093_at | PRKCA | 1.00E-03 | 1.6 | 6.56E-04 | 1.6 |
| 209325_s_at | RGS16 | 1.00E-03 | 1.6 | 6.26E-04 | 1.6 |
| 212701_at | TLN2 | 5.00E-04 | 1.6 | 5.25E-04 | 1.6 |
| 201645_at | TNC | 1.50E-03 | 1.7 | 9.01E-04 | 1.7 |
The complete list of the 45 genes associated with OS is presented in the supplemental data.
The HR and p-value is computed based on the permutation resampling inference test for survival data. The “sctest p-value” and “cox HR” columns are based on the log rank test.
We used the publically available TCGA database for external confirmation of our survival analysis results. Currently TCGA does not provide access to imaging data to be used for CP vs. CF classification; therefore we were not able to use the TCGA database for confirmation of linking DCE-MRI and gene expression profiles. We analyzed the survival association between the expression level of the 45 genes of interest in the TCGA’s LABC group with a sample size of N=462 (we did not have the data available from TCGA to specifically select the IBC cases from the main LABC group). In TCGA’s LABC cohort, differential expression of four genes from our gene list exhibited the same significant concordance and association with overall survival as in IBC patients. The genes included i) actin related protein 2/3 complex, subunit 5-like (ARPC5L, Duke p-value = 4.42E-04, HR=1.8, TCGA p-value = 1.20E-03, HR =2.3); ii) regulator of G protein signaling 16 (RGS16, Duke p-value = 6.26E-04, HR= 1.6 TCGA p-value= 1.58E-03, HR =2.8); iii) cyclin-dependent kinase-like 2 (CDKL2, Duke p-value = 1.50E-03, HR=1.5, TCGA p-value= 9.66E-03, HR =2.0); iv) Cysteine protease cathepsin B (CTSB) (, Duke p-value = 4.63E-04, HR=1.6, TCGA p-value= 1.95E-02 HR =2.1). (Figure 4 and 5; Table 1)
Figure 4. Gene expression patterns and overall survival in IBC patients.
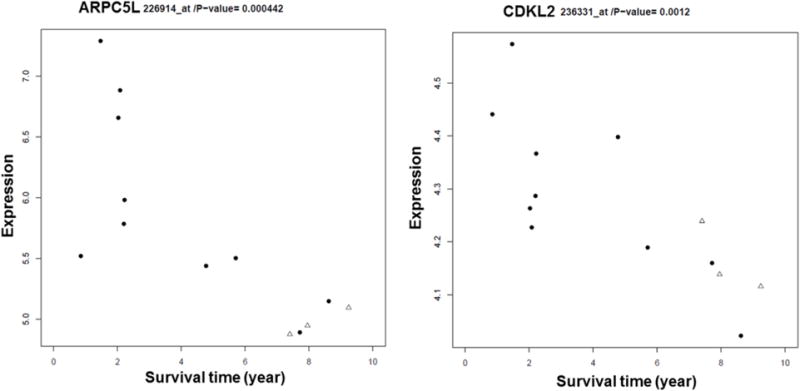
ARPC5L and CDKL2 expression levels are significantly associated with long term OS in IBC patients. The “Survival Time” represents years. Three of the patients from the Duke clinical trial who are alive are represented with a “triangles” symbol in the graph.
Figure 5. External confirmation for gene expression patterns and overall survival in LABC using TCGA database.
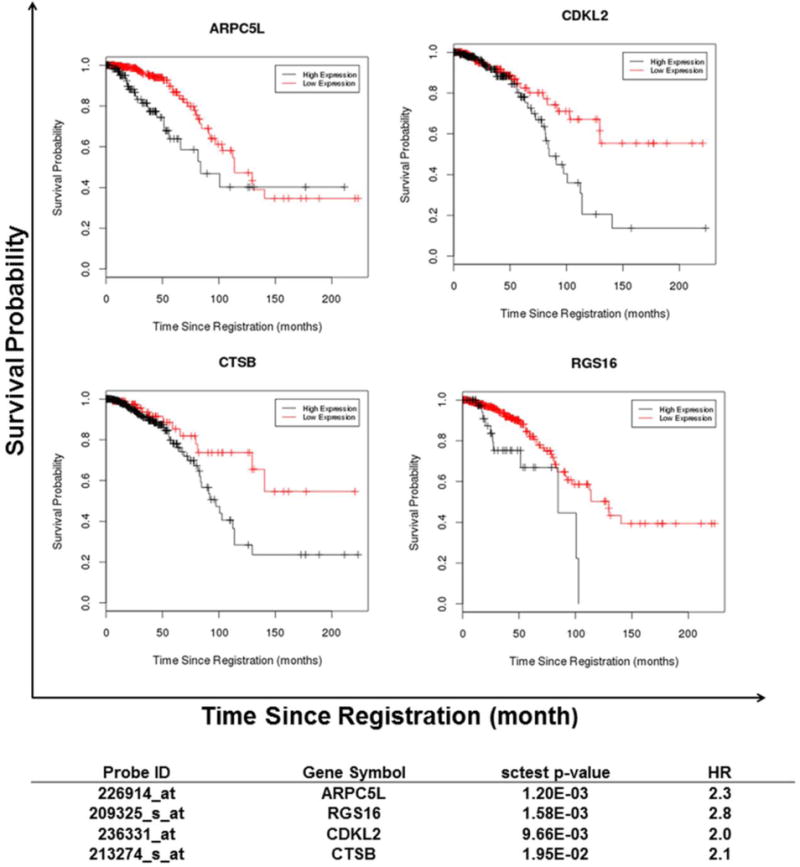
In TCGA LABC cohort differential expression of four genes exhibited the same significant concordance and association with overall survival as in the IBC patients. The black lines in the graph represent high expression levels and the red lines represent low expression levels of the genes. The “sctest p-value” and “HR” (which is a cox HR) columns are based on the log rank test.
Discussion
A) Association between gene expression profiles and DCE-MRI perfusion patterns
Our group previously reported that DCE-MRI parameters are linked to treatment outcome in canine and human cancers. (7, 22) We reported that DCE-MRI parameters were predictive of overall and metastasis-free survival in 37 dogs with soft tissue sarcomas that were treated with thermoradiotherapy. This was the first study to report a linkage between DCE-MRI parameters in sarcomas and long-term outcome. (22) In humans, we previously reported that DCE-MRI perfusion patterns, obtained from LABC patients prior to neoadjuvant and hyperthermia therapy were predictive of pCR. (7)
Here we have analyzed links in gene expression profiles and DCE-MRI parameters in LABC patients. Our results indicate that the two DCE-MRI enhancement patterns of CF and CP have distinct gene expression profiles. Out of the top 200 probesets associated with 144 genes, which were differentially expressed in CF vs. CP (p-value < 0.008), 80% of the probes had higher expression levels in the CP enhancement pattern and only 20% had higher expression levels in CF.
CP was found to have higher expression in genes involved in a component of sulfur metabolism pathway. Cytosolic sulfotransferase (SULTs) function as catalysts for biotransformation of steroid hormones, drugs and environmental toxins. Table 2 provides some background information and references for SULTs. Through sulfoconjugation, SULTs play a key role in the metabolism and inactivation of estrogen. It is therefore theorized that overexpression of the SULTs genes in CP morphologies could decrease the levels of unconjugated estrogens (the active form of estrogen) in breast cancer tissue and consequently block the proliferative effect of the hormone. In addition estrogen directly affects tumor microenvironment. Estrogen has direct effect on endothelial cells resulting in endothelial cell migration, proliferation and modulating angiogenesis. (23) This suggests that patients with the CP enhancement pattern with higher expressions of SULTs could have lower levels of active estrogen. This observation potentially draws an important connection between genomics, imaging, and therapy, and thus merits further investigation.
Table 2.
Overview of some of the biological processes associated with differential expression of our genes of interest.
| Gene Symbol | Gene Function |
|---|---|
| A. Genes differentially expressed in the DCE-MRI enhancement patterns (CP vs. CF) | |
| MTA1 | MTA1 is a potential predictor for breast tumor aggressiveness; Is involved in angiogenesis and is a predictor of early disease relapse; (44, 45); MTA1can repress the ESR1 trans-activation function; (46, 47) MTA1 can inactivate the tumor suppressor TP53; (48, 49), and deacetylate and stabilize the hypoxia-inducible factor-1alpha (HIF-1α) which is a key regulator of angiogenic factors. (50–52) MTA proteins, including MTA1, have been reported as possible set of “master co-regulatory molecules” involved in the carcinogenesis and progression of various malignancies. (47) |
| PARP6 | PARP superfamily is involved in the regulation of angiogenesis, differentiation, proliferation, cell death, tumor transformation and DNA damage recovery. (53, 54); PARP inhibitors can decrease angiogenesis since inhibition of PARP will affect VEGF-induced proliferation and migration. (55, 56) |
| SULT1A1& SULT1A2 | Alterations in the expression of SULT enzymes and their genetic polymorphisms have been reported in lung, prostate, and breast cancer;(57, 58) Several members SULT family are responsible for the sulfation of estrogens, therapeutic estrogenic compounds, and hormone replacement therapy (HRT) agents; SULTs play a key role in the metabolism and inactivation of estrogen. (59) |
| B. Genes differentially expressed in the survival analysis for the IBC patients** | |
| ARPC5L | ARPC5L belongs to the ARPC5 family, and has been implicated in invasion and metastasis in human head and neck squamous cell carcinoma (HNSCC). (38) |
| AVEN | Aven is considered a regulator of apoptosis. Resistance to apoptosis is associated with carcinogenesis, tumor progression, and treatment resistance In various tumors such as childhood acute lymphoblastic leukemia and acute myeloid leukemia overexpression of AVEN has been associated with poor prognosis. (60–62) |
| CDKL2 | CDKL2 is a member of a large family of CDC2-related serine/threonine protein kinase. CDC2 overexpression in breast tumors has been associated with infiltrative tumor border pattern and histologic high grade breast carcinomas. (40) |
| CHST11 & CHST3 | CHST11 and CHST3, are involved in the sulfur metabolism pathway. CHST11 mediates 4-O sulfation of chondroitin, whileCHST3 mediates 4-O sulfation of chondroitin. (63) Chondroitin sulfates are involved in breast tumor aggressiveness and metastasis and CHST11 and CHST3 overexpression have been reported to be associated with more aggressive breast tumors. (35) |
| COL4A4 | COL4A4 is a protein that belongs to the type IV collagen family. Overexpression of the type IV collagen family members s have been implicated to be associated with tumor size, higher grade, metastasis and invasion in malignancies such as breast, ovarian, cervical, colorectal and gastric cancers. (64–66) |
| CTSB | Over expression of CTSB, has reported to be associated with tumor invasiveness and poor patient prognosis in different tumor types including in melanoma, prostate and breast cancers. (67) In inflammatory breast cancer, CTSB over expression has been suggested as a prognosis biomarker associated with poor survival and increased number of positive metastatic lymph nodes. (41) |
| HYOU1 | HYOU1 has been associated with tumor invasiveness and resistance to therapy. HYOU1 suppression also results in increased apoptosis. (68–70) |
| PRKCA | PRKCA is a member of the Protein kinase C (PKC) family which can play an important role in cell signaling pathways by phosphorylating protein targets. High expression levels of PRKCA has been reported as a potential marker for poor prognosis and associated with breast cancer progression. (71) |
| RGS16 | RGS16 is a member of the RGS super family of proteins which are a class of intracellular signaling regulators. The RGS family has been considered as therapeutic targets, including in breast cancer. (42, 43) |
| TLN2 | In the FAK pathway, FAK and TLN are two key players in matrix-cell adhesion assembly, which is required for cell migration which in turn can result in tumor metastasis and progression. (72, 73) |
| TNC | TNC is frequently up-regulated in breast cancer and is promoting tumor invasion. TNC has been associated with promoting cell migration, angiogenesis and can acts as a cell survival factor. (39) |
The complete list of the 45 genes associated with OS is presented in the supplemental data.
Here we have reported that the CP morphology is also associated with higher expression levels of PARP6. (Table 2) Recently PARP inhibitors have been used in clinical trials and suggested as a favorable target in breast cancer therapy. (24–27) Our findings suggest that an enhancement pattern of CP might benefit more from PARP inhibitor treatment. Recent studies in animal models of endometrioid carcinoma, the major subtype of human endometrial cancers, have demonstrated that high estrogen levels interfered with the PARP inhibitor AZD2281 (olaparib). In lower serum estrogen levels, the PARP inhibitors resulted in more reduction in tumor size. (28) In addition, as mentioned previously the higher levels of SULTs in the CP tumors could result in inactivation of estrogen. The inactivation of estrogen potentially could also make tumors with CP enhancement a better target for PARP inhibitor treatment, and affect the patients’ pCR and prognosis.
Our imaging and gene expression analysis also demonstrated that MTA1 was overexpressed in CF tumors compare to CP. The metastasis tumor antigen (MTA) family of proteins (MTA1, MTA2, and MTA3) are transcriptional co-repressors. MTA1 is overexpressed in a wide range of human cancers, such as gastrointestinal, ovarian, prostate, and breast cancers (29–33). MTA1 is considered a potential predictor for breast tumor aggressiveness (Table 2). We noted that MTA1 was overexpressed in CF tumors, which were characterized to have a more homogenized vascular network, and thus a better potential for drug delivery. The improved drug delivery characteristics could potentially be counteracted by increased aggressiveness in tumors with CF phenotypes which at the end could affect pCR rate.
B) Association between overall survival data and gene expression profiles
In the second part of our study we focused on the association between gene expression profiles and long term survival of breast cancer patients. The long follow up time of 11 years and availability of clinical data provided the unique opportunity to analyze the association between gene expression profiles and long term OS. Limiting our analysis to the IBC cases provided the largest subgroup out of the total 47 patients with a more uniform tumor type. IBC is a rare subtype of LABC, and the most aggressive form of breast cancer. IBC survival rates are relatively poor, averaging 35% to 40%. IBC has no known etiology and has no proven effective therapy. In spite of aggressive multimodality therapies over the past three decades, there has been relatively little improvement in the overall survival rate of IBC. (2, 3, 34)
Here we were able identify candidate gene expression profiles that defined signaling pathways associated with survival in IBC patients. For the Duke IBC patient subgroup, overexpression of 45 genes was associated with poor survival; this included genes involved in the sulfur metabolism pathway and the FAK pathway. The expression patterns reflect themes common to the aggressive biology of breast cancer (e.g. metastasis, tumor invasiveness, cell migration). (Table 2)
Our results demonstrated that overexpression of CHST11 and CHST3, genes involved in the sulfur metabolism pathway, was associated with shorter OS in IBC patients. Chondroitin sulfates are involved in breast tumor aggressiveness and metastasis and CHST11 and CHST3 overexpression have been reported to be associated with more aggressive breast tumors. (35) This is in concordance with our findings since the patients with higher expression levels of CHST11 and CHST3, had shorter OS (HR of 2.4 and 1.5 respectively).
Activation of FAK signaling pathway in tumor cells, including breast tumors, can affect cellular processes such as metastasis, cell spreading, adhesion, proliferation, angiogenesis, progression and tumor survival. The FAK pathway can be a potential cancer therapeutic target to inhibit tumor invasion and progression. (36, 37) Our results demonstrated that in IBC patients, over expression of four FAK pathway genes: i) COL4A4, ii) PRKCA, iii) TLN2, and iv) TNC were significantly associated with shorter OS.
When we analyzed the association between survival and the expression level of the 45 genes of interest in the TCGA’s LABC cases (N=462), 4 genes had common levels of significance and concordant direction for LABC patients. Those 4 common genes between IBC and LABC are: i) ARPC5L, ii) RGS16, iii) CDKL2, and iv) CTSB.
The TCGA analysis provides an external confirmation for the importance of theses 4 genes in LABC. These 4 genes have been implicated in other studies for their roles in: tumor invasion and metastasis (ARPC5L and TNC); (38, 39) Infiltrative tumor border pattern and histologic high grade breast carcinomas (CDKL2); (40) potential prognosis biomarker associated with poor survival and increased number of positive metastatic lymph nodes in IBC patients (CTSB); (41) and potential therapeutic targets in cancer therapy (RGS16). (42, 43)
Conclusion
In conclusion, although these findings are preliminary we feel these results are especially important and merit further investigation and validation in independent datasets with a larger sample size and more homogenous tumor types. The major limitation of our study is the small sample size and lack of access to tumor samples from the patients enrolled in the original phase I/II clinical trial to perform additional validation experiments such as qPCR and western blot analysis. However, our preliminary results have shown unique links to changes in DCE-MRI and gene expression profiles. Here we reported on the differential genes expression profile between the CP and CF enhancement patterns. In addition we have reported on candidate prognostic biomarkers in IBC patients, with some of the genes being significantly associated with OS in IBC and LABC. While not all these genes have previously been reported to be associated with prognosis in IBC or LABC, they are consistent with other studies which associate these genes and gene products with aggressiveness and poor outcomes in other cancers.
Acknowledgments
We would like to acknowledge Mr. Salvatore Mungal, M.S., from the Duke Cancer Institute (DCI) Bioinformatics Shared Resource, for his help in submitting our data to the NCBI’s Gene Expression Omnibus (GEO, http://www.ncbi.nlm.nih.gov/geo/)
References
- 1.Cristofanilli M, Buchholz TA. Proceedings of the First International Inflammatory Breast Cancer Conference. Cancer. 2010 Jun 1;116(11 Suppl):2729. doi: 10.1002/cncr.25177. Epub 2010/06/22. eng. [DOI] [PubMed] [Google Scholar]
- 2.Dawood S, Merajver SD, Viens P, Vermeulen PB, Swain SM, Buchholz TA, et al. International expert panel on inflammatory breast cancer: consensus statement for standardized diagnosis and treatment. Ann Oncol. 2011 Mar;22(3):515–23. doi: 10.1093/annonc/mdq345. Epub 2010/07/07. eng. [DOI] [PMC free article] [PubMed] [Google Scholar]
- 3.Robertson FM, Bondy M, Yang W, Yamauchi H, Wiggins S, Kamrudin S, et al. Inflammatory breast cancer: the disease, the biology, the treatment. CA Cancer J Clin. 2010 Nov-Dec;60(6):351–75. doi: 10.3322/caac.20082. Epub 2010/10/21. eng. [DOI] [PubMed] [Google Scholar]
- 4.Vujaskovic Z, Kim DW, Jones E, Lan L, McCall L, Dewhirst MW, et al. A phase I/II study of neoadjuvant liposomal doxorubicin, paclitaxel, and hyperthermia in locally advanced breast cancer. Int J Hyperthermia. 2010;26(5):514–21. doi: 10.3109/02656731003639364. Epub 2010/04/10. eng. [DOI] [PMC free article] [PubMed] [Google Scholar]
- 5.Oh DS, Cheang MC, Fan C, Perou CM. Radiation-induced gene signature predicts pathologic complete response to neoadjuvant chemotherapy in breast cancer patients. Radiat Res. 2014 Feb;181(2):193–207. doi: 10.1667/RR13485.1. [DOI] [PMC free article] [PubMed] [Google Scholar]
- 6.Dressman HK, Hans C, Bild A, Olson JA, Rosen E, Marcom PK, et al. Gene expression profiles of multiple breast cancer phenotypes and response to neoadjuvant chemotherapy. Clin Cancer Res. 2006 Feb 1;12(3 Pt 1):819–26. doi: 10.1158/1078-0432.CCR-05-1447. Epub 2006/02/10. eng. [DOI] [PubMed] [Google Scholar]
- 7.Craciunescu OI, Blackwell KL, Jones EL, Macfall JR, Yu D, Vujaskovic Z, et al. DCE-MRI parameters have potential to predict response of locally advanced breast cancer patients to neoadjuvant chemotherapy and hyperthermia: a pilot study. International journal of hyperthermia: the official journal of European Society for Hyperthermic Oncology, North American Hyperthermia Group. 2009;25(6):405–15. doi: 10.1080/02656730903022700. [DOI] [PMC free article] [PubMed] [Google Scholar]
- 8.Kuhl CK, Schild HH. Dynamic image interpretation of MRI of the breast. J Magn Reson Imaging. 2000 Dec;12(6):965–74. doi: 10.1002/1522-2586(200012)12:6<965::aid-jmri23>3.0.co;2-1. Epub 2000/12/06. eng. [DOI] [PubMed] [Google Scholar]
- 9.Daniel BL, Yen YF, Glover GH, Ikeda DM, Birdwell RL, Sawyer-Glover AM, et al. Breast disease: dynamic spiral MR imaging. Radiology. 1998 Nov;209(2):499–509. doi: 10.1148/radiology.209.2.9807580. Epub 1998/11/10. eng. [DOI] [PubMed] [Google Scholar]
- 10.Helbich TH. Contrast-enhanced magnetic resonance imaging of the breast. Eur J Radiol. 2000 Jun;34(3):208–19. doi: 10.1016/s0720-048x(00)00200-x. Epub 2000/08/06. eng. [DOI] [PubMed] [Google Scholar]
- 11.Moeller BJ, Dewhirst MW. Raising the bar: how HIF-1 helps determine tumor radiosensitivity. Cell Cycle. 2004 Sep;3(9):1107–10. Epub 2004/08/25. eng. [PubMed] [Google Scholar]
- 12.Craciunescu OI, Thrall DE, Vujaskovic Z, Dewhirst MW. Magnetic resonance imaging: a potential tool in assessing the addition of hyperthermia to neoadjuvant therapy in patients with locally advanced breast cancer. Int J Hyperthermia. 2010;26(7):625–37. doi: 10.3109/02656736.2010.499526. Epub 2010/09/21. eng. [DOI] [PMC free article] [PubMed] [Google Scholar]
- 13.Barrett T, Wilhite SE, Ledoux P, Evangelista C, Kim IF, Tomashevsky M, et al. NCBI GEO: archive for functional genomics data sets—update. Nucleic Acids Research. 2013 Jan 1;41(D1):D991–D5. doi: 10.1093/nar/gks1193. 2013. [DOI] [PMC free article] [PubMed] [Google Scholar]
- 14.Gentleman R. Bioinformatics and computational biology solutions using R and Bioconductor. New York: Springer Science+Business Media; 2005. p. xix, 473. [Google Scholar]
- 15.Gentleman RC, Carey VJ, Bates DM, Bolstad B, Dettling M, Dudoit S, et al. Bioconductor: open software development for computational biology and bioinformatics. Genome Biol. 2004;5(10):R80. doi: 10.1186/gb-2004-5-10-r80. Epub 2004/10/06. eng. [DOI] [PMC free article] [PubMed] [Google Scholar]
- 16.Owzar K, Barry WT, Jung SH. Statistical considerations for analysis of microarray experiments. Clinical and translational science. 2011 Dec;4(6):466–77. doi: 10.1111/j.1752-8062.2011.00309.x. [DOI] [PMC free article] [PubMed] [Google Scholar]
- 17.Irizarry RA, Bolstad BM, Collin F, Cope LM, Hobbs B, Speed TP. Summaries of Affymetrix GeneChip probe level data. Nucleic Acids Res. 2003 Feb 15;31(4):e15. doi: 10.1093/nar/gng015. Epub 2003/02/13. eng. [DOI] [PMC free article] [PubMed] [Google Scholar]
- 18.Mardia JTK KV, Bibby JM. Multivariate Analysis. Academic Press; 1979. [Google Scholar]
- 19.Schoenfeld D. Partial Residuals for The Proportional Hazards Regression Model. Biometrika. 1982;69(1):239–41. [Google Scholar]
- 20.Hothorn T, Hornik K, Zeileis A. Unbiased recursive partitioning: A conditional inference framework. J Comput Graph Stat. 2006 Sep;15(3):651–74. English. [Google Scholar]
- 21.Ovarian cancer and body size: individual participant meta-analysis including 25,157 women with ovarian cancer from 47 epidemiological studies. PLoS Med. 2012;9(4):e1001200. doi: 10.1371/journal.pmed.1001200. Epub 2012/05/19. eng. [DOI] [PMC free article] [PubMed] [Google Scholar]
- 22.Viglianti BL, Lora-Michiels M, Poulson JM, Lan L, Yu D, Sanders L, et al. Dynamic contrast-enhanced magnetic resonance imaging as a predictor of clinical outcome in canine spontaneous soft tissue sarcomas treated with thermoradiotherapy. Clin Cancer Res. 2009 Aug 1;15(15):4993–5001. doi: 10.1158/1078-0432.CCR-08-2222. Epub 2009/07/23. eng. [DOI] [PMC free article] [PubMed] [Google Scholar]
- 23.Losordo DW, Isner JM. Estrogen and angiogenesis: A review. Arteriosclerosis, thrombosis, and vascular biology. 2001 Jan;21(1):6–12. doi: 10.1161/01.atv.21.1.6. Epub 2001/01/09. eng. [DOI] [PubMed] [Google Scholar]
- 24.Tutt A, Robson M, Garber JE, Domchek SM, Audeh MW, Weitzel JN, et al. Oral poly(ADP-ribose) polymerase inhibitor olaparib in patients with BRCA1 or BRCA2 mutations and advanced breast cancer: a proof-of-concept trial. The Lancet. 376(9737):235–44. doi: 10.1016/S0140-6736(10)60892-6. [DOI] [PubMed] [Google Scholar]
- 25.Dent RA, Lindeman GJ, Clemons M, Wildiers H, Chan A, McCarthy NJ, et al. Phase I trial of the oral PARP inhibitor olaparib in combination with paclitaxel for first- or second-line treatment of patients with metastatic triple-negative breast cancer. Breast Cancer Res. 2013 Sep 25;15(5):R88. doi: 10.1186/bcr3484. [DOI] [PMC free article] [PubMed] [Google Scholar]
- 26.Al-Ejeh F, Shi W, Miranda M, Simpson PT, Vargas AC, Song S, et al. Treatment of triple-negative breast cancer using anti-EGFR-directed radioimmunotherapy combined with radiosensitizing chemotherapy and PARP inhibitor. J Nucl Med. 2013 Jun;54(6):913–21. doi: 10.2967/jnumed.112.111534. [DOI] [PubMed] [Google Scholar]
- 27.Bundred N, Gardovskis J, Jaskiewicz J, Eglitis J, Paramonov V, McCormack P, et al. Evaluation of the pharmacodynamics and pharmacokinetics of the PARP inhibitor olaparib: a phase I multicentre trial in patients scheduled for elective breast cancer surgery. Investigational new drugs. 2013 Aug;31(4):949–58. doi: 10.1007/s10637-012-9922-7. [DOI] [PubMed] [Google Scholar]
- 28.Janzen DM, Paik DY, Rosales MA, Yep B, Cheng D, Witte ON, et al. Low levels of circulating estrogen sensitize PTEN-null endometrial tumors to PARP inhibition in vivo. Mol Cancer Ther. 2013 Dec;12(12):2917–28. doi: 10.1158/1535-7163.MCT-13-0572. [DOI] [PMC free article] [PubMed] [Google Scholar]
- 29.Toh Y, Kuwano H, Mori M, Nicolson GL, Sugimachi K. Overexpression of metastasis-associated MTA1 mRNA in invasive oesophageal carcinomas. Br J Cancer. 1999 Apr;79(11–12):1723–6. doi: 10.1038/sj.bjc.6690274. Epub 1999/04/17. eng. [DOI] [PMC free article] [PubMed] [Google Scholar]
- 30.Giannini R, Cavallini A. Expression analysis of a subset of coregulators and three nuclear receptors in human colorectal carcinoma. Anticancer Res. 2005 Nov-Dec;25(6B):4287–92. Epub 2005/11/29. eng. [PubMed] [Google Scholar]
- 31.Kidd M, Modlin IM, Mane SM, Camp RL, Eick G, Latich I. The role of genetic markers–NAP1L1, MAGE-D2, and MTA1–in defining small-intestinal carcinoid neoplasia. Ann Surg Oncol. 2006 Feb;13(2):253–62. doi: 10.1245/ASO.2006.12.011. Epub 2006/01/21. eng. [DOI] [PubMed] [Google Scholar]
- 32.Dannenmann C, Shabani N, Friese K, Jeschke U, Mylonas I, Bruning A. The metastasis-associated gene MTA1 is upregulated in advanced ovarian cancer, represses ERbeta, and enhances expression of oncogenic cytokine GRO. Cancer Biol Ther. 2008 Sep;7(9):1460–7. doi: 10.4161/cbt.7.9.6427. Epub 2008/08/23. eng. [DOI] [PubMed] [Google Scholar]
- 33.Hofer MD, Tapia C, Browne TJ, Mirlacher M, Sauter G, Rubin MA. Comprehensive analysis of the expression of the metastasis-associated gene 1 in human neoplastic tissue. Arch Pathol Lab Med. 2006 Jul;130(7):989–96. doi: 10.5858/2006-130-989-CAOTEO. Epub 2006/07/13. eng. [DOI] [PubMed] [Google Scholar]
- 34.Il’yasova D, Siamakpour-Reihani S, Akushevich I, Akushevich L, Spector N, Schildkraut J. What can we learn from the age- and race/ethnicity- specific rates of inflammatory breast carcinoma? Breast Cancer Research and Treatment. 2011;130(2):691–7. doi: 10.1007/s10549-011-1719-4. [DOI] [PMC free article] [PubMed] [Google Scholar]
- 35.Cooney CA, Jousheghany F, Yao-Borengasser A, Phanavanh B, Gomes T, Kieber-Emmons AM, et al. Chondroitin sulfates play a major role in breast cancer metastasis: a role for CSPG4 and CHST11 gene expression in forming surface P-selectin ligands in aggressive breast cancer cells. Breast Cancer Res. 2011;13(3):R58. doi: 10.1186/bcr2895. Epub 2011/06/11. eng. [DOI] [PMC free article] [PubMed] [Google Scholar]
- 36.Mitra SK, Schlaepfer DD. Integrin-regulated FAK–Src signaling in normal and cancer cells. Current Opinion in Cell Biology. 2006;18(5):516–23. doi: 10.1016/j.ceb.2006.08.011. 10// [DOI] [PubMed] [Google Scholar]
- 37.Golubovskaya VM, Cance W. Focal adhesion kinase and p53 signal transduction pathways in cancer. Frontiers in bioscience (Landmark edition) 2010;15:901–12. doi: 10.2741/3653. Epub 2010/06/03. eng. [DOI] [PMC free article] [PubMed] [Google Scholar]
- 38.Kinoshita T, Nohata N, Watanabe-Takano H, Yoshino H, Hidaka H, Fujimura L, et al. Actin-related protein 2/3 complex subunit 5 (ARPC5) contributes to cell migration and invasion and is directly regulated by tumor-suppressive microRNA-133a in head and neck squamous cell carcinoma. Int J Oncol. 2012 Jun;40(6):1770–8. doi: 10.3892/ijo.2012.1390. Epub 2012/03/02. eng. [DOI] [PubMed] [Google Scholar]
- 39.Hancox RA, Allen MD, Holliday DL, Edwards DR, Pennington CJ, Guttery DS, et al. Tumour-associated tenascin-C isoforms promote breast cancer cell invasion and growth by matrix metalloproteinase-dependent and independent mechanisms. Breast Cancer Res. 2009;11(2):R24. doi: 10.1186/bcr2251. Epub 2009/05/02. eng. [DOI] [PMC free article] [PubMed] [Google Scholar]
- 40.Chae SW, Sohn JH, Kim DH, Choi YJ, Park YL, Kim K, et al. Overexpressions of Cyclin B1, cdc2, p16 and p53 in human breast cancer: the clinicopathologic correlations and prognostic implications. Yonsei medical journal. 2011 May;52(3):445–53. doi: 10.3349/ymj.2011.52.3.445. Epub 2011/04/14. eng. [DOI] [PMC free article] [PubMed] [Google Scholar]
- 41.Nouh M, Mohamed M, El-Shinawi M, Shaalan M, Cavallo-Medved D, Khaled H, et al. Cathepsin B: a potential prognostic marker for inflammatory breast cancer. Journal of Translational Medicine. 2011;9(1):1. doi: 10.1186/1479-5876-9-1. [DOI] [PMC free article] [PubMed] [Google Scholar]
- 42.Bosch DE, Zielinski T, Lowery RG, Siderovski DP. Evaluating modulators of “Regulator of G-protein Signaling” (RGS) proteins. In: Enna (editor-in-chief) SJ, et al., editors. Current protocols in pharmacology/editorial board. 2012. Mar, Chapter 2:Unit2 8. Epub 2012/03/03. eng. [DOI] [PMC free article] [PubMed] [Google Scholar]
- 43.Kimple AJ, Willard FS, Giguere PM, Johnston CA, Mocanu V, Siderovski DP. The RGS protein inhibitor CCG-4986 is a covalent modifier of the RGS4 Galpha-interaction face. Biochim Biophys Acta. 2007 Sep;1774(9):1213–20. doi: 10.1016/j.bbapap.2007.06.002. [DOI] [PMC free article] [PubMed] [Google Scholar]
- 44.Jang K-S, Paik SS, Chung H, Oh Y-H, Kong G. MTA1 overexpression correlates significantly with tumor grade and angiogenesis in human breast cancers. Cancer Science. 2006;97(5):374–9. doi: 10.1111/j.1349-7006.2006.00186.x. [DOI] [PMC free article] [PubMed] [Google Scholar]
- 45.Martin MD, Hilsenbeck SG, Mohsin SK, Hopp TA, Clark GM, Osborne CK, et al. Breast tumors that overexpress nuclear metastasis-associated 1 (MTA1) protein have high recurrence risks but enhanced responses to systemic therapies. Breast Cancer Res Treat. 2006 Jan;95(1):7–12. doi: 10.1007/s10549-005-9016-8. Epub 2005/10/26. eng. [DOI] [PubMed] [Google Scholar]
- 46.Kumar R, Wang RA, Mazumdar A, Talukder AH, Mandal M, Yang Z, et al. A naturally occurring MTA1 variant sequesters oestrogen receptor-alpha in the cytoplasm. Nature. 2002 Aug 8;418(6898):654–7. doi: 10.1038/nature00889. Epub 2002/08/09. eng. [DOI] [PubMed] [Google Scholar]
- 47.Toh Y, Nicolson G. The role of the <i>MTA</i> family and their encoded proteins in human cancers: molecular functions and clinical implications. Clinical and Experimental Metastasis. 2009;26(3):215–27. doi: 10.1007/s10585-008-9233-8. [DOI] [PubMed] [Google Scholar]
- 48.Li DQ, Pakala SB, Reddy SD, Ohshiro K, Peng SH, Lian Y, et al. Revelation of p53-independent function of MTA1 in DNA damage response via modulation of the p21 WAF1-proliferating cell nuclear antigen pathway. J Biol Chem. 2010 Mar 26;285(13):10044–52. doi: 10.1074/jbc.M109.079095. Epub 2010/01/15. eng. [DOI] [PMC free article] [PubMed] [Google Scholar]
- 49.Moon HE, Cheon H, Lee MS. Metastasis-associated protein 1 inhibits p53-induced apoptosis. Oncol Rep. 2007 Nov;18(5):1311–4. Epub 2007/10/05. eng. [PubMed] [Google Scholar]
- 50.Yoo YG, Kong G, Lee MO. Metastasis-associated protein 1 enhances stability of hypoxia-inducible factor-1alpha protein by recruiting histone deacetylase 1. EMBO J. 2006 Mar 22;25(6):1231–41. doi: 10.1038/sj.emboj.7601025. Epub 2006/03/03. eng. [DOI] [PMC free article] [PubMed] [Google Scholar]
- 51.Dewhirst MW, Cao Y, Li CY, Moeller B. Exploring the role of HIF-1 in early angiogenesis and response to radiotherapy. Radiother Oncol. 2007 Jun;83(3):249–55. doi: 10.1016/j.radonc.2007.05.016. Epub 2007/06/15. eng. [DOI] [PMC free article] [PubMed] [Google Scholar]
- 52.Semenza GL. Oxygen Sensing, Homeostasis, and Disease REPLY. New England Journal of Medicine. 2011 Nov 10;365(19):1846. doi: 10.1056/NEJMc1110602. English. [DOI] [PubMed] [Google Scholar]
- 53.Ame JC, Spenlehauer C, de Murcia G. The PARP superfamily. BioEssays: news and reviews in molecular, cellular and developmental biology. 2004 Aug;26(8):882–93. doi: 10.1002/bies.20085. Epub 2004/07/27. eng. [DOI] [PubMed] [Google Scholar]
- 54.Kim MY, Zhang T, Kraus WL. Poly(ADP-ribosyl)ation by PARP-1: ‘PAR-laying’ NAD+ into a nuclear signal. Genes & development. 2005 Sep 1;19(17):1951–67. doi: 10.1101/gad.1331805. [DOI] [PubMed] [Google Scholar]
- 55.Pyriochou A, Olah G, Deitch EA, Szabo C, Papapetropoulos A. Inhibition of angiogenesis by the poly(ADP-ribose) polymerase inhibitor PJ-34. Int J Mol Med. 2008 Jul;22(1):113–8. Epub 2008/06/26. eng. [PubMed] [Google Scholar]
- 56.Rajesh M, Mukhopadhyay P, Batkai S, Godlewski G, Hasko G, Liaudet L, et al. Pharmacological inhibition of poly(ADP-ribose) polymerase inhibits angiogenesis. Biochem Biophys Res Commun. 2006 Nov 17;350(2):352–7. doi: 10.1016/j.bbrc.2006.09.049. Epub 2006/09/30. eng. [DOI] [PMC free article] [PubMed] [Google Scholar]
- 57.Aust S, Obrist P, Klimpfinger M, Tucek G, Jager W, Thalhammer T. Altered expression of the hormone- and xenobiotic-metabolizing sulfotransferase enzymes 1A2 and 1C1 in malignant breast tissue. Int J Oncol. 2005 Apr;26(4):1079–85. Epub 2005/03/09. eng. [PubMed] [Google Scholar]
- 58.Wang Y, Spitz MR, Tsou AM, Zhang K, Makan N, Wu X. Sulfotransferase (SULT) 1A1 polymorphism as a predisposition factor for lung cancer: a case-control analysis. Lung Cancer. 2002 Feb;35(2):137–42. doi: 10.1016/s0169-5002(01)00406-8. Epub 2002/01/24. eng. [DOI] [PubMed] [Google Scholar]
- 59.Falany JL, Falany CN. Interactions of the human cytosolic sulfotransferases and steroid sulfatase in the metabolism of tibolone and raloxifene. J Steroid Biochem Mol Biol. 2007 Nov-Dec;107(3–5):202–10. doi: 10.1016/j.jsbmb.2007.03.046. Epub 2007/07/31. eng. [DOI] [PMC free article] [PubMed] [Google Scholar]
- 60.Esmaili AM, Johnson EL, Thaivalappil SS, Kuhn HM, Kornbluth S, Irusta PM. Regulation of the ATM-activator protein Aven by CRM1-dependent nuclear export. Cell Cycle. 2010 Oct 1;9(19):3913–20. doi: 10.4161/cc.9.19.13138. Epub 2010/10/12. eng. [DOI] [PubMed] [Google Scholar]
- 61.Chau BN, Cheng EH, Kerr DA, Hardwick JM. Aven, a novel inhibitor of caspase activation, binds Bcl-xL and Apaf-1. Mol Cell. 2000 Jul;6(1):31–40. Epub 2000/08/19. eng. [PubMed] [Google Scholar]
- 62.Choi J, Hwang YK, Sung KW, Kim DH, Yoo KH, Jung HL, et al. Aven overexpression: association with poor prognosis in childhood acute lymphoblastic leukemia. Leuk Res. 2006 Aug;30(8):1019–25. doi: 10.1016/j.leukres.2005.11.001. Epub 2006/01/04. eng. [DOI] [PubMed] [Google Scholar]
- 63.Kluppel M. The roles of chondroitin-4-sulfotransferase-1 in development and disease. Progress in molecular biology and translational science. 2010;93:113–32. doi: 10.1016/S1877-1173(10)93006-8. [DOI] [PubMed] [Google Scholar]
- 64.Jiang CP, Wu BH, Chen SP, Fu MY, Yang M, Liu F, et al. High COL4A3 expression correlates with poor prognosis after cisplatin plus gemcitabine chemotherapy in non-small cell lung cancer. Tumour Biol. 2013 Feb;34(1):415–20. doi: 10.1007/s13277-012-0565-2. [DOI] [PubMed] [Google Scholar]
- 65.Nie XC, Wang JP, Zhu W, Xu XY, Xing YN, Yu M, et al. COL4A3 expression correlates with pathogenesis, pathologic behaviors, and prognosis of gastric carcinomas. Hum Pathol. 2013 Jan;44(1):77–86. doi: 10.1016/j.humpath.2011.10.028. [DOI] [PubMed] [Google Scholar]
- 66.Georgiou GK, Igglezou M, Sainis I, Vareli K, Batsis H, Briasoulis E, et al. Impact of breast cancer surgery on angiogenesis circulating biomarkers: a prospective longitudinal study. World J Surg Oncol. 2013 Aug 27;11(1):213. doi: 10.1186/1477-7819-11-213. Epub 2013/08/29. eng. [DOI] [PMC free article] [PubMed] [Google Scholar]
- 67.Jedeszko C, Sloane BF. Cysteine cathepsins in human cancer. Biol Chem. 2004 Nov;385(11):1017–27. doi: 10.1515/BC.2004.132. [DOI] [PubMed] [Google Scholar]
- 68.Ozawa K, Tsukamoto Y, Hori O, Kitao Y, Yanagi H, Stern DM, et al. Regulation of tumor angiogenesis by oxygen-regulated protein 150, an inducible endoplasmic reticulum chaperone. Cancer Res. 2001 May 15;61(10):4206–13. Epub 2001/05/19. eng. [PubMed] [Google Scholar]
- 69.Stojadinovic A, Hooke JA, Shriver CD, Nissan A, Kovatich AJ, Kao TC, et al. HYOU1/Orp150 expression in breast cancer. Med Sci Monit. 2007 Nov;13(11):BR231–9. Epub 2007/10/31. eng. [PubMed] [Google Scholar]
- 70.Tsukamoto Y, Kuwabara K, Hirota S, Kawano K, Yoshikawa K, Ozawa K, et al. Expression of the 150-kd oxygen-regulated protein in human breast cancer. Lab Invest. 1998 Jun;78(6):699–706. Epub 1998/06/30. eng. [PubMed] [Google Scholar]
- 71.Lonne GK, Cornmark L, Zahirovic IO, Landberg G, Jirstrom K, Larsson C. PKCalpha expression is a marker for breast cancer aggressiveness. Molecular cancer. 2010;9:76. doi: 10.1186/1476-4598-9-76. Epub 2010/04/20. eng. [DOI] [PMC free article] [PubMed] [Google Scholar]
- 72.Jevnikar Z, Rojnik M, Jamnik P, Doljak B, Fonovic UP, Kos J. Cathepsin H mediates the processing of talin and regulates migration of prostate cancer cells. J Biol Chem. 2013 Jan 25;288(4):2201–9. doi: 10.1074/jbc.M112.436394. [DOI] [PMC free article] [PubMed] [Google Scholar]
- 73.Lawson C, Lim ST, Uryu S, Chen XL, Calderwood DA, Schlaepfer DD. FAK promotes recruitment of talin to nascent adhesions to control cell motility. J Cell Biol. 2012 Jan 23;196(2):223–32. doi: 10.1083/jcb.201108078. [DOI] [PMC free article] [PubMed] [Google Scholar]