

Abstract
Ferritin is a naturally occurring iron storage protein, proposed as a clinically relevant nanoparticle with applications as a diagnostic and therapeutic agent. Cationic ferritin is a targeted, injectable contrast agent to measure kidney microstructure with MRI. Here, the toxicity of horse spleen ferritin is assessed as a step to clinical translation. Adult male mice received cationic, native and high dose cationic ferritin (CF, NF, or HDCF) or saline and were monitored for 3 weeks. Transient weight loss occurred in the ferritin groups with no difference in renal function parameters. Ferritin-injected mice demonstrated a lower serum iron 3 weeks after administration. In ferritin-injected animals pre-treated with hydrocortisone, there were no structural or weight differences in the kidneys, liver, lung, heart, or spleen. This study demonstrates a lack of significant detrimental effects of horse-derived ferritin-based nanoparticles at MRI-detectable doses, allowing further exploration of these agents in basic research and clinical diagnostics.
Keywords: Ferritin, magnetic resonance imaging, toxicity, nephron number, kidney, cationic ferritin
Graphical abstract
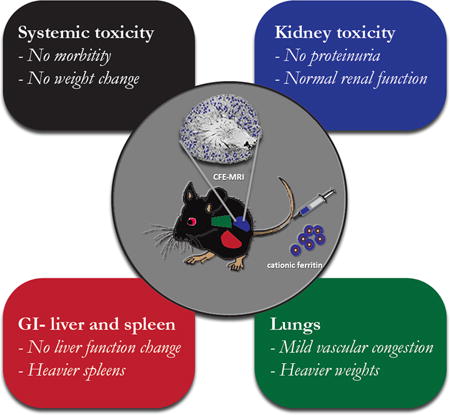
Cationic ferritin injected systemically into adult male mice transiently adheres to the glomerular basement membrane and can be noninvasively detected by MRI to count glomeruli and measure morphology as depicted in the inner circle. The outer boxes represent the areas of potential toxicity of either cationic or native ferritin assessed in this study, including kidney effects such as disruption of the glomerular basement membrane in the kidney, iron toxicity in liver and spleen, and the adverse effects of a large horse protein such as inflammation.
BACKGROUND
Molecular imaging is a growing field of research aimed at characterizing the location and function of molecules in living tissue. Optical molecular imaging is limited to light penetration depths of ~1 cm. To overcome these limitations, radiological techniques have emerged to localize molecular interactions with whole body penetration in humans. Magnetic resonance imaging (MRI) is a versatile radiological technique that provides soft-tissue contrast and 3D detection of microstructure in vivo. Much work has been done to develop sensitive MRI contrast agents for targeted delivery. Unfortunately, few MRI contrast agents are used clinically, largely due to translational hurdles such as toxicity. For diagnostic molecules in particular, the potential risk of toxicity necessitates a conservative approach to preclinical testing (1–3). Nonetheless, there is great interest in new diagnostic drugs to enhance patient outcomes.
Several groups have proposed “natural” contrast agents, based on biologically-derived materials, that can be adapted for molecular MRI (4–8)and therapy (9). Ferritin is attractive as a natural nanoparticle contrast agent. Ferritin is a highly conserved 450 kDa protein involved in iron storage, made of 24 subunits with heavy (H-chains) and light (L-chains) chains that vary in composition (10). “Magnetoferritin” can also be formed as an MRI contrast agent (11), and magnetic resonance of magnetoferritin was proposed by Bulte (12–14). Human recombinant ferritin has been developed as a T2- and T2*-shortening contrast agent (7), and ferritin is proposed as a gene reporter for MRI (15,16). Ferritin is emerging as a candidate nanoparticle contrast agent with numerous potential preclinical and clinical applications in drug delivery and imaging (17,18).
Horse spleen ferritin, functionalized with a positive surface charge, (cationic ferritin, CF), has been used as a contrast agent to investigate tissue microstructure and pathology with MRI (19–23). CF binds to anionic glycoasminoglycans in the renal glomerular basement membrane (GBM) and elsewhere in the body after intravenous injection. CF was originally developed as a tracer for electron microscopy. CF has enabled visualization of the kidney GBM in rodents and humans using MRI (19,20,23), allowing the first whole-organ assessment of renal glomerular structure. CF accumulation, alone or with other agents, may also be used to measure renal function at the single-nephron level (24,25). MRI enhanced by CF (CFE-MRI) provides an opportunity to noninvasively monitor patients at risk for chronic kidney disease, determine risk for cardiovascular and kidney disease, improve transplant assessment, and determine the renal effects of new therapies. For ferritin to become generally useful it must be evaluated for kidney or systemic toxicity.
There have been few animal studies of the long-term effects or potential toxicity of systemically delivered ferritin nanoparticles (20,26,27). The aim of this study was to examine the toxicity of systemically delivered cationic and native ferritin in mice, as a step toward developing ferritin as a generally useful contrast agent and nanoparticle delivery system. We report a comprehensive, subacute preclinical safety profile of CF and NF nanoparticles, at a doses both effective and above that required for molecular MRI.
METHODS
Animals
Animal experiments were approved by the University of Virginia (UVa) and Arizona State University Institutional Animal Care and Use Committees and performed in accordance with the NIH Guide for the Care and Use of Laboratory Animals. C57Bl/6 males at 6–8 weeks of age were purchased from Charles River Laboratories (Wilmington, MA) or bred at UVa. Mice were housed in barrier cages with free access to standard chow and water.
Cationic ferritin (CF) and native ferritin (NF) were purchased from Sigma Aldrich (St. Louis, MO). NF and CF have been fully characterized for protein, metal and charge (13,22,28). NF and CF using the Danon method (29) have an MRI relaxivity of ~5mM−1sec−1 iron and have an average iron ferrihydride core size of 1500 atoms (30). A dose of 5.75 mg/100 g body weight of CF has been administered label rat glomeruli for MRI (19,20) with no observed toxicity (27). We used the same dose of CF in two injections separated by 90 minutes for this study. NF was also administered at 5.75 mg/100 g body weight and high dose CF was 11.5 mg/100 g body weight). The control group received 0.9% sodium chloride (saline). Solutions were diluted to 20 μl/g body weight. Mice were anesthetized with methoxyflurane during injections.
Three weeks following injections of CF, NF, HDCF or saline, mice were euthanized by intraperitoneal injection of pentobarbital sodium-phenytoin sodium (Euthasol, Virbac, Fort Worth, TX), followed by intracardiac blood collection. A comprehensive metabolic panel, iron, and blood count were obtained for each animal using the UVa Medical Laboratory. Kidneys, spleen, liver, and lungs were collected.
MRI
We performed MRI on CF-labeled mouse kidneys to confirm detection with MRI. Kidneys were perfused saline followed by formalin. Six kidneys were imaged in PBS with a Bruker 7T/30 MRI (Billerica, MA), (Gradient-recalled echo Fast Low Angle Shot acquisition, TE/TR = 20/40 ms, resolution = 41 × 41 × 39 μm,), and three kidneys were also imaged with a 19T (800 MHz) NMR (Agilent Technologies, Santa Clara, CA) equipped with a 3-axis probe (DOTY Scientific, Columbia, SC), (Gradient echo acquisition, TE/TR = 8/60 ms, resolution = 34 × 34 × 54 μm). Images were processed in Matlab (The Mathworks Inc, Natick, MA. USA).
Weight and urine assessment
Body weight was recorded before injection, on days 1, 2–3, and 6 after injection, and then weekly over 3 weeks. Urine was collected by isolating the animal in a clean plastic container and protein concentration was measured by modified Bradford assay. Urine creatinine was measured with the DetectX™ Creatinine Urinary Detection Kit (Arbor Assays, Ann Arbor, MI).
Histologic assessment of organs
The kidney, liver, lung, and spleen were investigated to assess tissue microstructure, nanoparticle distribution, iron distribution, and oxidant injury after injection. Each organ was immersion fixed with 10% phosphate buffered formalin. Structure was assessed with hematoxylin and eosin (H&E). Iron was detected using Perls’ Prussian blue stain. Oxidative injury, macrophage infiltration, and ferritin distribution were assessed with immunohistochemistry (IHC). For IHC, tissue sections were submersed in H2O2 in methanol to quench endogenous peroxidase. Endogenous biotin was neutralized using an avidin-biotin (ABC) blocking kit (Vector Laboratories, Burlingame, CA). Oxidative stress was localized with 4-hydroxynonenal (4HNE) antibody (ab485606, Abcam, Cambridge, MA) at 1:2,000 dilution. Macrophages were identified using F4/80 antibody (ab6640, Abcam, Cambridge, MA). Ferritin was detected using immunofluorescence with antigen retrieval using 10mM citrate buffer, serum-free protein block (DAKO, Carpinteria, CA), anti-horse spleen ferritin primary antibody at 1:100 (F6136, Sigma Aldrich, St. Louis, MO), and donkey anti-rabbit secondary antibody at 1:500 (Life Technologies, Grand Island, NY). Sections were counterstained with 4′,6- Diamidino-2-Phenylindole, Dilactate (DAPI).
Non-heme iron assessment
Kidney and liver samples were weighed, diced and incubated in 3M HCl/0.61M trichloroacetic acid at 65°C for 20 hours. The suspended tissue was cooled and centrifuged at 12,000 rpm. The supernatant was collected and combined with a chromogen solution (1.86mM bathophenanthroline sulfonate/143 mM thioglycollic acid) for 20 minutes and optic density (OD) was read at 535 nm. An iron standard solution (Ricca Iron AA standard) was generated each time. Non-heme iron (μg/g) was calculated (31).
Retro-orbital injections
In a second cohort of adult male C57Bl/6 mice, CF was prepared in house per Danon (29), purified by dialysis. 5.75 mg/100 g body weight of the CF or NF was administered in two injections to the retro-orbital (RO) venous plexus (32) separated by 90 minutes. We used 0.9% sodium chloride for controls. HDCF was not included as 150 μl is the maximum volume tolerated and concentrated samples caused mortality. Mice were sedated for injections with isofluorane. Mice were monitored for three weeks with body weight and urine analyses. The monitoring, urine collection, and euthanasia of the animals is described above.
Hydrocortisone administration
To address the concern of possible immunologic reaction to the horse ferritin in mice, a cohort of C57Bl/6 adult male mice were given an intra-muscular injection of hydrocortisone followed by two intravenous injections of saline, CF, NF or HDCF separated by 90 minutes at the doses described above (n=5 per group). They also received 10 μl/kg of saline subcutaneously. Monitoring, urine collection, and euthanasia was previously described.
Statistics
Continuous variables were compared using the Mann Whitney U test with the ferritin-injected groups (CF, NF, or HDCCF) compared to the saline group. Two-way ANOVA was used to compare body weight and protein excretion. A two-sided significance level of 0.05 was set for all tests. Statistical analyses were performed using GraphPad Prism version 6.00 for Windows (GraphPad Software. La Jolla, California, USA).
RESULTS
As shown in Figure 1A, CF-labeled glomeruli appeared as hypointense spots throughout the cortex of the kidney using 19T MRI. Saline-injected mouse kidneys were unlabeled (Figure 1B). Glomeruli were identified as published (19,20,23,33).
Figure 1. Intravenous cationic ferritin is detected in perfused, fixed mouse kidney with gradient-recalled echo MRI.
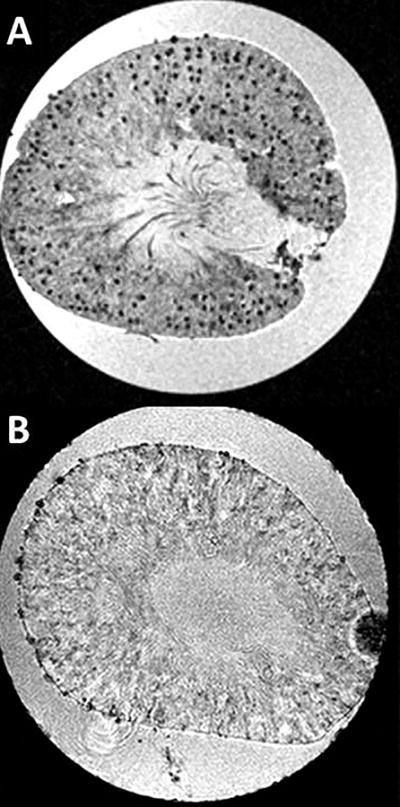
Slices from the 3D MRI dataset are shown (19T, GRE-MRI, TE/TR = 8/60 ms, resolution = 34 × 34 × 54 μm). A-Mouse kidney with individual glomeruli labeled due to the accumulation of intravenous CF in the GBM. Glomeruli are visible as punctate dark spots. B- Unlabeled control kidneys are clear of contrast and glomeruli are not visible in MRI.
Weights
All ferritin-injected mice lost weight compared to saline-injected controls (Figure 2A). CF-injected group lost on average 1.06 g (CI: 0.08 to 2.04 g) on day 1 and 1.52 g (CI: 0.55 to 2.50 g) by day 2–3. By week 1 the CF-injected animals had reached the weights of the saline groups (mean difference: 0.31 g, (−0.06 to 1.30)). NF-injected mice lost weight on day 1 (mean weight change: −1.90, −1.03 to −2.92), with positive weight gain on day 2–3 (mean weight change: −1.40, (−0.5 to −2.4)), and returned to the level of controls by week 1 (mean weight change: 0.51 (−0.47 to 1.50). The HDCF-injected group lost weight on day 1 compared to controls (mean weight change: − 2.13 g (1.15 to 3.11). They gained weight by day 2 and reached the weight of controls by week 2 (mean weight change: 0.19 (−0.76 to 1.14)).
Figure 2. Body weight and protein excretion of mice receiving CF, NF, HDCF or saline.
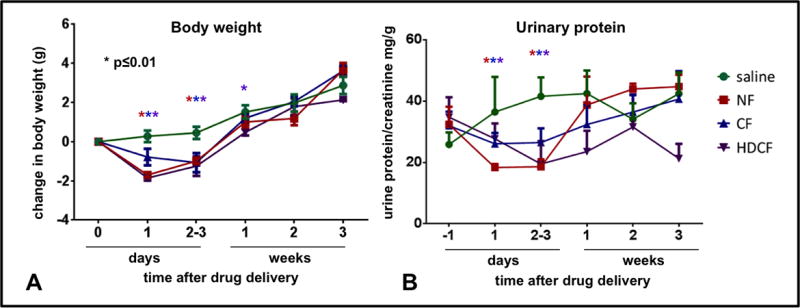
A-Body weights of mice are depicted as change from baseline (in grams). The CF-injected group (blue) lost significant weight on day 1 compared to the saline group. The NF-injected group lost weight the day after injection but regained weight by 2–3 days and is above baseline and no different than the saline-injected group by 1 week. The HDCF-injected group returned to baseline by 1 week and by week 2 there was no difference between HDCF-injected and the saline group. B-None of the ferritin-injected groups had higher protein excretion than the saline-injected group over the 3 week study period.
Urine and serum biomarkers
All mice had similar urinary protein/creatinine (UPC) before injection (Figure 2B). UPC in the ferritin-injected groups did not exceed that of saline-injected controls during the study.
Blood was collected at euthanasia to assess renal function, iron concentration, hematologic parameters and liver function (Figure 3). Renal function, reflected by serum creatinine and BUN, was no different between the ferritin-injected groups and saline-injected controls. The median creatinine for all groups, including the saline-injected controls, was 0.4 mg/dl (NF: U: 32, p=0.80; CF: U: 31, p=0.35; HDCF: U: 18, p=0.47). The median BUN of the CF-injected group and controls was 23 mg/dl (U: 30, p=0.90) and there was no difference between the NF-(median: 21 mg/dl, U: 24, p=0.67) or HDCF-injected mice (median 27.5 mg/dl, U: 10, p=0.13) and controls. All ferritin-injected groups (NF, CF, and HDCF) had a significantly lower serum iron compared to controls (saline median: 197 U/L; NF median: 104.5 U/L (47% lower than saline); CF median: 115 U/L, (42% lower); and HDCF median: 114 U/L (43% lower); p for all groups <0.0003)).
Figure 3. Hematologic parameters following ferritin-injections.
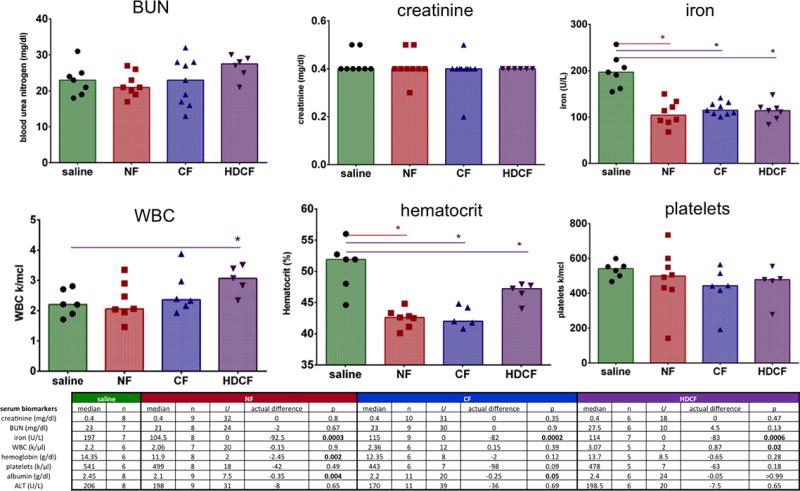
There was no difference in serum creatinine or BUN. The serum iron level was significantly lower in all ferritin-injected groups. HDCF-injected mice had a higher WBC count. Hematocrit was significantly lower in ferritin-injected mice. There was no difference in the platelet count of ferritin-injected mice.
A blood panel, including white blood cell count (WBC), hemoglobin, and platelets, was performed to detect iron toxicity or evidence of an immunologic reaction. WBC concentration was significantly higher in the HDCF-injected mice (HDCF median: 3.07 k/μl, saline median: 2.20 k/μl; U: 2.0, p=0.02). There was no difference in WBC level between the CF-injected groups (CF median: 2.36 k/μl; U: 12, p=0.39) or NF-injected group (NF median: 2.06 k/μl U: 20, p=0.90) compared to controls (Figure 3). There was a lower hematocrit of all the ferritin-inject mice (saline: 51.9%; NF: 42.6%, U: −9.2, p=0.002; CF: 42.0%, U: −9.9, p=0.009; HDCF: 47.2%, U: −4.7, p=0.05). The mean corpuscular volume (MCV) was lower in the NF-injected mice compared to saline controls (saline: median 53.55 fL; CF: median: 52.6 fL, U: 4, p=0.05; NF: 52.2 fL, U: 1.5, p=0.003). There was no difference in platelet concentration between the ferritin-injected groups and controls (saline median: 541 k/ μl; NF median: 499 k/ μl, U: 18, p=0.49; CF median: 443 k/ μl, U: 7, p=0.09; HDCF median: 478 k/ μl; U: 24, p=0.65).
Both NF- and CF- injected groups had lower serum albumin (NF median: 2.1 g/dl (U:7.5, p=0.004) and CF median: 2.2 g/dl (U:20.0, p=0.05)) compared to controls (saline median: 2.45 g/dl). Albumin level in the HDCF group was not significantly different than controls (HDCF median: 2.4 g/dl, U:24.0, p>0.99). AST was not examined due to sporadic iatrogenic hemolysis. There was no difference in ALT between the ferritin-injected groups (CF median: 170 U/L, U: 39.0, p=0.69; NF median: 198 U/L, U: 31.0, p=0.69, HDCF median: 198.5 U/L, U: 20.0, p=0.65) and saline-injected controls (median: 206 U/L), (Figure 3).
Gross organ assessment
The weights of kidneys, liver, spleen and lungs were measured in mice receiving IV injections (Figure S1). There was no significant difference in weight of the kidneys or the livers of the CF-, NF-, or HDCF-injected mice compared to controls. Spleens of the CF- and NF- injected groups were significantly heavier (CF median: 99.0 mg, U: 12.5, p=0.02; NF median: 115.8 mg U: 0, p=0.0002) than controls (median: 70.5 mg). Interesting the HDCF group did not have heavier spleens than the saline controls (median: 78 mg, U: 29.5, p=0.82). The median weight of CF-injected lungs was greater than in the saline group (CF median: 45.0 mg, saline median: 40 mg, U: 0, p<0.0001). When normalized to body weight, the lungs of the CF- and HCDF-injected groups were significantly heavier than controls (CF median: 1.8 mg/g, U: 6.0, p=0.002; HDCF: median: 1.8 mg/g, U: 4.0, p=0.002, saline median: 1.55 mg/g)
Non-heme iron content
There was no difference in kidney or liver iron content within experimental groups compared to controls. However, liver iron in the HDCF-injected group was higher than in controls (U: 69.10 μg/g, p=0.03), Figure S2.
Histologic organ assessment
The structure, content of iron and ferritin, macrophage infiltration and oxidant injury were assessed in the kidney, liver, lung and spleen in each group three weeks after administration.
Kidney
The kidneys appeared structurally normal in H&E sections. Iron was rarely observed in glomerular capillaries of only HDCF-injected mice (Figure 4), but this was sporadic. There was no evidence of macrophage infiltration or oxidant injury in mice receiving CF, NF or HDCF. Ferritin was present in tubules of HDCF-injected mice (Figure S3).
Figure 4. Iron deposition in the kidney, lung, and spleen.

As detected by Perl stain, iron was never seen in kidneys or lungs of the saline-(A, E), NF-(B, F) or CF-(C, G) injected groups. Iron was occasionally detected in the glomeruli of the kidneys (D) or in the interstitium in the lungs (H) of the HDCF-injected group. Iron was detectable in the red pulp of the spleen in higher concentration in NF-(J) and CF-(K) injected mice compared to saline controls. Iron was more densely deposited in the HDCF-injected mice (H-arrows).
Liver
There was no structural difference in the H&E sections of the liver. Iron was sporadically detected in the HDCF-injected mice that co-localized with macrophages. There was a slight increase in non-mobile macrophages in the liver of ferritin-injected mice, but no evidence of oxidant injury in the livers of mice receiving CF and a slight increase in oxidant stress in NF and HDCF (Figure 5). Ferritin was detectable in livers of all of the ferritin-injected groups.
Figure 5. Oxidative stress in spleen and liver.

4-HNE was used to detect oxidative stress. There was evidence of stress in the spleen co-localized to iron deposition in the red pulp. Although not seen in the CF-injected livers, there was evidence of mild oxidative stress in livers of NF- and HDCF-injected mice which remained present in the steroid treated group (steroid pretreatment group shown).
Lung
The lungs of mice receiving CF had evidence of mild alveolar and vascular congestion, but no pulmonary edema. Vascular congestion was more pronounced in lungs of the CF group, which were heavier than controls. Lungs of the CF animals had no iron deposition, macrophage infiltration, or evidence of oxidant injury. Iron was rarely observed in sporadic patches in the interstitium of lungs of the HDCF groups (Figure 4). Non-specific fluorescence was seen in the bronchioles of all groups, including the saline group.
Spleen
There was no structural difference or evidence of oxidant injury in the spleens of CF-injected mice. In all groups receiving ferritin, iron accumulated in the red pulp of the spleen with a similar pattern of macrophage infiltration (Figure 4). Ferritin was not detected in spleens of any animals. There was evidence of mild oxidative stress in all ferritin-injected mice, largely in the red pulp that corresponded to areas of iron deposition (Figure 5).
Retro-orbital Injections
CF, NF and saline were administered into the retro-orbital (RO) venous plexus. Labeling of CF was confirmed with MRI. Mice receiving RO-CF and RO-NF lost weight by day 1 (CF difference: 2.38 g, p<0.0001; NF difference: 1.67 g, p<0.0001) compared to controls. The CF group regained weight quickly and by 2–3 days weighted the same as saline controls (CF difference: 0.56 g, p=0.39), (Figure S4). The NF group gained weight over the study period, but weighed less than controls until day 13 (NF difference: 0.86 g, p=0.09). There was no difference in UPC or serum creatinine and BUN between CF- or NF-injected groups compared to controls (Figure S4). Serum iron concentration was lower in the NF-injected group (NF median: 127 U/L, U: 1, p=0.02) and trended lower in the CF-injected group (CF median: 116 U/L, U: 2, p=0.06) compared to controls (saline median: 203 U/L). There was no detectable difference in the WBC, platelets or albumin concentration in RO-injected CF or NF groups compared to controls. As with the IV-injected NF group, the RO-injected NF group had lower hemoglobin (NF median: 13.25 g/dl, U: 6, p=0.04) than controls (saline median: 14.5 g/dl) with no difference between the RO CF group (CF median: 14.1 g/dl, U: 8, p=0.39) and controls. In contrast to the IV-injected group, the RO-injected CF group had a lower ALT (CF median: 29.5 U/L, U: 27.5, p=0.01) compared to controls (saline median: 32 U/L).
Structure (H&E), accumulation of iron (Perl) and ferritin (IF), macrophage infiltration (F4/80) and oxidant stress (4HNE) were assessed in kidney, liver, lung, and spleen of RO-injected groups. There were no structural abnormalities or significant difference in macrophage infiltration noted in kidney, liver or lungs of any of the RO-injected groups. The lungs of the NF group exhibited mild edema, but the CF group did not. Iron was detected in the spleen within the red pulp of all of the ferritin-injected mice. There was mild evidence of oxidant stress in both the spleen and liver of the ferritin-injected mice.
Hydrocortisone group
Two mice treated with hydrocortisone before ferritin administration had overt organ abnormalities at euthanasia. First, moderate hydronephrosis of the left kidney was noted in one of the saline control mice. This animal is highlighted as a yellow circle in Figure 6, but removed from analyses. Secondly, an enlarged heart and lungs were observed in a CF-injected mouse. This animal is highlighted in Figure 6 as a yellow triangle, and remained in all analyses.
Figure 6. Hydrocortisone pretreatment group.

A-Body weight: Significant weight loss occurred in ferritin-injected mice on day 1 after injection, but by day 2 all groups gained weight. All ferritin groups were back to baseline within one week. B-Hematologic parameters: There was no difference in hematocrit or albumin between any ferritin-injected and saline groups. The NF-injected group had a statistically higher WBC than saline controls. C-Organ Weight: There was no difference in lung, spleen, or heart weight normalized to body weight in any ferritin-injected group compared to saline controls.
All ferritin-injected groups lost weight on the day following the injection (median: CF:−0.5 g, NF: −2.8 g, HDCF: −2.0). By day 2, all ferritin-injected groups had gained weight. Although no groups reached the weights of the saline animals through the three weeks, all groups had a positive and similar weight gain velocity after the initial weight loss noted on day 1. The saline group pretreated with steroids gained 5.6 ± 1.0 g compared to the saline group without steroids that gained 2.9 ± 1.1 g of body weight over three weeks. There was no difference in hematocrits of ferritin-injected mice. (median: saline: 49%, NF: 44.8%, U: −4.2%, p=0.25; CF: 47.6%, U: −1.4%, p=0.75; HDCF: 43.9%, U: −5.1, p=0.29). There was no difference in WBC of the CF mice, but the WBC concentration in the NF was mildly elevated (median saline: 2.02 k/mcl, NF: 3.04 k/mcl, U: 1.0 k/mcl, p=0.04), but this elevation was not seen in the group without steroid pretreatment. There was no difference in albumin concentration between the saline and ferritin-injected groups (median: saline: 2.2 g/dl; CF: 2.4 g/dl, NF: 2.4 g/dl, HDCF: 2.6 g/dl). Organ weights were normalized to body weight as previously described. With the addition of the hydrocortisone, no difference was seen in weights of the kidneys, spleen, liver, lung or the hearts (Figure 6). The majority of inflammatory markers improved with hydrocortisone administration, but mild oxidative stress remained in livers of NF- and HDCF-injected mice and spleens of all ferritin-injected animals. The results are summarized in Table 1.
Table 1.
Summary of experimental results
| MEASUREMENT | NF | CF | HDCF | abrogated by steroids? | ||||||||
|---|---|---|---|---|---|---|---|---|---|---|---|---|
| body and organ weight | ||||||||||||
| body weight | transient decrease, back to baseline at 1 wk | transient decrease, back to baseline at 1 wk | transient decrease, back to baseline at 2 wk | no, increased in controls | ||||||||
| kidney weight | no difference | no difference | no difference | n/a | ||||||||
| lung weight | no difference | increased | increased | yes | ||||||||
| liver weight | no difference | no difference | no difference | n/a | ||||||||
| spleen weight | increased | increased | increased | yes | ||||||||
| urinary and blood markers | ||||||||||||
| kidney panel | no difference | no difference | no difference | n/a | ||||||||
| liver panel | albumin decreased | albumin decreased | no difference | yes, no difference in albumin | ||||||||
| iron | decreased | decreased | decreased | no change | ||||||||
| hematocrit | decreased | decreased | decreased | yes | ||||||||
| WBC | no difference | no difference | increased | increased in NF | ||||||||
| urinary protein | not increased | not increased | not increased | n/a | ||||||||
| histology | ferritin | iron | 4HNE | ferritin | iron | 4HNE | ferritin | iron | 4HNE | ferritin | iron | 4HNE |
| kidney | no | no | no | no | no | no | yes, tubules | rare | no | no | no | no |
| lung | no | no | no | no | no | no | no | rare | mild | no | no | no |
| liver | yes | rare | yes, mild | yes | rare | yes, mild | yes | yes | yes, mod | no | no | no |
| spleen | no | yes | yes, mild | no | yes | yes, mild | no | yes, mod | yes, mild | no | no | no |
DISCUSSION
This is the first study to evaluate the potential for kidney and systemic toxicity of cationic and native ferritin in mice, using an intravenous dose detectable by MRI. Ferritin has several theoretic advantages as a nanoparticle contrast agent. CF is a unique tool to investigate renal morphology, but as commercially available ferritin is horse derived, considerations such as safety and biocompatibility are critical to clinical translation. Kubosawa indicated potential toxicity in rats after delivery of CF into the renal artery (34), but this is difficult to interpret without appropriate controls or accounting for variable renal ischemia. Besides the Kubosawa study, there is very limited information on which to construct comprehensive maximum tolerated dose (MTD) studies of horse derived ferritin-based nanoparticles. Therefore, our first objective in evaluating the biocompatibility and safety of systemically administered ferritin was to determine if it resulted in a functional change in the GBM, iron injury, or immune reactions focusing first on the dose effective for MRI.
Lack of glomerular dysfunction
There was no evidence of filtration barrier disruption, change in renal function, or histologic changes within the kidney during the 3-week study after CF administration. No changes were detected in urinary protein in any of the ferritin groups (CF, NF, or HDCF). These results differ from those of Batsford, where rabbits given CF in single injections at various doses (up to 10 mg/100 g body weight) developed nephrotic range proteinuria at day 6±3 with no immune complexes (26). The lack of proteinuria in our study may reflect differences in dosing strategy or by a species-specific difference in immune response. CF did not affect renal function in the mice as evidenced by no difference in serum creatinine, urea, or kidney weights, and no histologic evidence of damage in the kidneys of the CF-injected mice compared to controls.
Lack of direct iron injury
Unexpectedly, serum iron levels of all ferritin-injected mice were ~40% lower than in saline controls. Reduced serum iron was observed with both retro-orbital delivery and hydrocortisone in groups receiving ferritin. Hemoglobin was significantly lower in the NF-injected group than in controls, with lower mean corpuscular volumes (MCV); a finding eliminated by pretreatment with hydrocortisone. Further investigations should determine if exogenous ferritin could have a therapeutic role in serum iron reduction.
Each organ was examined for iron and ferritin. Literature suggests liver and spleen are primary locations (35–37) of lysosomal degradation, releasing iron and disassembling ferritin within cells (38). We observed mild oxidative stress in livers of NF- and HDCF-injected mice and in spleens of all ferritin-injected mice. Nonetheless, there was no difference in liver markers such as ALT or weights of these organs, and the WBC was variably elevated (no steroid: HDCF was higher than saline, steroid pretreatment: NF was higher than saline). Although there was a lower serum albumin concentration in the CF-injected group compared to controls, this difference (0.25 g/dl) may not be clinically relevant and was abrogated by pretreatment with hydrocortisone. Ferritin was detected in the livers from the CF-, NF-, and HDCF- injected groups, consistent with findings of others (27). In liver histology there appeared to be less iron than predicted by the amount of ferritin detected in IHC. Iron in the HDCF group appeared localized to Kupffer cells. Spleens of ferritin-injected mice had more iron but no detectable ferritin. Injected ferritin may be degraded in the liver while the constituent iron is transported to the spleen for storage by macrophages. Alternatively, ferritin degradation may be more efficient in the spleen, leaving only the iron byproduct after 3 weeks. Our study did not examine mechanisms of ferritin-iron trafficking. In contrast to non-targeted MRI contrast agents, which require a long lifetime in circulation to serve as blood-pool agents, the short half-life and rapid degradation of ferritin is advantageous for targeted imaging because it quickly creates contrast between the targeted site and the blood.
Adverse reaction to large horse ferritin antigen
Animal weights were monitored as an overall measure of health. Despite initial weight loss, all ferritin-injected mice had gained weight after day 2 and all ferritin-injected mice returned to baseline weight within the first week. In the CF group without pretreatment of hydrocortisone, weight returned to baseline within a week and returned to baseline weight by day 2 after injection in the pretreated group and the CF-injected group. Although the mice that did not receive hydrocortisone achieved the weight of the saline controls, those receiving steroids did not catch up to the saline controls receiving steroids. This may reflect the higher average weight gain of the saline mice with steroids (5.6 g) compared to the 2.9 g of weight gain in the saline mice without steroids.
To our knowledge, no previous studies have reported animal weights after ferritin administration. In 1983, Cohen investigated male Sprague-Dawley rats receiving a single injection of 10 mg/100 g body weight of CF or NF, observed for 72 hours. All but one tolerated the slow administration of ferritin. NF rats had significantly higher blood pressure (BP) for 72 hours after injection (pre-injection: 103.6 +/−4 mmHg, 72 hrs: 114.2 +/−10.3 mmHg), whereas BP of the CF group remained elevated for 48 hours then was no different than the pre-injection BP (pre-injection: 104.9 +/−6 mmHg, post-injection: 111.2 +/−10.7, 48 hrs: 115.2 +/−9.4 mmHg). The same study reported the half-life of NF was 6 hours and undetectable at 24 hours. The half-life of the CF was nearly 12 hours and at 0.2 mg/ml by 72 hours (37). Our observed transient weight loss could have many possible causes, such as altered concentrating ability, decreased water intake, or systemic inflammation. Alternatively, the increased BP seen in the Cohen study, along with the weight loss observed here, could indicate ferritin acts as an osmotic diuretic, where systemic BP rises after administration and induces diuresis. These mechanisms require further study.
Lung histology was assessed because others reported pulmonary hemorrhage in rabbits (26). We have observed pulmonary hemorrhage in mice using CF in a single, large intravenous bolus (unpublished). Mice in the current experiments were monitored closely for development of tachypnea, dyspnea, or hemoptysis. Three of nine mice in the CF group and two of seven in the HDCF group had lungs weighing more than controls. There was sporadic vascular congestion containing no iron or ferritin, possibly explaining the weight difference. Iron was only occasionally seen in the interstitium of the lungs in the HDCF-injected groups. In the group pre-treated with hydrocortisone, lungs had none of the above histologic findings and there was no difference in lung weights normalized to body weight.
Although there was no evidence of vascular congestion in the spleens of the ferritin groups, the median weights were higher than for saline controls. Histologically, there was an increase in iron, mild oxidative stress, but no difference in macrophage content. Higher WBC count in HDCF animals and lower albumin suggested inflammation. Pretreatment with hydrocortisone resulted in no difference in albumin levels of the ferritin-injected groups compared to the saline group. There was a significantly higher WBC in the NF group, but the count was still within the normal range for a C57Bl/6 adult male mouse (8.91 ± 2.5 k/mcl). Clinically, steroid pretreatment is common, particularly when humans receive horse-derived products. While our findings do not indicate significant detrimental effects of ferritin, a recombinant, species-specific ferritin may be important for survival experiments requiring repeated dosing.
Significant RO findings
Serum iron concentration was lower in the NF-injected groups and trended lower in the CF group (p=0.06). Hemoglobin was lower in the NF-injected group, but not in the CF-injected group.
In summary, ferritin-based nanoparticles, administered intravenously at a dose used for targeted molecular imaging with MRI, do not cause short-term morbidity or mortality, disruption of the glomerular basement filtration barrier, or reduction in renal function in mice. Evidence of systemic inflammation including a reduction of albumin, increased WBC, heavier lungs and spleens were eliminated by pretreatment with hydrocortisone. Although maximum tolerated dose (MTD) was not assessed in these studies, the findings presented here are reassuring to explore the MTD of horse-derived ferritin in future studies, advancing the development of CF for basic research and clinical diagnostics.
Supplementary Material
Acknowledgments
FINANCIAL SUPPORT:
This work was funded by grants from The Hartwell Foundation (JRC) and NIH DK-091722 (KMB).
Special thanks to the ACUC staff at the University of Virginia, particularly Jeremy Gatesman.
Abbreviations
- 4-HNE
4-hydroxynoneal
- BUN
blood urea nitrogen
- BP
blood pressure
- CF
cationic ferritin
- GBM
glomerular basement membrane
- H&E
hematoxylin and eosin
- HO-1
heme oxygenase-1
- HDCF
high dose cationic ferritin
- IHC
immunohistochemistry
- MRI
magnetic resonance image
- MTD
maximum tolerated dose
- MCV
mean corpuscular volume
- NF
native ferritin
- RO
retro-orbital
- UPC
urine protein/creatinine
- WBC
white blood cell
Footnotes
CONFLICTS, DECLARATIONS OF INTEREST
The authors have no financial, consulting or personal relationships with other people or organizations that could influence this work. KMB is the founder of NanoDiagnostics, LLC.
Publisher's Disclaimer: This is a PDF file of an unedited manuscript that has been accepted for publication. As a service to our customers we are providing this early version of the manuscript. The manuscript will undergo copyediting, typesetting, and review of the resulting proof before it is published in its final citable form. Please note that during the production process errors may be discovered which could affect the content, and all legal disclaimers that apply to the journal pertain.
Contributor Information
JR Charlton, Email: jrc6n@virginia.edu.
VM Pearl, Email: vmb3f@virginia.edu.
AR Denotti, Email: an.den@hotmail.it.
JB Lee, Email: jbl5c@virginia.edu.
S Swaminathan, Email: ss4sa@virginia.edu.
YM Scindia, Email: ys9t@virginia.edu.
NP Charlton, Email: npc8a@virginia.edu.
EJ Baldelomar, Email: ebaldelo@hawaii.edu.
SC Beeman, Email: beemans@mir.wustl.edu.
KM Bennett, Email: kevinben@hawaii.edu.
References
- 1.Aime S, Caravan P. Biodistribution of gadolinium-based contrast agents, including gadolinium deposition. J Magn Reson Imaging. 2009 Dec;30(6):1259–1267. doi: 10.1002/jmri.21969. [DOI] [PMC free article] [PubMed] [Google Scholar]
- 2.Pierre VC, Allen MJ, Caravan P. Contrast agents for MRI: 30+ years and where are we going? J Biol Inorg Chem. 2014 Feb;19(2):127–131. doi: 10.1007/s00775-013-1074-5. [DOI] [PMC free article] [PubMed] [Google Scholar]
- 3.Modo M, Kolosnjaj-Tabi J, Nicholls F, Ling W, Wilhelm C, Debarge O, et al. Considerations for the clinical use of contrast agents for cellular MRI in regenerative medicine. Contrast Media Mol Imaging. 2013 Nov-Dec;8(6):439–455. doi: 10.1002/cmmi.1547. [DOI] [PubMed] [Google Scholar]
- 4.Cormode DP, Frias JC, Ma Y, Chen W, Skajaa T, Briley-Saebo K, et al. HDL as a contrast agent for medical imaging. Clin Lipidol. 2009 Aug;4(4):493–500. doi: 10.2217/clp.09.38. [DOI] [PMC free article] [PubMed] [Google Scholar]
- 5.Cormode DP, Skajaa T, Fayad ZA, Mulder WJ. Nanotechnology in medical imaging: probe design and applications. Arterioscler Thromb Vasc Biol. 2009 Jul;29(7):992–1000. doi: 10.1161/ATVBAHA.108.165506. [DOI] [PMC free article] [PubMed] [Google Scholar]
- 6.Jasanoff A. MRI contrast agents for functional molecular imaging of brain activity. Curr Opin Neurobiol. 2007 Oct;17(5):593–600. doi: 10.1016/j.conb.2007.11.002. [DOI] [PMC free article] [PubMed] [Google Scholar]
- 7.Uchida M, Terashima M, Cunningham CH, Suzuki Y, Willits DA, Willis AF, et al. A human ferritin iron oxide nano-composite magnetic resonance contrast agent. Magn Reson Med. 2008 Nov;60(5):1073–1081. doi: 10.1002/mrm.21761. [DOI] [PubMed] [Google Scholar]
- 8.Terashima M, Uchida M, Kosuge H, Tsao PS, Young MJ, Conolly SM, et al. Human ferritin cages for imaging vascular macrophages. Biomaterials. 2011 Feb;32(5):1430–1437. doi: 10.1016/j.biomaterials.2010.09.029. [DOI] [PMC free article] [PubMed] [Google Scholar]
- 9.Choi CH, Zuckerman JE, Webster P, Davis ME. Targeting kidney mesangium by nanoparticles of defined size. Proc Natl Acad Sci U S A. 2011 Apr 19;108(16):6656–6661. doi: 10.1073/pnas.1103573108. [DOI] [PMC free article] [PubMed] [Google Scholar]
- 10.Wang W, Knovich MA, Coffman LG, Torti FM, Torti SV. Serum ferritin: Past, present and future. Biochim Biophys Acta. 2010 Aug;1800(8):760–769. doi: 10.1016/j.bbagen.2010.03.011. [DOI] [PMC free article] [PubMed] [Google Scholar]
- 11.Meldrum FC, Heywood BR, Mann S. Magnetoferritin: in vitro synthesis of a novel magnetic protein. Science. 1992 Jul 24;257(5069):522–523. doi: 10.1126/science.1636086. [DOI] [PubMed] [Google Scholar]
- 12.Bulte JW, Douglas T, Mann S, Vymazal J, Laughlin PG, Frank JA. Initial assessment of magnetoferritin biokinetics and proton relaxation enhancement in rats. Acad Radiol. 1995 Oct;2(10):871–878. doi: 10.1016/s1076-6332(05)80064-9. [DOI] [PubMed] [Google Scholar]
- 13.Bulte JW, Douglas T, Mann S, Frankel RB, Moskowitz BM, Brooks RA, et al. Magnetoferritin: characterization of a novel superparamagnetic MR contrast agent. J Magn Reson Imaging. 1994 May-Jun;4(3):497–505. doi: 10.1002/jmri.1880040343. [DOI] [PubMed] [Google Scholar]
- 14.Bulte JW, Douglas T, Mann S, Frankel RB, Moskowitz BM, Brooks RA, et al. Magnetoferritin. Biomineralization as a novel molecular approach in the design of iron-oxide-based magnetic resonance contrast agents. Invest Radiol. 1994 Jun;29(Suppl 2):S214–6. [PubMed] [Google Scholar]
- 15.Cohen B, Dafni H, Meir G, Harmelin A, Neeman M. Ferritin as an endogenous MRI reporter for noninvasive imaging of gene expression in C6 glioma tumors. Neoplasia. 2005 Feb;7(2):109–117. doi: 10.1593/neo.04436. [DOI] [PMC free article] [PubMed] [Google Scholar]
- 16.Genove G, DeMarco U, Xu H, Goins WF, Ahrens ET. A new transgene reporter for in vivo magnetic resonance imaging. Nat Med. 2005 Apr;11(4):450–454. doi: 10.1038/nm1208. [DOI] [PubMed] [Google Scholar]
- 17.Jutz G, van Rijn P, Santos Miranda B, Boker A. Ferritin: a versatile building block for bionanotechnology. Chem Rev. 2015 Feb 25;115(4):1653–1701. doi: 10.1021/cr400011b. [DOI] [PubMed] [Google Scholar]
- 18.Zhen Z, Tang W, Todd T, Xie J. Ferritins as nanoplatforms for imaging and drug delivery. Expert Opin Drug Deliv. 2014 Dec;11(12):1913–1922. doi: 10.1517/17425247.2014.941354. [DOI] [PMC free article] [PubMed] [Google Scholar]
- 19.Beeman SC, Cullen-McEwen LA, Puelles VG, Zhang M, Wu T, Baldelomar EJ, et al. MRI-based glomerular morphology and pathology in whole human kidneys. Am J Physiol Renal Physiol. 2014 Jun 1;306(11):F1381–90. doi: 10.1152/ajprenal.00092.2014. [DOI] [PMC free article] [PubMed] [Google Scholar]
- 20.Beeman SC, Zhang M, Gubhaju L, Wu T, Bertram JF, Frakes DH, et al. Measuring glomerular number and size in perfused kidneys using MRI. Am J Physiol Renal Physiol. 2011 Jun;300(6):F1454–7. doi: 10.1152/ajprenal.00044.2011. [DOI] [PubMed] [Google Scholar]
- 21.Beeman SC, Mandarino LJ, Georges JF, Bennett KM. Cationized ferritin as a magnetic resonance imaging probe to detect microstructural changes in a rat model of non-alcoholic steatohepatitis. Magn Reson Med. 2013 Feb 6; doi: 10.1002/mrm.24619. [DOI] [PMC free article] [PubMed] [Google Scholar]
- 22.Bennett KM, Zhou H, Sumner JP, Dodd SJ, Bouraoud N, Doi K, et al. MRI of the basement membrane using charged nanoparticles as contrast agents. Magn Reson Med. 2008 Sep;60(3):564–574. doi: 10.1002/mrm.21684. [DOI] [PMC free article] [PubMed] [Google Scholar]
- 23.Baldelomar EJ, Charlton JR, Beeman SC, Cullen-McEwen LA, Pearl VM, Bertram JF, et al. Phenotyping by magnetic resonance imaging nondestructively measures glomerular number and volume distribution in mice with and without nephron reduction. Kidney International. doi: 10.1038/ki.2015.316. In press. [DOI] [PMC free article] [PubMed] [Google Scholar]
- 24.Qian C, Yu X, Pothayee N, Dodd S, Bouraoud N, Star R, et al. Live nephron imaging by MRI. Am J Physiol Renal Physiol. 2014 Nov 15;307(10):F1162–8. doi: 10.1152/ajprenal.00326.2014. [DOI] [PMC free article] [PubMed] [Google Scholar]
- 25.Qian C, Yu X, Chen DY, Dodd S, Bouraoud N, Pothayee N, et al. Wireless amplified nuclear MR detector (WAND) for high-spatial-resolution MR imaging of internal organs: preclinical demonstration in a rodent model. Radiology. 2013 Jul;268(1):228–236. doi: 10.1148/radiol.13121352. [DOI] [PMC free article] [PubMed] [Google Scholar]
- 26.Batsford SR, Sasaki M, Takamiya H, Vogt A. Cationic macromolecule-induced nephrotic syndrome in rabbits. Lack of immune complex involvement. Lab Invest. 1983 Sep;49(3):260–269. [PubMed] [Google Scholar]
- 27.Beeman SC, Georges JF, Bennett KM. Toxicity, biodistribution, and ex vivo MRI detection of intravenously injected cationized ferritin. Magn Reson Med. 2012 May 8; doi: 10.1002/mrm.24301. [DOI] [PubMed] [Google Scholar]
- 28.Clavijo-Jordan V, Kodibagkar VD, Beeman SC, Hann BD, Bennett KM. Principles and emerging applications of nanomagnetic materials in medicine. Wiley Interdiscip Rev Nanomed Nanobiotechnol. 2012 Jul-Aug;4(4):345–365. doi: 10.1002/wnan.1169. [DOI] [PubMed] [Google Scholar]
- 29.Danon D, Goldstein L, Marikovsky Y, Skutelsky E. Use of cationized ferritin as a label of negative charges on cell surfaces. J Ultrastruct Res. 1972 Mar;38(5):500–510. doi: 10.1016/0022-5320(72)90087-1. [DOI] [PubMed] [Google Scholar]
- 30.Clavijo Jordan MV, Beeman SC, Baldelomar EJ, Bennett KM. Disruptive chemical doping in a ferritin-based iron oxide nanoparticle to decrease r2 and enhance detection with T1-weighted MRI. Contrast Media Mol Imaging. 2014 Sep-Oct;9(5):323–332. doi: 10.1002/cmmi.1578. [DOI] [PMC free article] [PubMed] [Google Scholar]
- 31.Scindia Y, Dey P, Thirunagari A, Liping H, Rosin DL, Floris M, et al. Hepcidin Mitigates Renal Ischemia-Reperfusion Injury by Modulating Systemic Iron Homeostasis. J Am Soc Nephrol. 2015 Mar 18; doi: 10.1681/ASN.2014101037. [DOI] [PMC free article] [PubMed] [Google Scholar]
- 32.Yardeni T, Eckhaus M, Morris HD, Huizing M, Hoogstraten-Miller S. Retro-orbital injections in mice. Lab Anim (NY) 2011 May;40(5):155–160. doi: 10.1038/laban0511-155. [DOI] [PMC free article] [PubMed] [Google Scholar]
- 33.Zhang M, Wu T, Bennett K. Small Blob Identification in Medical Images Using Regional Features from Optimum Scale. IEEE Trans Biomed Eng. 2014 Sep 25; doi: 10.1109/TBME.2014.2360154. [DOI] [PubMed] [Google Scholar]
- 34.Kubosawa H, Nakayama H, Sano T, Kondo Y. Morphological alterations of glomerulus induced by infusion of cationized ferritin. Acta Pathol Jpn. 1993 Sep;43(9):445–455. doi: 10.1111/j.1440-1827.1993.tb01157.x. [DOI] [PubMed] [Google Scholar]
- 35.Cragg SJ, Covell AM, Burch A, Owen GM, Jacobs A, Worwood M. Turnover of 131I-human spleen ferritin in plasma. Br J Haematol. 1983 Sep;55(1):83–92. doi: 10.1111/j.1365-2141.1983.tb01226.x. [DOI] [PubMed] [Google Scholar]
- 36.Covell AM, Worwood M. Turnover and tissue uptake of rabbit ferritin from rabbit plasma. Comp Biochem Physiol B. 1984;77(4):829–834. doi: 10.1016/0305-0491(84)90319-5. [DOI] [PubMed] [Google Scholar]
- 37.Cohen S, Vernier RL, Michael AF. The effect of charge on the renal distribution of ferritin. Am J Pathol. 1983 Feb;110(2):170–181. [PMC free article] [PubMed] [Google Scholar]
- 38.Kidane TZ, Sauble E, Linder MC. Release of iron from ferritin requires lysosomal activity. Am J Physiol Cell Physiol. 2006 Sep;291(3):C445–55. doi: 10.1152/ajpcell.00505.2005. [DOI] [PubMed] [Google Scholar]
Associated Data
This section collects any data citations, data availability statements, or supplementary materials included in this article.