

Abstract
Immune reconstitution kinetics and subsequent clinical outcomes in HLA-matched recipients of allogeneic stem cell transplantation (SCT) are variable and difficult to predict. Considering SCT as a dynamical system, may allow sequence differences across the exomes of the transplant donors and recipients to be used to simulate an alloreactive T cell response, which may allow better clinical outcome prediction. To accomplish this, whole exome sequencing was performed on 34 HLA matched SCT donor-recipient pairs (DRP), and the nucleotide sequence differences translated to peptides. The binding affinity of the peptides to the relevant HLA in each DRP was determined. The resulting array of peptide-HLA binding affinity values in each patient was considered as an operator modifying a hypothetical T cell repertoire vector, in which each T cell clone proliferates in accordance to the logistic equation of growth. Using an iterating system of matrices, each simulated T cell clone's growth was calculated with the steady state population being proportional to the magnitude of the binding affinity of the driving HLA-peptide complex. Incorporating competition between T cell clones responding to different HLA-peptide complexes reproduces a number of features of clinically observed T cell clonal repertoire in the simulated repertoire. These include, sigmoidal growth kinetics of individual T cell clones and overall repertoire, Power Law clonal frequency distribution, increase in repertoire complexity over time with increasing clonal diversity and finally, alteration of clonal dominance when a different antigen array is encountered, such as in stem cell transplantation. The simulated, alloreactive T cell repertoire was markedly different in HLA matched DRP. The patterns were differentiated by rate of growth, and steady state magnitude of the simulated T cell repertoire and demonstrate a possible correlation with survival. In conclusion, exome wide sequence differences in DRP may allow simulation of donor alloreactive T cell response to recipient antigens and may provide a quantitative basis for refining donor selection and titration of immunosuppression following SCT.
Keywords: Stem cell transplantation, Whole exome sequencing, GVHD, Dynamical system, HLA, Logistic Equation, Vectors, Operators, Histocompatibility
Graphical abstract
Recipient Antigens (MHA-HLA Complexes) In Aggregate Shape The Donor T Cell Repertoire Through Iteration And Feedback
Introduction
Stem cell transplantation (SCT) from HLA matched donors delivers curative therapy to patients with hematological malignancies, however at the cost of significant morbidity derived from the alloreactive phenomenon of graft versus host disease (GVHD) and the immunosuppression administered to control it [1, 2, 3]. Immune reconstitution following allografting is critical for relapse prevention and survival, but may be associated with a higher risk of GVHD in some individuals [4, 5]. Because of the complexity of the variables involved, clinical outcomes following SCT have been studied as a probability function of various clinical features of the transplant. Donor type, histocompatibility, transplant donor recipient gender matching, minor histocompatibility antigens (mHA), intensity of immunosuppression before and after transplantation have figured prominently in such analyses [6, 7, 8]. However, within the constraints of these parameters it is still difficult to precisely predict the development of alloreactivity in individuals undergoing SCT [9]. Further, relatively simple changes in immunosuppressive regimens (to neutralize HLA-mismatch-directed alloreactivity), have allowed transplantation to be performed using donors with increasing levels of disparity across the HLA loci; best exemplified by related, HLA-haploidentical SCT and unrelated, umbilical cord blood transplantation (UCBT) [10]. In these examples of HLA mismatched transplants, GVHD rates are similar or lower when compared with HLA identical donors. While these differences are partly a function of the immunosuppressive regimens used and partly due to the lack of a mature T cell repertoire, they point to the possibility that there does not exist a linear quantitative relationship between the extent of HLA matching in transplant recipients and donors, and clinical outcomes. This observation and the apparently random nature of occurrence of alloreactivity in similarly HLA matched (or mismatched) individuals, suggests that genetic disparity across other regions of the exome (as the determinant of mHA) has a major influence on the clinical outcomes.
From an immunological standpoint, alloreactivity in recipients of HLA matched SCT is driven in part by histo-incompatibilities between transplants donors and recipients. In patients matched for the MHC loci, these mHA generally provide the trigger for initiation of alloreactive tissue injury by donor T cells. A simple whole exome sequencing (WES) approach has demonstrated large numbers of potentially immunogenic DNA sequence differences between transplant donors and recipients [11]. These exonic DNA sequence differences can be analyzed to derive amino-acid sequences that yield different peptides, which in turn demonstrate a range of binding affinities for the HLA molecules present in a specific donor and recipient. This WES + in silico HLA-peptide binding affinity procedure yields a large DRP-specific library of putative mHA which may contribute to alloreactivity resulting in GVHD (HLA binding peptides absent in donors but present in recipients) [12]. Compared to the experimentally-determined mHA, this computational procedure yields several hundred to thousands of potential mHA in each HLA-matched DRP, and thus introduces a very large set of variables which cumulatively may influence the likelihood of GVHD incidence in individual SCT recipients. This derived variant HLA binding peptide library does not reflect the entire histocompatibility antigen spectrum, however, it gives an estimate of the scale of antigen diversity encountered by the donor T cells when transplanted into the recipient, and may be considered as an estimated alloreactivity potential. This measure of antigenic diversity may then be studied to lend an insight into the T cell response to the mHA library in each patient.
The large array of potential peptide targets of alloreactivity, each with a different binding affinity to HLA, is presented on a limited number of HLA class I (present endogenous antigens), and HLA class II (present exogenous antigens) molecules in the recipient tissues. This makes it very unlikely that GVHD incidence is a probability function of a small number of critical variables, rather it is more likely that GVHD is the result of an integrated sum of all the variant immunogenic peptides presented by the HLA in a unique DRP, modulated by the immunosuppressive influence of pharmacotherapy during immune reconstitution. This is a logical assumption since donor T cell reconstitution corresponds with the likelihood of alloreactivity developing [4, 13, 14]. In order to develop a model to estimate the likelihood of alloreactivity developing in unique SCT-DRP, immune response to the peptide-HLA complex library will need to be modeled in each individual. In such a model the binding affinity of the mHA to the relevant HLA molecules will be one of the determinants of the likelihood of individual mHA being presented to T cells.
T cell repertoire following SCT is comprised of thousands of T cell clones, which span a large range of clonal frequencies, with a different range of frequencies for different T cell clones observed in each individual. Over the lifetime of an individual a self-tolerant, pathogen-responsive set of T cell clones is developed, which responds to pathogen-derived peptides in the context of an individual's HLA molecules. The T cell receptors (TCR) characterizing these clones are coupled with CD3 molecules, which deliver a proliferation/activation signal to the T cells when the first signal, target antigen-HLA complex is encountered. Therefore, depending on the presence and immunogenicity of the target antigens, T cell clones may be abundant or scarce. An important moderator of the immune responsiveness is the presence of the second signal, which either enhances or extinguishes immune responsiveness (CD28 and PD-1 respectively). Each functional T cell subset possesses a unique array of TCR αβ, and can recognize and respond to a unique array of HLA-peptide complexes. The eventual T cell repertoire is massive, potentially numbering in the several hundred thousand to more than a million unique T cell clones [15, 16, 17]. High throughput sequencing of TCR cDNA obtained from isolated T cells demonstrates, that the distribution of T cell clonal frequency when ordered according to clonal rank conforms to a Power Law distribution, declining as a power of the number of clones examined [18, 19, 20, 21]. These clonal frequencies may change under different conditions, such as upon encountering pathogens in normal circumstances or in SCT upon encountering alloreactive-antigens. Specifically following SCT the T cell clonal repertoire in the donor product is altered, with clones that were once dominant becoming suppressed and other previously repressed clones becoming ascendant [18, 22].
In order to more accurately compute the likelihood of alloreactivity developing in individual DRP, it is imperative that the interaction between the parallel systems of antigen presentation and T cell response be modeled quantitatively. Lymphocyte reconstitution following SCT has been modeled as a logistic dynamical system, with a familiar sigmoid growth pattern over time (Supplementary Figure 1) [4, 23]. Logically then, various T cell subsets, including T cell clones should demonstrate the same growth dynamic. This makes it possible to develop a model, which may predict immune reconstitution following SCT, by simulating the T cell repertoire emerging in response to the mHA-HLA complex library derived from DRP exome differences (Appendix). In this paper we present a model of T cell reconstitution based upon the application of the logistic dynamical system to a hypothetical T cell repertoire responding to donor recipient mHA-HLA library as previously described [12]. For this study exome sequencing was performed on DNA from 34 SCT donor-recipient pairs, with the resulting data computationally translated to yield putative variant peptides with a graft versus host (GVH) direction (variant amino acid present in the recipient but absent in the donor). HLA class I binding affinity of nona-meric peptides to the relevant HLA in the DRP was determined (Supplementary Table 1). The resulting data were used to develop a mathematical model of CD8+ T cell reconstitution, where T cell clonal proliferation would be proportional to the antigen binding affinity. This model demonstrates significant differences in the alloreactive T cell repertoire evolving in different HLA matched DRP, suggesting that differences in the genetic background may explain disparate outcomes seen in equivalently HLA matched SCT.
Methods
Whole Exome Sequencing and Variant Peptide Library Generation
T cell repertoire simulation was performed using data derived from WES of transplant donors and recipients. To accomplish this, previously cryopreserved DNA was obtained from donors and recipients of allogeneic SCT after obtaining permission from Virginia Commonwealth University's institutional review board. Patients had undergone either 8/8 (n=27) or 7/8 (n=7) HLA-A, B, C and DRB1 matched related (n=7) or unrelated (n=27) SCT according to institutional standards at Virginia Commonwealth University (VCU). HLA matching had been performed using high resolution typing for the unrelated donor SCT recipients; and intermediate resolution typing for class I, and high resolution typing for class II antigens for related donor recipients. In this VCU-institutional review board approved, retrospective study, HLA class I typing information and clinical outcome information was utilized for the patients.
Nextera Rapid Capture Expanded Exome Kit was used to extract exomic regions from the DNA samples, which were then multiplexed and sequenced on an Illumina HiSeq 2500 to achieve an average depth of ∼90 per sample. 2X100 sequencing reads were then aligned to the human reference genome (hg18) using BWA aligner [24]. Single nucleotide polymorphisms (SNPs) unique to the recipient and absent in the donor were identified using our previously outlined method, [11] which utilizes best practices for Genome Analysis ToolKit (GATK) [25] along with in-house software. Exome SNP data was used to determine the resulting variant peptide library using Annovar [26] in each transplant DRP. The HLA-A, B and C binding affinity, IC50 (nM) was determined for all these peptides by running the NetMHCpan (version 2.8) software, as previously reported (Supplementary Table 1 for an example) [27, 28]. Parsing the NetMHCPan output, unique peptide-HLA combinations present in the recipient but not in the donor, i.e., possessing a GVHD vector, were identified and organized in order of declining mHA-HLA affinity.
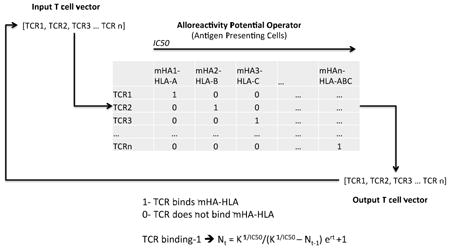
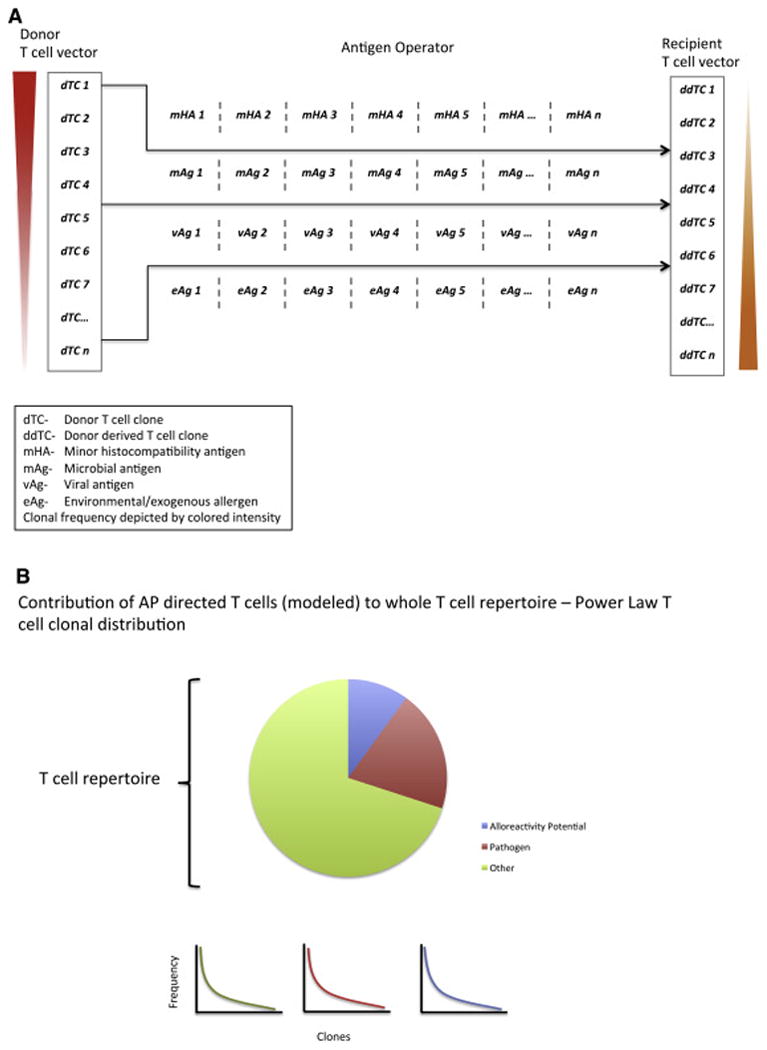
Computational Methods
The mHA-HLA binding affinity data from these patients were used to model a hypothetical T cell response which may arise following a myeloablative allogeneic SCT (Appendix). Briefly, mHA-HLA complexes with a GVHD vector were arrayed in a square matrix in order of descending binding affinity values, against the probability of recognition by a unique T cell clone (0 or 1). A hypothetical T cell population was then arrayed representing the T cell repertoire of the donor, such that each T cell clone in this population would proliferate in response to one of the mHA-HLA complexes in the square matrix (1), and not respond to the others (0). This represents an example of a vector-operator system, where the T cell vector is constituted of an array of individual T cell clones, with the clonal frequency representing the magnitude and T cell receptor specificity representing direction of individual clones. The average T cell vector in a normal donor would have a pathogen specific ‘direction’, and when this is infused into the recipient, there may be T cell clones present in the infused allograft, which will proliferate in response to recipient mHA-HLA complexes. This will alter the frequency of the T cell clones, thus altering the average configuration of the T cell vector over several iterations (cell divisions over time). The array of recipient minor mHA-HLA complexes will in this event comprise an alloreactivity operator. In simple terms, one may consider the alloreactivity operator as a machine, which works on the T cell vector [48] and transforms it over several iterations of the system (Supplementary Figure 2). This transformation is in accordance to the Logistic equation, with the binding affinity of the mHA-HLA complex governing the magnitude of the T cell clonal response (see Appendix for a detailed description and mathematical derivation). Another assumption in this model is that individual T cell clones are competing with each other, and that the relative influence of the competing T cell clones upon each other is parameterized by their respective binding affinities (See Appendix and Supplementary Figure 3). In this model an IC50 cutoff value of 500 nM was chosen to study the various model parameters. IC50 values higher than this cutoff are assumed to represent extremely weak peptide-HLA binding and were, excluded from subsequent analysis. The T cell repertoire simulations were then run in MATLAB (Mathworks Inc., Natick, MA), utilizing the above model (See Supplementary Mathematical Methods and Program).
The sum of all T cell clones was used to represent the T cell vector configuration at steady state for each patient. This was categorized into rapid (α), intermediate (β), or slow (γ) growing vector configuration for analysis of alloreactivity operator influence on clinical outcomes. Cut-off values for vector configuration were assigned based on percentile distribution and cluster pattern. Effect of T cell vector configuration on survival and relapse was examined using SPSS Statistics soft ware package. Distribution of patient characteristics and stem cell transplant outcomes were compared across vector configuration groups using Fisher's exact test. Mean values were compared using the Independent-Samples Kruskal-Wallis test. Kaplan-Meier survival analysis and the log-rank test were used to compare survival and time-to-relapse between vector configurations.
Results
Whole exome sequencing and Peptide Library Generation
WES data from 34 patients were used to generate unique variant peptide-HLA libraries in the GVH direction for each patient using the NetMHC pan software. The mathematical model presented here simulates the T cell repertoire that may result from such minor histocompatibility antigens, associated with exome wide sequence differences between donors and recipients, accounting for their HLA type. The exome difference data were used to generate variant nine-mer peptides, and the resulting mHA-HLA class I binding affinities specific to each DRP were used to populate individual-specific square matrices. An average, 2260 peptide-HLA complexes (range: 537 to 4755) were evaluated in these calculations, and included peptides bound to HLA-A, B and C molecules in each DRP (manuscript in preparation). Fifteen patients underwent SCT from gender disparate donors (10 M to F and 5 F to M). An important limitation of our SNP-based alloreactive peptide determination method is the inability to determine Y chromosome-derived peptides in the specific female donor to male recipient DRP, because of the absence of a comparator Y chromosome. Anti-thymocyte globulin was administered as a part of the preparative regimen in 31/34 patients; tacrolimus + methotrexate and tacrolimus + mycophenolate mofetil was administered in 17 and 11 patients respectively, and cyclosporine instead of tacrolimus was used in these combinations in 4 and 2 patients respectively for GVHD prophylaxis.
T Cell Repertoire Simulation
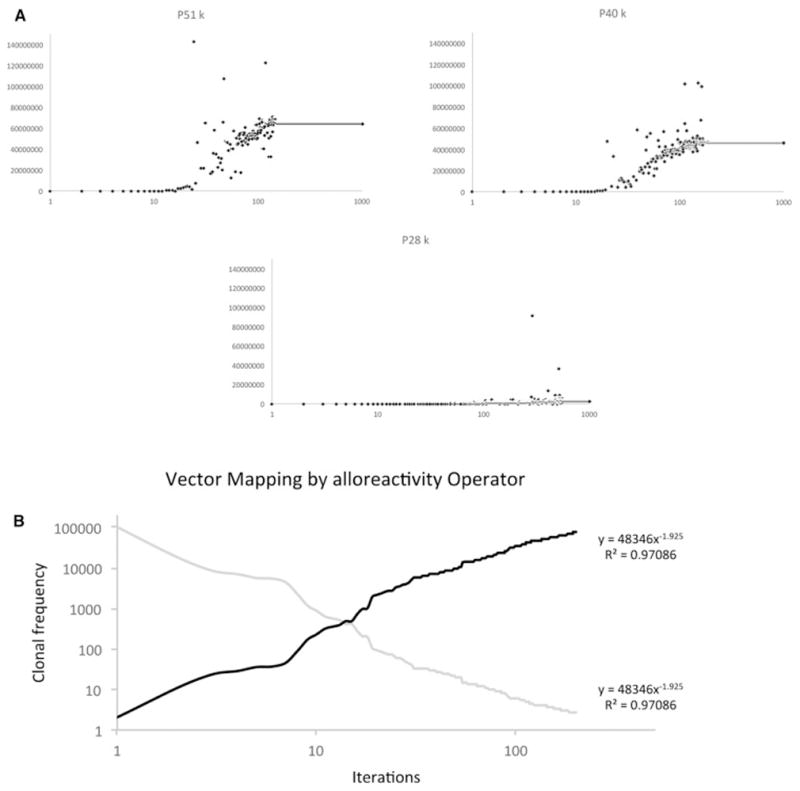
The mHA-HLA alloreactive antigen operator matrix for each patient was then evaluated for a hypothetical alloreactive CD8+ T cell response. This operation transformed a hypothetical donor T cell vector, νTCD, with each T cell clone designated an initial frequency, N0 = 1, representing a single T cell recognizing each of the mHA-HLA complexes. Substituting Equation 3 for the value 1 in the identity matrix MARO in equation 2 (Appendix), and setting r at 1.5 and K at 109, a sigmoid growth curve is observed in the T cell clonal populations as the iterative calculations are performed to simulate T cell clonal proliferation to get the final νTCR. In this model the steady state T cell clonal (TC) populations depend on the binding affinity (≈1/IC50) of the relevant peptide-HLA complex (Figure 1 A-C). In this system, when starting with a single T cell recognizing each mHA-HLA complex, and proliferating in proportion to the binding affinity, only a small number of T cell clones grow to a high frequency. When T cell clones present at a frequency of >10 at steady state (iteration beyond which there is no further growth) are plotted on a log-log plot, a Power Law distribution of the clonal frequencies is observed (Supplementary Figure 4A), analogous to T cell clonal distribution observed in normal donors [18]. Consistent with the observations from normal donors there are many low frequency clones (<10). Using this model, the sum of all the T cell clones in an individual over time (i.e. after several iterations) follows a sigmoid curve, analogous to the sigmoid growth behavior in post allograft setting when lymphocyte populations have been examined (Supplementary Figure 4A) [4]. This behavior was observed in all 34 patients modeled.
Figure 1.
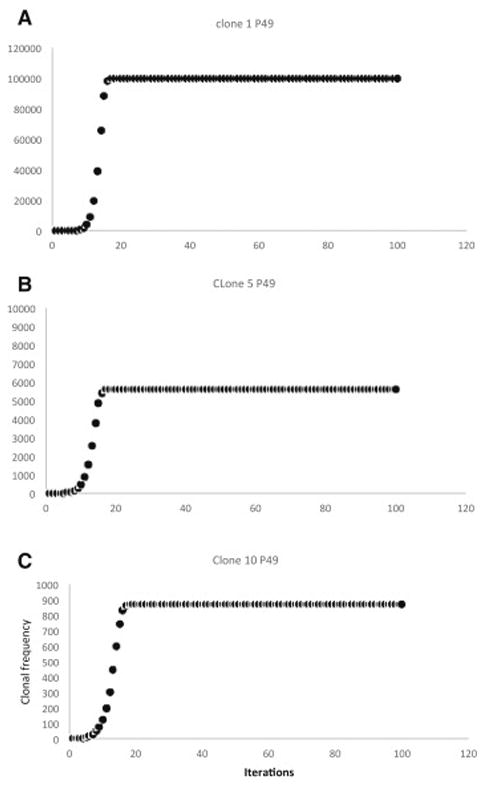
Sigmoid growth behavior of simulated individual T cell clonal frequencies under a non-competing model with different peptide-HLA binding affinities. Proportional growth factors are: A- IC50 1.8 nM; B- IC50 2.4 nM; C- IC50 3.06 nM. Note declining y-axis values in the successive graphs. P# refers to patient number.
The resulting T cell repertoire is similar to that seen clinically, and demonstrates features such as power law distribution and logistic kinetics over time. Importantly this model demonstrates that despite a very large array of peptide mHA, only a few T cell clones become dominant; thus identifying peptides that appear to be of greatest relevance under the modeled conditions, but more importantly giving a likeness of observed, normal clonal distribution. This behavior of the model generated T cell repertoire is analogous to the in vivo difference between antigen driven and homeostatic T cell proliferation. T cell clones bearing the receptors which recognize target antigens, when stimulated by relevant second signals, will result in an antigen-driven exponential expansion to the carrying capacity of the system, while the remaining T cell clones that do not have a relevant antigen or only have a weakly HLA bound antigen will fail to expand, but will survive at low numbers, homeostatic expansion, under ambient conditions. When scrutinizing these results it is important to recognize that at the current stage of investigation, the source data for this calculation, the IC50s of peptide-HLA complexes does not account for GVHD target organ protein expression. Predicting tissue-specific clonal expansion, in order to predict GVHD in certain tissues, or treat it differently is potentially a fruitful focus of future work.
Competition between T cell clones leads to variability
T cell clones do not proliferate in isolation; they do so in a milieu of other T cells responding to different antigens, each with varying binding affinity to HLA molecules. Accounting for competition between T cell clones introduces significant variability in the clonal populations during the early iterations following growth initiation (Figure 2A-C), with specific clonal populations growing rapidly and then plummeting only to grow back again with successive iterations. This effect of competition is most evident on clones that respond to low affinity peptides, where the clones were initially suppressed, only to emerge with later iterations. Therefore as the number of iterations increased so did the number of clones with a detectable population, in other words with increasing number of iterations, a larger number of T cell clones populated the curves, consistent with the physiological observation of increasing T cell repertoire complexity, diversity with the passage of time following SCT. Similar to the case of noncompeting clones, the TCR vector configuration again followed a Power Law distribution, and because of the initial transient suppressive effect of competition on lower affinity clones (Supplementary Figure 5A) over time the repertoire size increased. Due to the variability observed in the individual clones, the sum of all clones for each individual demonstrated marked variability, with the dominant clones suppressing weaker clones early on and weaker clones emerging later on (Supplementary Figure 5B). Initial overgrowth was followed by later decline to a steady state value, in individual clones and the overall repertoire, which fluctuated about an average value slowly increasing over time as the lower affinity clones started to grow. As a larger number of clones are incorporated there is a significant increase in the variability of the curve with TC clones directed at high affinity peptides demonstrating early variability and lower affinity peptide targeting TC clones experiencing late variability. This chaotic behavior can be illustrated by constructing phase space plots (Figure 3), where successive values of the clonal population are plotted against each other (Nt+1 plotted against Nt). The phase space plots, with the designated parameters (N0, r, K) demonstrate clonal fluctuation (loops in the plots) each eventually settling down to an attractor, a limited region of the phase space towards which the system evolves. Striking similarity is seen in the behavior of the different clones, albeit at different scales of magnitude, supporting the observation of self-similarity of the repertoire across scales of magnification. The self-similar repertoire distribution of these simulations was further supported by Log-Rank analysis of the repertoire at different time intervals. There was general conformity to a Power Law growth patterns, when log-rank analysis was used to analyze the data sets for individual patients, after the 50th, 100th and >2000th iterations (Supplementary Figure 6). These model predictions are comparable to real-life TC clonal frequency data from high throughput sequencing.
Figure 2.
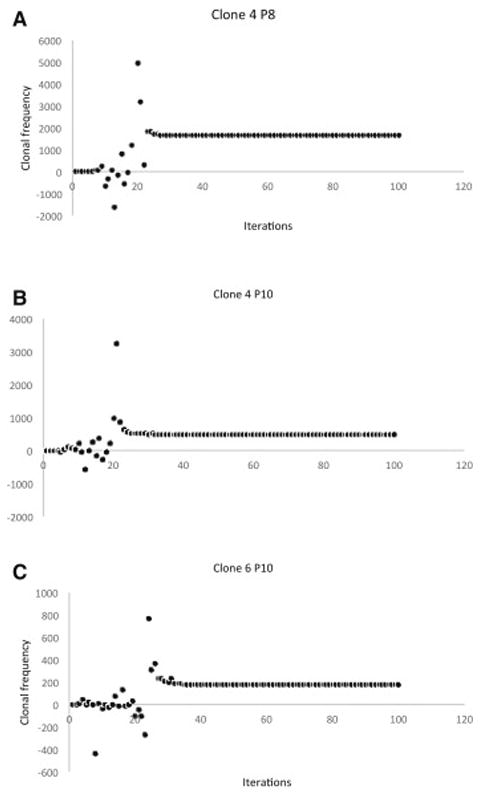
Simulated clonal frequency of individual T cell clones accounting for competition between clones. A: IC50 2.49 nM; B: IC50 3.34 nM: C: IC50 4 nM. Marked early fluctuation can be seen in clonal populations, followed by eventual achievement of steady state at a rate proportional to the binding affinity of the target peptide.
Figure 3.
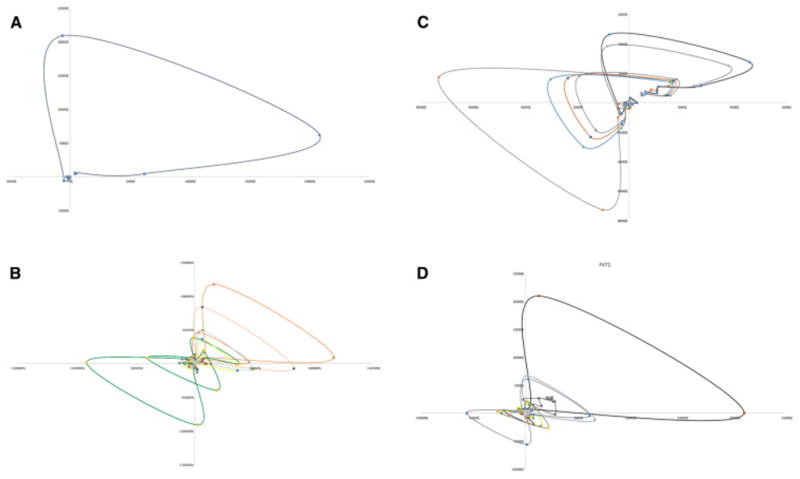
Phase space plots of T cell clonal growth patterns, Nt plotted as a function of Nt-1. Plots A, B and C are successive clones from P33 and D depicts cumulative clones from P47. Clonal frequency loops have a similar morphology in different patients and tend to evolve towards a limited region of the phase space, an attractor. Attractors may be associated with certain clinical outcomes, like GVHD or tolerance when the entire T cell repertoire is considered.
Vector-Operator modeling reveals different alloreactivity potential in HLA matched individuals
When WES-derived HLA-peptide binding IC50 data were evaluated using the competing T cell clonal vector-alloreactivity operator model, the HLA matched patients could be differentiated into three different categories, according to their T cell vector configuration. These were termed α, β and γ for reference. The T cell vector configuration α was characterized by a rapid, exponential rise in the sum of all clones to a value >200,000 when the K was set to 109, whereas β was characterized by a slower growth to a level between 200,000 and 30,000, and finally the slowest growing, γ, configuration which remained at <30,000 T cells at steady state (as many iterations as the number of peptide-HLA complexes) (Figure 4A). Among the 34 patients tested, 10 patients demonstrated an α vector configuration (median steady state, Σ T cell =405,289), 10 β configuration (Σ T cell =102,239), and 14 had a γ configuration (Σ T cell =12,956) (Figure 4B). In the simulations run to date, groups α and β had relatively lower variability in the clonal and total T cell populations in the later iterations, while the group γ demonstrated the greatest late variability, perhaps reflecting the relatively larger impact of the lower affinity peptide driven T cell clonal growth, in this system with lower alloreactivity potential. The difference observed in the model output is likely related to the number of mHA and more importantly the distribution of the binding affinity of the variant peptides to the HLA in the unique donor recipient setting. Further, this finding of a variable WES-derived estimate of alloreactivity potential in similarly HLA-matched individuals may provide an alternative explanation of the variability observed in the incidence of alloreactivity following SCT.
Figure 4.
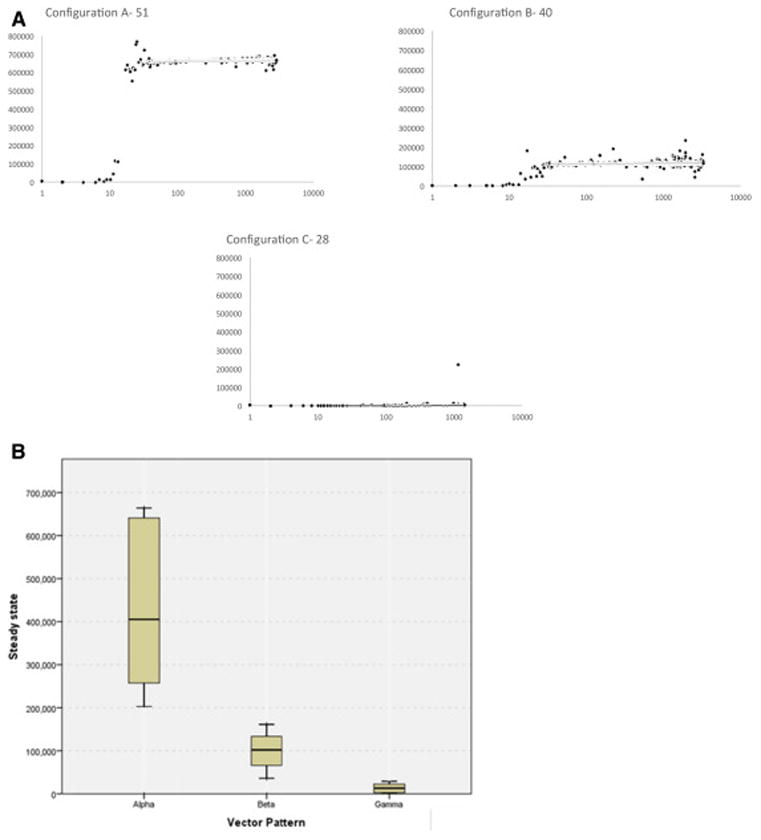
A. Simulated TC repertoire configurations (sum of all T cell clones plotted over time), from different HLA matched patients, fall in three broad classes. Y-axis depicts the total T cell number and X-axis, the iterations. Configuration A or α- Rapid average exponential growth with high K; Configuration B or β- Slower exponential growth phase with lower average K; Configuration C or γ- Very slow growth with very low average K value. B. Range of steady state values for each vector pattern in the 34 patient cohort; N for each cohort 10 (α), 10 (β) and 14 (γ).
Evaluation of the demographics of the patients with different vector configurations demonstrates some surprising observations, for example the vector configuration γ is seen more commonly in patients with HLA mismatched donors (FET P=NS) and in patients of African ancestry (FET P=0.04), and was no less common in gender mismatched, or unrelated transplantation (Table 1). In our cohort of exome-sequenced patients, a trend towards survival advantage and reduced relapse was discernable in patients who had a vector configurations α and β (Figure 5). The lower survival and relapse risk observed in the DRP with vector configuration γ suggests that a minimal requisite burden of donor vs. recipient alloreactivity may be required to establish a graft vs. malignancy effect and confer survival advantage. We did not observe any correlation with either acute or chronic GVHD, however this observation may be confounded by the use of anti-thymocyte globulin in most patients and the absence of Y chromosome coded peptide information in the female into male transplants. Given the as yet hypothetical nature of this model, these clinical correlations only serve as a guide for future investigation into the quantitative effects of alloreactivity potential differences between SCT donors and recipients.
Table 1. Patient demographics for DRP with different vector configurations.
| Vector Pattern (n) | ||||
|---|---|---|---|---|
| α (10) | β (10) | γ (14) | ||
| Diagnosis, n (%) | Acute myeloid leukemia | 2 (20) | 5 (50) | 5 (36) |
| Acute lymphoid leukemia | 1 (10) | 0 (0) | 2 (14) | |
| Myelodysplastic syndromes | 5 (50) | 3 (30) | 2 (14) | |
| Chronic lymphocytic leukemia and lymphomas | 2 (20) | 1 (10) | 4 (29) | |
| Multiple myeloma | 0 (0) | 1 (10) | 1 (7) | |
| Donor Type, n (%) | MRD | 2 (20) | 3 (30) | 2 (14) |
| MUD | 8 (80) | 7 (70) | 12 (86) | |
| HLA mismatch, n (%) | No | 8 (80) | 10 (100) | 9 (64) |
| Yes | 2 (20) | 0 (0) | 5 (36) | |
| Patient Age, mean (%) | <55 | 4 (40) | 7 (70) | 6 (43) |
| >=55 | 6 (60) | 3 (30) | 8 (57) | |
| Donor Age, mean (%) | <40 | 6 (60) | 4 (40) | 7 (50) |
| >=40 | 4 (40) | 6 (60) | 7 (50) | |
| Patient Race, n (%) | Caucasian | 9 (90) | 9 (90) | 7 (50) |
| African American | 1 (10) | 1 (10) | 7 (50) | |
| Race disparity, n (%) | No | 9 (90) | 10 (100) | 9 (64) |
| Yes | 1 (10) | 0 (0) | 4 (29) | |
| Unknown | 0 (0) | 0 (0) | 1 (7) | |
|
|
||||
| Patient/Donor Gender, n (%) | Male/Male | 2 (20) | 4 (40) | 7 (50) |
| Female/Male | 4 (40) | 3 (30) | 3 (21) | |
| Female/Female | 1 (10) | 2 (20) | 3 (21) | |
| Male/Female | 3 (30) | 1 (10) | 1 (7) | |
Figure 5.
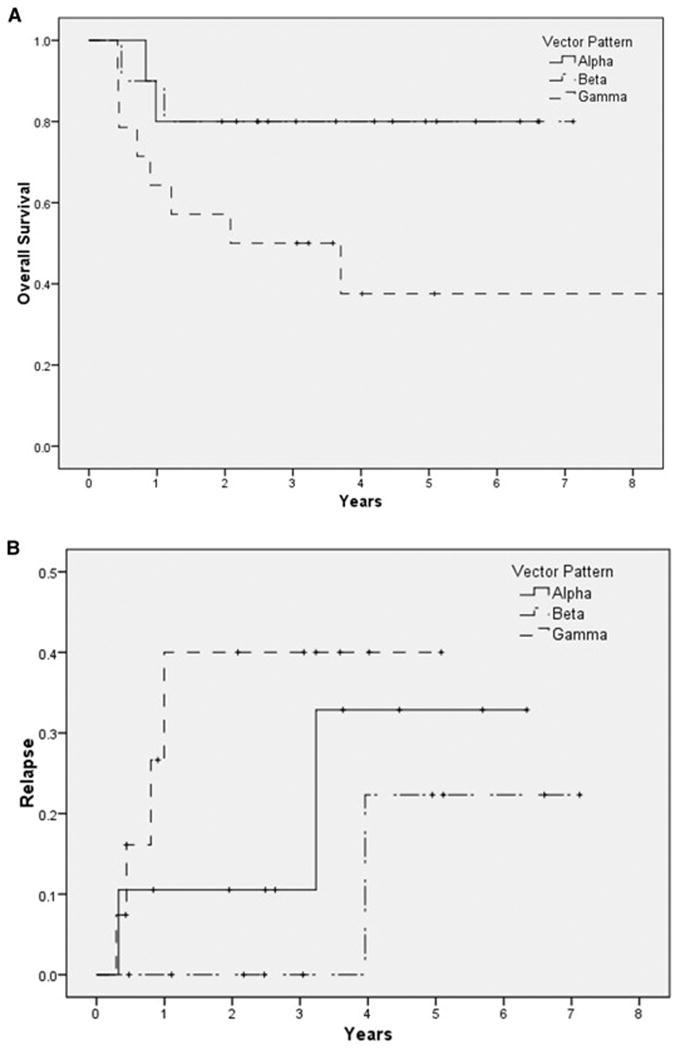
Survival (A) and relapse (B) in patients with TCR vector configuration α, β and γ respectively (determination based on the steady state values). Mantel Cox, test for equality of distribution Log Rank P =0.03 for survival, and P=0.47 for relapse.
Properties of the T cell vector and alloreactivity operator system
This system of simulating alloreactive CD8+ cell repertoire using the mHA-HLA complex operator does not predict GVHD in our small cohort of patients. The failure to do so may be related to the limited nature of mHA panel studied (only nona-mers on HLA class I molecules), and the absence of GVHD target organ specific protein expression data to make the alloreactivity operator matrix closer to reality. While this optimization of the algorithm is ongoing, in order to test the versatility of the matrix system an arbitrary set of multipliers was developed to study the effect of large-scale organ distribution, particularly on the low affinity peptides (see mathematical methods). When these calculations were performed, a significant increase in the magnitude of all the T cell clones was observed. While Power Law relationships were maintained, more clones showed a greater magnitude of growth. This also slowed down the rate of rise of the clonal populations. As can be seen (Figure 6A) there was a substantial increase in the magnitude of the final sum of all clones, albeit at the expense of greater variability and less rapid growth observed in the different curves.
Figure 6.
A: Cumulative effect of multipliers on K for individual clones to simulate tissue distribution of peptides. Marked slowing of the rate of growth due to a large number of competing clones, and significantly larger magnitude of eventual vector. Total clonal frequency plotted against iterations.
B: Vector transformation by the alloreactivity operator. Original T cell vector (Gray) mapped to a new configuration (black line) when iterated through an inverse of the alloreactivity operator.
A very important property of this model is its ability to alter the direction and magnitude of a donor TCR vector to a new recipient vector. In other words clones that are dominant in one instance will be down regulated and low frequency clones will be up regulated if they encounter their cognate antigens with a higher binding affinity. In the model this is demonstrated by taking the output of one individual's steady state T cell repertoire, and inverting them such that the K for the least avid peptide-HLA complex directed TC clone becomes the N0 for the most avid complex. The matrix is then iterated till it reaches a steady state. This results in a complete inversion of the clonal frequencies (Figure 6B). This finding is consistent with donor TCR repertoire being altered upon exposure to recipient derived antigens following SCT.
Discussion
HLA matching is the gold standard for determining histocompatibility in SCT recipients. However in recent years the use of less well-matched donors has become more frequent due to improvements in post transplant immunosuppression. GVHD risk with alternative donor transplants is similar to, if not somewhat lower than conventional HLA matched transplants. This implies that alloreactivity in the form of GVHD is determined, in large part by sequence differences outside the major histocompatibility locus, i.e., minor histocompatibility antigens. in HLA matched related donors these antigenic differences may arise through the exchange of chromosomal material during meiotic recombination as a part of gametogenesis and may be estimated by whole exome sequencing. There are many exome sequence differences in each transplant DRP, especially in those with unrelated donors, and this contributes a massive array of potential peptide antigens. This array of antigenic targets may have a formative influence on the T cell repertoire and overall immune reconstitution in the recipient after SCT, which may, in turn influence clinical outcomes. In this paper, dynamical system modeling using the concept of vectors and operators derived from matrix mathematics demonstrates that despite HLA matching different DRP have significant variability in their ability to generate an alloreactive T cell response. Incorporating such analytic procedures in the donor selection algorithms in the future may allow improved prediction of the likelihood of alloreactivity developing in specific transplant donors and recipients.
Immune reconstitution following SCT is a dynamical process where the components of the system evolve as a logistic function of time. Making a basic assumption that T cell expansion will be governed by the binding affinity of the variant peptide to HLA, a putative donor T cell response to the variant peptide library encountered in the recipient may be simulated. This simple T cell vector-alloreactivity operator model reproduces many of the observations from recent studies of T cell repertoire organization. Specifically, assuming T cell clonal growth in proportion to the target antigen-HLA binding affinity, both individual T cell clones and the entire T cell repertoire follow a sigmoid, logistic dynamic over time as the system iterates. This is similar to immune reconstitution kinetics in a cohort of allograft recipients reported recently [4]. While this behavior is inherent due to the use of a logistic equation to model the growth of each clone, the generalization to the entire repertoire results from using the rule that the steady state T cell population of specific clones will be proportional to the binding affinity of the variant peptides to HLA. In essence, the more strongly bound a peptide the more likely it is to elicit a strong response, obviously in the presence of appropriate second signals. Further validation of the model simulating normal physiology comes from the resulting steady state T cell repertoire approximating a Power Law distribution of the T cell clonal frequency for the entire repertoire [18, 19, 20]. The model predicts the emergence of a limited number of dominant T cell clones, symbolizing antigen driven proliferation and a large number of low frequency clones representing a reservoir of T cell clones, which are likely maintained through homeostatic mechanisms [29, 30, 31]. Recent observations of similar T cell receptor VDJ expressing clones dominating in different patients with a similar HLA type also lends credence to this model and its underlying premise [32]. Incorporating competition, with high affinity antigen directed T cell clones dominating lower affinity antigen directed clones (Supplementary Figure 3B), introduces instability with wide fluctuations in individual T cell clonal frequency, resulting in variability in the early T cell repertoire, and chaotic behavior. In the model incorporating competition the dominant higher affinity T cell clones suppress the lower affinity T cell clones early on, however these clones emerge at a later time demonstrating instability at first before eventually settling down. This chaotic behavior is inherent to the competition introduced by multiple clones encountering antigen simultaneously and is a property of the Lotka-Volterra modification used to calculate individual clonal growth [33]. Similar behavior has recently been reported where wide variation has been demonstrated in the T cell clonal population over time following transplantation [34]. Clonal repertoire expansion with time is also observed, similar to increasing repertoire complexity observed following SCT. Finally, this model provides a quantitative explanation of the change in T cell clonal distribution changing following SCT [18, 22, 35]. The alteration of relative T cell clonal frequency in autologous SCT is particularly instructive when one considers that dominant T cell clones established through a lifetime of antigen exposure are reordered following immuno-ablative high-dose therapy. In this instance a new antigenic landscape is encountered in the immediate post transplant setting with a shift in the resulting T cell repertoire [39]. This effect has been clinically utilized in lymphodepletion prior to adoptive immunotherapy of a variety of malignant disorders [36].
Measuring T cell repertoire modification post transplant, in response to an alloreactivity operator may have value in forecasting the onset of GVHD. In patients who have alloreactive antigen-driven proliferation dominating from the outset one would expect an oligoclonal pattern approximating the relevant vector configuration (α, β or γ) to emerge, rather than a polyclonal repertoire which would be expected with normal immune reconstitution. Since the tissue antigen presentation cannot be measured for all tissues, T cell repertoire measurement post transplant may allow inference of the antigen presentation patterns in patients with or without GVHD. Having a model by which to estimate the expected T cell repertoire will be invaluable in accomplishing this. This hypothesis is supported by the observation that patients who have oligoclonal T cell recovery following SCT may be more likely to be susceptible to alloreactivity [37, 37]. Further support for the notion of oligoclonal T cell growth in response to high affinity and abundant minor histocompatibility antigens comes from the observation of clonal growth in mixed lymphocyte reactions (MLR) predicting loss of renal allografts [38]. MLR has also been used to study, alloreactive T cell clonal populations following SCT and has demonstrated the presence of a large number of dominant and low frequency clones over time [39]. It is therefore highly likely that when adjusted for antigen abundance (as demonstrated by the empirical effect of the K multiplier in our model) whole exome sequencing of donors and recipients will be able to predict the magnitude of alloreactivity when it is analyzed using this T cell vector-mHA operator model. The quantitative adjustment of the alloreactivity operator for tissue antigen expression is being actively investigated.
Despite the survival association observed, no correlation was seen between the likelihood of GVHD developing in patients and the different vector configurations. Aside from the confounding effect of anti-thymocyte globulin use in these patients there are several different explanations for this lack of association at this stage of model building. First, the variability and chaotic behavior unveiled when competition between clones is accounted for makes it very likely that the presence of competing, non-cross reactive strongly bound antigens would reduce the likelihood of clinical alloreactivity developing (Figure 7). This notion is supported by the observation that the TC repertoire diversity is higher in patients without GVHD than in those with GVHD [41]. Competition may be introduced by several different mechanisms, including vaccination, restoration of microbiota and finally epigenetic modification that up regulates cancer-specific antigens. Importantly this may allow a non-immunosuppression based mechanism of GVHD prophylaxis. This so because chaotic systems such as the one represented by the T cell reconstitution model with competition are sensitive to initial conditions and the balance of high-affinity alloreactive vs. non-alloreactive clones at the earliest time may be critical in determining likelihood of GVHD developing in these patients. Another important source of randomness in this dynamical system model, comes from the stochastic nature of the T cell clones recognizing mHA-HLA complexes present in a unique DRP. In the model, this has been represented by a 1 (T cell clone recognizing peptide-HLA present) or a 0 (relevant T cell clone absent) incorporated into the vector. In the real-life situation, these T cell clones may or may not be present in the transplanted cells and thus introduce a stochastic element in this dynamical system model of alloreactivity. The probability of alloreactive T cell clones (TCx) being present in this model may be considered as a multiplier for each clones' starting (and subsequent) population Nt and may be estimated as follows,
Figure 7.
Multiple different sets of antigens contribute to eventual T cell repertoire formation and competition between clones may alter eventual clinical outcomes. A: Competing arrays of different antigens encountered by donor T cells following transplantation transform the vector (reversal of the clonal frequencies depicted by the red and orange arrowheads). B: Depending on the immunogenicity of antigens encountered in the recipients either alloreactive or non-alloreactive donor derived T cell clones may becoming dominant.
This equation states that the probability ρ of a unique T cell clone, TCx, recognizing a specific mHA-HLA, x, being present in the infused allograft is approximately equal to the clonal diversity T cells infused and the inverse of the sum of all antigens (Ag – HLA) encountered in the recipient. This measure will be offset by T cell depletion such as by anti-thymocyte globulin or post-transplant cyclophosphamide administration. Therefore the development of alloreactivity within this dynamical system is contingent upon the presence of T cells recognizing the vast array of antigen-HLA (including mHA-HLA) complexes (Figure 7). This expression gives the likelihood of alloreactive T cells being present in the donor T cell complement and helps to partially explain the still seemingly stochastic outcomes in patients modeled herein. Further uncertainty is introduced in the model, as one considers the presentation of other non-immunogenic recipient peptides not present in this potentially alloreactive library competing for presentation with the alloreactive peptides on the relevant HLA. These sources of randomness aside, the advantage of having a model to predict T cell repertoire response to exome sequence variation between donors and recipients is that, if validated, it may allow personalized estimation of alloreactivity developing and appropriate titration of immunosuppression post-transplant.
The complexity of GVHD in SCT, represents a unique model system with which to study immune reconstitution in the background of genetic diversity between the stem cell donors and recipients. Knowledge of the quantitative immunobiology of SCT may then make it easier to develop stem cell donor selection algorithms that improve upon the prevailing standards of donor selection. It is important to recognize that this model is based upon an in silico determination of peptide binding affinity derived from actual DNA sequencing so is vulnerable to the pitfalls that the HLA binding affinity determining program might have. Nevertheless, while still in need of validation and further development, this dynamical system model of T cell reconstitution following SCT provides a mathematical framework which can be utilized to study the effect of various parameters such as donor T cell dose, immunosuppressive regimens on post transplant outcomes and with further development may lead to more precise titration of T cell dose and immunosuppression to achieve optimal clinical outcomes following SCT, as well as optimal donor selection beyond HLA identity.
Supplementary Material
Highlights.
Exome sequencing may predict alloreactive donor T cell response utilizing matrix mathematics.
HLA-matched transplant donor recipient pairs may exhibit different alloreactive T cell responses.
Acknowledgments
This work was supported by Massey Pilot Project Grant and an award from Virginia's Commonwealth Health Research Board (PI: MN). BA wrote the program for performing calculations in MATLAB and performed vector-operator calculations presented in this paper along with SS and MM. MS performed sequencing on samples identified and procured by CR and MV. VK performed bioinformatic analysis of the sequencing data to identify unique peptides and their HLA binding affinity. AS created data files with unique peptides and HLA IC50 values and did the statistical analysis as well as collect and verify patient data. JM performed Log Rank analysis. All the authors contributed to writing the manuscript.
Footnotes
Publisher's Disclaimer: This is a PDF file of an unedited manuscript that has been accepted for publication. As a service to our customers we are providing this early version of the manuscript. The manuscript will undergo copyediting, typesetting, and review of the resulting proof before it is published in its final citable form. Please note that during the production process errors may be discovered which could affect the content, and all legal disclaimers that apply to the journal pertain.
References
- 1.Wagner JE, Thompson JS, Carter SL, Kernan NA, Unrelated Donor Marrow Transplantation Trial Effect of graft-versus-host disease prophylaxis on 3-year disease-free survival in recipients of unrelated donor bone marrow (Tcell Depletion Trial): a multi-centre, randomised phase II-III trial. Lancet. 2005 Aug 27 2;Sep 27 2;366(9487):733–41. doi: 10.1016/S0140-6736(05)66996-6. [DOI] [PubMed] [Google Scholar]
- 2.Bayraktar UD, de Lima M, Saliba RM, Maloy M, Castro-Malaspina HR, Chen J, Rondon G, Chiattone A, Jakubowski AA, Boulad F, Kernan NA, O'Reilly RJ, Champlin RE, Giralt S, Andersson BS, Papadopoulos EB. Ex vivo T cell-depleted versus unmodified allografts in patients with acute myeloid leukemia in first complete remission. Biol Blood Marrow Transplant. 2013 Jun;19(6):898–903. doi: 10.1016/j.bbmt.2013.02.018. [DOI] [PMC free article] [PubMed] [Google Scholar]
- 3.van Burik JA, Carter SL, Freifeld AG, High KP, Godder KT, Papanicolaou GA, Mendizabal AM, Wagner JE, Yanovich S, Kernan NA. Higher risk of cytomegalovirus and aspergillus infections in recipients of T cell-depleted unrelated bone marrow: analysis of infectious complications in patients treated with T cell depletion versus immunosuppressive therapy to prevent graft-versus-host disease. Biol Blood Marrow Transplant. 2007 Dec;13(12):1487–98. doi: 10.1016/j.bbmt.2007.08.049. [DOI] [PubMed] [Google Scholar]
- 4.Toor AA, Sabo RT, Roberts CH, Moore BL, Salman SR, Scalora AF, Aziz MT, Shubar Ali AS, Hall CE, Meier J, Thorn RM, Wang E, Song S, Miller K, Rizzo K, Clark WB, McCarty JM, Chung HM, Manjili MH, Neale MC. Dynamical System Modeling of Immune Reconstitution after Allogeneic Stem Cell Transplantation Identifies Patients at Risk for Adverse Outcomes. Biol Blood Marrow Transplant. 2015 Jul;21(7):1237–45. doi: 10.1016/j.bbmt.2015.03.011. [DOI] [PMC free article] [PubMed] [Google Scholar]
- 5.Kim HT, Armand P, Frederick D, Andler E, Cutler C, Koreth J, Alyea EP, 3rd, Antin JH, Soiffer RJ, Ritz J, Ho VT. Absolute lymphocyte count recovery after allogeneic hematopoietic stem cell transplantation predicts clinical outcome. Biol Blood Marrow Transplant. 2015 May;21(5):873–80. doi: 10.1016/j.bbmt.2015.01.019. [DOI] [PubMed] [Google Scholar]
- 6.Lee SJ, Klein J, Haagenson M, Baxter-Lowe LA, Confer DL, Eapen M, Fernandez-Vina M, Flomenberg N, Horowitz M, Hurley CK, Noreen H, Oudshoorn M, Petersdorf E, Setterholm M, Spellman S, Weisdorf D, Williams TM, Anasetti C. High-resolution donor-recipient HLA matching contributes to the success of unrelated donor marrow transplantation. Blood. 2007;110:4576–4583. doi: 10.1182/blood-2007-06-097386. [DOI] [PubMed] [Google Scholar]
- 7.Spellman S, Warden MB, Haagenson M, Pietz BC, Goulmy E, Warren EH, Wang T, Ellis TM. Effects of mismatching for minor histocompatibility antigens on clinical outcomes in HLA-matched, unrelated hematopoietic stem cell transplants. Biol Blood Marrow Transplant. 2009 Jul;15(7):856–63. doi: 10.1016/j.bbmt.2009.03.018. [DOI] [PMC free article] [PubMed] [Google Scholar]
- 8.Granier C, Biard L, Masson E, Porcher R, Peffault de Latour R, Robin M, Boissel N, Xhaard A, Ribaud P, Lengline E, Larghero J, Charron D, Loiseau P, Socié G, Dhedin N. Impact of the source of hematopoietic stem cell in unrelated transplants: Comparison between 10/10, 9/10-HLA matched donors and cord blood. Am J Hematol. 2015 Jul 6; doi: 10.1002/ajh.24112. [DOI] [PubMed] [Google Scholar]
- 9.Valcárcel D, Sierra J, Wang T, Kan F, Gupta V, Hale GA, Marks DI, McCarthy PL, Oudshoorn M, Petersdorf EW, Ringdén O, Setterholm M, Spellman SR, Waller EK, Gajewski JL, Marino SR, Senitzer D, Lee SJ. One-antigen mismatched related versus HLA-matched unrelated donor hematopoietic stem cell transplantation in adults with acute leukemia: Center for International Blood and Marrow Transplant Research results in the era of molecular HLA typing. Biol Blood Marrow Transplant. 2011 May;17(5):640–8. doi: 10.1016/j.bbmt.2010.07.022. [DOI] [PMC free article] [PubMed] [Google Scholar]
- 10.Brunstein CG, Fuchs EJ, Carter SL, Karanes C, Costa LJ, Wu J, Devine SM, Wingard JR, Aljitawi OS, Cutler CS, Jagasia MH, Ballen KK, Eapen M, O'Donnell PV, Blood and Marrow Transplant Clinical Trials Network Alternative donor transplantation after reduced intensity conditioning: results of parallel phase 2 trials using partially HLA-mismatched related bone marrow or unrelated double umbilical cord blood grafts. Blood. 2011 Jul 14;118(2):282–8. doi: 10.1182/blood-2011-03-344853. [DOI] [PMC free article] [PubMed] [Google Scholar]
- 11.Sampson JK, Sheth NU, Koparde VN, Scalora AF, Serrano MG, Lee V, Roberts CH, Jameson-Lee M, Ferreira-Gonzalez A, Manjili MH, Buck GA, Neale MC, Toor AA. Whole exome sequencing to estimate alloreactivity potential between donors and recipients in stem cell transplantation. Br J Haematol. 2014 Aug;166(4):566–70. doi: 10.1111/bjh.12898. [DOI] [PMC free article] [PubMed] [Google Scholar]
- 12.Jameson-Lee M, Koparde V, Griffith P, Scalora AF, Sampson JK, Khalid H, Sheth NU, Batalo M, Serrano MG, Roberts CH, Hess ML, Buck GA, Neale MC, Manjili MH, Toor AA. In silico Derivation of HLA-Specific Alloreactivity Potential from Whole Exome Sequencing of Stem-Cell Transplant Donors and Recipients: Understanding the Quantitative Immunobiology of Allogeneic Transplantation. Front Immunol. 2014 Nov 6;5:529. doi: 10.3389/fimmu.2014.00529. [DOI] [PMC free article] [PubMed] [Google Scholar]
- 13.Nikolousis E, Robinson S, Nagra S, Brookes C, Kinsella F, Tauro S, Jeffries S, Griffiths M, Mahendra P, Cook M, Paneesha S, Lovell R, Kishore B, Chaganti S, Malladi R, Raghavan M, Moss P, Milligan D, Craddock C. Post-transplant T cell chimerism predicts graft versus host disease but not disease relapse in patients undergoing an alemtuzumab based reduced intensity conditioned allogeneic transplant. Leuk Res. 2013 May;37(5):561–5. doi: 10.1016/j.leukres.2013.01.010. [DOI] [PubMed] [Google Scholar]
- 14.Mossallam GI, Kamel AM, Storer B, Martin PJ. Prognostic utility of routine chimerism testing at 2 to 6 months after allogeneic hematopoietic cell transplantation. Biol Blood Marrow Transplant. 2009 Mar;15(3):352–9. doi: 10.1016/j.bbmt.2008.12.496. [DOI] [PMC free article] [PubMed] [Google Scholar]
- 15.Robins HS, Campregher PV, Srivastava SK, Wacher A, Turtle CJ, Kahsai O, Riddell SR, Warren EH, Carlson CS. Comprehensive assessment of T-cell receptor beta-chain diversity in alphabeta T cells. Blood. 2009 Nov 5;114(19):4099–107. doi: 10.1182/blood-2009-04-217604. [DOI] [PMC free article] [PubMed] [Google Scholar]
- 16.Calis JJ, Rosenberg BR. Characterizing immune repertoires by high throughput sequencing: strategies and applications. Trends Immunol. 2014 Oct 8;35(12):581–590. doi: 10.1016/j.it.2014.09.004. [DOI] [PMC free article] [PubMed] [Google Scholar]
- 17.Qi Q, Liu Y, Cheng Y, Glanville J, Zhang D, Lee JY, Olshen RA, Weyand CM, Boyd SD, Goronzy JJ. Diversity and clonal selection in the human T-cell repertoire. Proc Natl Acad Sci U S A. 2014 Sep 9;111(36):13139–44. doi: 10.1073/pnas.1409155111. [DOI] [PMC free article] [PubMed] [Google Scholar]
- 18.Meier J, Roberts C, Avent K, Hazlett A, Berrie J, Payne K, Hamm D, Desmarais C, Sanders C, Hogan KT, Archer KJ, Manjili MH, Toor AA. Fractal organization of the human T cell repertoire in health and after stem cell transplantation. Biol Blood Marrow Transplant. 2013 Mar;19(3):366–77. doi: 10.1016/j.bbmt.2012.12.004. [DOI] [PubMed] [Google Scholar]
- 19.Naumov YN, Naumova EN, Hogan KT, Selin LK, Gorski J. A fractal clonotype distribution in the CD8+ memory T cell repertoire could optimize potential for immune responses. J Immunol. 2003 Apr 15;170(8):3994–4001. doi: 10.4049/jimmunol.170.8.3994. [DOI] [PubMed] [Google Scholar]
- 20.Bolkhovskaya OV, Zorin DY, Ivanchenko MV. Assessing T cell clonal size distribution: a non-parametric approach. PLoS One. 2014 Oct 2;9(9):e108658. doi: 10.1371/journal.pone.0108658. [DOI] [PMC free article] [PubMed] [Google Scholar]
- 21.Freeman JD, Warren RL, Webb JR, Nelson BH, Holt RA. Profiling the T-cell receptor beta-chain repertoire by massively parallel sequencing. Genome Res. 2009 Oct;19(10):1817–24. doi: 10.1101/gr.092924.109. [DOI] [PMC free article] [PubMed] [Google Scholar]
- 22.Leventhal JR, Elliott MJ, Yolcu ES, Bozulic LD, Tollerud DJ, Mathew JM, Konieczna I, Ison MG, Galvin J, Mehta J, Badder MD, Abecassis MM, Miller J, Gallon L, Ildstad ST. Immune reconstitution/immunocompetence in recipients of kidney plus hematopoietic stem/facilitating cell transplants. Transplantation. 2015 Feb;99(2):288–98. doi: 10.1097/TP.0000000000000605. [DOI] [PubMed] [Google Scholar]
- 23.Toor AA, Kobulnicky JD, Salman S, Roberts CH, Jameson-Lee M, Meier J, Scalora A, Sheth N, Koparde V, Serrano M, Buck GA, Clark WB, McCarty JM, Chung HM, Manjili MH, Sabo RT, Neale MC. Stem cell transplantation as a dynamical system: are clinical outcomes deterministic? Frontiers in Immunology. 2014:5–613. doi: 10.3389/fimmu.2014.00613. [DOI] [PMC free article] [PubMed] [Google Scholar]
- 24.Li H, Durbin R. Fast and accurate long-read alignment with Burrows-Wheeler transform. Bioinformatics. 2010;26:589–595. doi: 10.1093/bioinformatics/btp698. [DOI] [PMC free article] [PubMed] [Google Scholar]
- 25.DePristo MA, Banks E, Poplin R, Garimella KV, Maguire JR, Hartl C, Philippakis AA, del Angel G, Rivas MA, Hanna M, McKenna A, Fennell TJ, Kernytsky AM, Sivachenko AY, Cibulskis K, Gabriel SB, Altshuler D, Daly MJ. A framework for variation discovery and genotyping using next-generation DNA sequencing data. Nat Genet. 2011;43:491–498. doi: 10.1038/ng.806. [DOI] [PMC free article] [PubMed] [Google Scholar]
- 26.Wang K, Li M, Hakonarson H. ANNOVAR: functional annotation of genetic variants from high-throughput sequencing data. Nucleic Acids Res. 2010;38:e164–e164. doi: 10.1093/nar/gkq603. [DOI] [PMC free article] [PubMed] [Google Scholar]
- 27.Hoof I, Peters B, Sidney J, Pedersen LE, Sette A, Lund O, Buus S, Nielsen M. NetMHCpan, a method for MHC class I binding prediction beyond humans. Immunogenetics. 2009;61:1–13. doi: 10.1007/s00251-008-0341-z. [DOI] [PMC free article] [PubMed] [Google Scholar]
- 28.Nielsen M, Lundegaard C, Blicher T, Lamberth K, Harndahl M, Justesen S, Røder G, Peters B, Sette A, Lund O, Buus S. NetMHCpan, a method for quantitative predictions of peptide binding to any HLA-A and -B locus protein of known sequence. PLoS ONE. 2007;2:e796. doi: 10.1371/journal.pone.0000796. [DOI] [PMC free article] [PubMed] [Google Scholar]
- 29.Hunsucker SA, McGary CS, Vincent BG, Enyenihi AA, Waugh JP, McKinnon KP, Bixby LM, Ropp PA, Coghill JM, Wood WA, Gabriel DA, Sarantopoulos S, Shea TC, Serody JS, Alatrash G, Rodriguez-Cruz T, Lizée G, Buntzman AS, Frelinger JA, Glish GL, Armistead PM. Peptide/MHC tetramer-based sorting of CD8+ T cells to a leukemia antigen yields clonotypes drawn nonspecifically from an underlying restricted repertoire. Cancer Immunol Res. 2015 Mar;3(3):228–35. doi: 10.1158/2326-6066.CIR-14-0001. [DOI] [PMC free article] [PubMed] [Google Scholar]
- 30.Klarenbeek PL, Remmerswaal EB, ten Berge IJ, Doorenspleet ME, van Schaik BD, Esveldt RE, Koch SD, ten Brinke A, van Kampen AH, Bemelman FJ, Tak PP, Baas F, de Vries N, van Lier RA. Deep sequencing of antiviral T-cell responses to HCMV and EBV in humans reveals a stable repertoire that is maintained for many years. PLoS Pathog. 2012 Sep;8(9):e1002889. doi: 10.1371/journal.ppat.1002889. [DOI] [PMC free article] [PubMed] [Google Scholar]
- 31.Klarenbeek PL, Tak PP, van Schaik BD, Zwinderman AH, Jakobs ME, Zhang Z, van Kampen AH, van Lier RA, Baas F, de Vries N. Human T-cell memory consists mainly of unexpanded clones. Immunol Lett. 2010 Sep 6;133(1):42–8. doi: 10.1016/j.imlet.2010.06.011. [DOI] [PubMed] [Google Scholar]
- 32.Yew PY, Alachkar H, Yamaguchi R, Kiyotani K, Fang H, Yap KL, Liu HT, Wickrema A, Artz A, van Besien K, Imoto S, Miyano S, Bishop MR, Stock W, Nakamura Y. Quantitative characterization of T-cell repertoire in allogeneic hematopoietic stem cell transplant recipients. Bone Marrow Transplant. 2015 Jun 8; doi: 10.1038/bmt.2015.133. [DOI] [PMC free article] [PubMed] [Google Scholar]
- 33.Vano JA, Wildenberg JC, Anderson MB, Noel JK, Sprott JC. Chaos in low-dimensional Lotka–Volterra models of competition. Nonlinearity. 2006;19:2391–2404. [Google Scholar]
- 34.van Heijst JW, Ceberio I, Lipuma LB, Samilo DW, Wasilewski GD, Gonzales AM, Nieves JL, van den Brink MR, Perales MA, Pamer EG. Quantitative assessment of T cell repertoire recovery after hematopoietic stem cell transplantation. Nat Med. 2013 Mar;19(3):372–7. doi: 10.1038/nm.3100. [DOI] [PMC free article] [PubMed] [Google Scholar]
- 35.Muraro PA, Robins H, Malhotra S, Howell M, Phippard D, Desmarais C, de Paula Alves Sousa A, Griffith LM, Lim N, Nash RA, Turka LA. T cell repertoire following autologous stem cell transplantation for multiple sclerosis. J Clin Invest. 2014 Mar;124(3):1168–72. doi: 10.1172/JCI71691. [DOI] [PMC free article] [PubMed] [Google Scholar]
- 36.Wrzesinski C, Restifo NP. Less is more: lymphodepletion followed by hematopoietic stem cell transplant augments adoptive T-cell-based anti-tumor immunotherapy. Curr Opin Immunol. 2005 Apr;17(2):195–201. doi: 10.1016/j.coi.2005.02.002. [DOI] [PMC free article] [PubMed] [Google Scholar]
- 37.Berrie JL, Kmieciak M, Sabo RT, et al. Distinct Oligoclonal T Cells Are Associated With Graft Versus Host Disease After Stem-Cell Transplantation. Transplantation. 2012;93(9):949–57. doi: 10.1097/TP.0b013e3182497561. [DOI] [PubMed] [Google Scholar]
- 38.Morris H, DeWolf S, Robins H, Sprangers B, LoCascio SA, Shonts BA, Kawai T, Wong W, Yang S, Zuber J, Shen Y, Sykes M. Tracking donor-reactive T cells: Evidence for clonal deletion in tolerant kidney transplant patients. Sci Transl Med. 2015 Jan 28;7(272):272ra10. doi: 10.1126/scitranslmed.3010760. [DOI] [PMC free article] [PubMed] [Google Scholar]
- 39.Emerson RO, Mathew JM, Konieczna IM, Robins HS, Leventhal JR. Defining the alloreactive T cell repertoire using high-throughput sequencing of mixed lymphocyte reaction culture. PLoS One. 2014 Nov 3;9(11):e111943. doi: 10.1371/journal.pone.0111943. [DOI] [PMC free article] [PubMed] [Google Scholar]
- 40.May RM. Biological populations with nonoverlapping generations: stable points, stable cycles, and chaos. Science. 1974 Nov 15;186(4164):645–7. doi: 10.1126/science.186.4164.645. [DOI] [PubMed] [Google Scholar]
- 41.May RM. Simple mathematical models with very complicated dynamics. Nature. 1976 Jun 10;261(5560):459–67. doi: 10.1038/261459a0. [DOI] [PubMed] [Google Scholar]
- 42.Stewart I. In Pursuit Of The Unknown, 17 Equations That Changed The World. Philadelphia, PA: Basic Books; 2012. The Imbalance of Nature Chaos Theory; p. 283. [Google Scholar]
- 43.Morrrison F. The Art of Modeling Dynamic Systems : Forecasting for Chaos, Randomness and Determinism. Dover publications; Mineola, NY: 2008. A classification scheme for dynamic systems; p. 165. [Google Scholar]
- 44.Susskind L, Friedman A. Quantum Mechanics. The Theoretical Minimum. New York, NY: Basic Books; 2014. Mathematical Interlude: Vector Spaces; pp. 24–28. [Google Scholar]
- 45.Susskind L, Friedman A. Quantum Mechanics. The Theoretical Minimum. New York, NY: Basic Books; 2014. Mathematical Interlude: Linear Operators; pp. 52–56. [Google Scholar]
- 46.Murray JD. Competition Models: Principle of Competitive Exclusion in Mathematical Biology. New York, NY: Springer; 2002. p. 94. [Google Scholar]
- 47.Gilpin ME, Ayala FJ. Global models of growth and competition. Proc Natl Acad Sci U S A. 1973 Dec;70(12):3590–3. doi: 10.1073/pnas.70.12.3590. [DOI] [PMC free article] [PubMed] [Google Scholar]
Associated Data
This section collects any data citations, data availability statements, or supplementary materials included in this article.