

Abstract
Glucose metabolism and mitochondrial function are closely interconnected with cellular redox-homeostasis. Although glucose starvation, which mimics ischemic condition or insufficient vascularization, is known to perturb redox-homeostasis, global and individual protein glutathionylation in response to glucose metabolism or mitochondrial activity remains largely unknown. In this report, we use our clickable glutathione approach, which form clickable glutathione (azido-glutathione) by using a mutant of glutathione synthetase (GS M4), for detection and identification of protein glutathionylation in response to glucose starvation. We found that protein glutathionylation is readily induced in HEK293 cells in response to low glucose concentrations when mitochondrial reactive oxygen species (ROS) are elevated in cells, and glucose is the major determinant for inducing reversible glutathionylation. Proteomic and biochemical analysis identified over 1,300 proteins, including SMYD2, PP2Cα, and catalase. We further showed that PP2Cα is glutathionylated at C314 in a C-terminal domain, and PP2Cα C314 glutathionylation disrupts the interaction with mGluR3, an important glutamate receptor associated with synaptic plasticity
Introduction
Mitochondria are the central organelle for cellular metabolism and their metabolic activity directly correlate with cellular fates, such as growth, differentiation, and apoptosis.1-3 Mitochondrial metabolism depends on various intracellular and extracellular conditions, including nutrient availability and oxygen concentrations. One of major nutrients is glucose that is degraded via glycolysis to pyruvate, which is further catabolized by Krebs cycle and oxidative phosphorylation in mitochondria for production of ATP. This mitochondrial metabolism is accompanied by a large consumption of oxygen and the concomitant production of reactive oxygen species (ROS), such as superoxide.4 About one or two percentage of oxygen consumed in mitochondria can form superoxide,5 which is detoxified by a combination of various redox enzymes, including superoxide dismutase, catalase, and glutathione peroxidase.4 However, when cells are subjected to glucose starvation that occurs in many cellular conditions, including ischemic cells or insufficient vascularization of tumor, mitochondrial ROS (mROS) are shown to increase due to imbalance of mitochondrial respiration or redox homeostasis.6
Glucose starvation decreases the production of NADPH due to the decreased flux of glucose to pentose phosphate pathway.6 NADPH is an essential source for removing ROS and maintaining the redox environment. Consequently, glucose starvation has shown to disturb the redox homeostasis by an increase of mROS, a decrease of NADPH, and an increase of a ratio of oxidized glutathione over reduced glutathione in cells.6, 7 This redox disturbance by glucose starvation induces various cellular processes. For example, glucose starvation initiates the conversion of anabolism to catabolic activity,8 induces autophagy for using biomass as an energy source,8, 9 stimulates migration and angiogenesis for vascularization,10, 11 and results in apoptosis when metabolic stress is severe.12 Importantly, many of these cellular pathways are partially regulated by mechanisms involving mROS-mediated redox regulation.12, 13
Although mROS were once thought as inevitable by-products of respiration, they are now increasingly considered the key regulatory signaling molecules that link mitochondrial metabolism to diverse cellular signaling pathways.14-16 For example, mROS in a low level induced by hypoxia are key signaling molecules that activate hypoxia-inducible factor α (HIF-α),17 which regulates metabolic adaptation and angiogenesis.15 A moderate level of mROS is implicated in activation of inflammation,18 and a high level of mROS induces autophagy and apoptosis by regulating autophagy-related 4A (ATG4)19 and c-Jun-N-terminal kinase (JNK) signaling pathway, respectively.20 An uncontrolled production of mROS is associated with various age-associated diseases.21 One major mechanism of action of ROS in biological processes is oxidation of protein cysteine residues into various oxoforms, including disulfide, sulfenic, sulfinic, and sulfonic acid.22 Among various oxoforms, glutathionylation is the disulfide formation of a protein cysteine residue with glutathione.23 Numerous studies have demonstrated that glutathionylation serves as an important regulatory switch of protein function in response to ROS in physiological redox signaling and pathological diseases.23
Despite the fact that glucose starvation induces redox disturbance or various cellular processes mediated by mROS,6, 7 the identity and dynamic reversibility of protein glutathionylation in response to glucose metabolism remain unknown. Recently, we reported the chemical approach for chemoselective detection of protein glutathionylation by using glutathione synthetase mutant (GS M4).24 GS M4 catalyzed azido-Ala in place of Gly, which produced clickable glutathione (γGlu-Cys-azido-Ala, azido-glutathione) in situ in cells upon transfection of GS M4 and incubation of azido-Ala (Fig. 1).24 In response to ROS, azido-glutathione is glutathionylated on proteins, and the subsequent click reaction allows for identifying glutathionylated proteins (Fig. 1).24 With this clickable glutathione approach, we report here that protein glutathionylation is readily induced in response to no or low glucose conditions when mROS are elevated in cells by treatment of electron transport chain blockers, and glucose is the major determinant for reversibility of protein glutathionylation. Proteomic analysis identified over 1,300 proteins in response to glucose starvation, which includes many metabolic enzymes and cytosolic signaling enzymes, such as kinases and phosphatases. We confirmed newly identified proteins for glutathionylation, including SET and MYND domain-containing protein 2 (SMYD2), Ser/Thr protein phosphatase 2Cα (PP2Cα), and catalase, and further characterized glutathionylation of PP2Cα for functional change.
Fig. 1. A flow of clickable glutathione approach for detecting glutathionylation.

Incubation of azido-Ala forms azido-glutathione (γGlu-Cys-azido-Ala) in situ in HEK293 cells stably expressing GS M4, which catalyzes azido-Ala in place of Gly. In response to stimulus, the subsequent click reaction allows for identifying glutathionylated proteins.
Materials and methods
Cell culture and assays
HEK293/GSM4 cell line, which is stably overexpressing glutathione synthetase mutant 4 (GS M4), was prepared according to a stable cell generation protocol. Briefly, after transfection of GS M4, HEK293 cells expressing GS M4 was selected and grown in the presence of hygromycin B (100 μg/mL). FLAG-tagged GS M4 expression in HEK293/GS M4 cells was confirmed by Western blotting with anti-FLAG antibody. Cells were maintained in DMEM (high glucose) with 10% fetal bovine serum (FBS), penicillin (100 units/mL), streptomycin (100 μg/mL), and hygromycin B (100 μg/mL) at 37°C in 5% CO2 humidified incubator. PP2Cα wild type and mutant plasmids were transfected using PEI-max at 80% confluency in DMEM without FBS/antibiotics. Cells with or without transfection were incubated with 0.5 mM L-azido-alanine (azido-Ala) for 20 h. Cells were then washed with PBS once, and incubated for serum-starvation for 4 h in the presence of azido-Ala (0.25 mM). After washing with PBS, cells were incubated with and without antimycin A or rotenone in glucose-free (glucose starvation) or glucose-containing DMEM for different time points. For deglutathionylation, glucose (5 mM), pyruvate (5 mM), or lactate (10 mM) was added for another 2 h. Cells were lysed using a lysis buffer [Tris HCl 100 mM, NaCl 150 mM, pH 7.4, 0.1% Tween 20, a protease inhibitor cocktail tablet, 100 μM PMSF and 50 mM N-ethylmaleimide (NEM)]. After incubation for 0.5 h at 4°C and centrifugation at 14,000 rpm, the cell lysates were collected and protein concentration was measured by Bradford assay.
Click reaction and biotin pull down
Lysates (100 μg), prepared by addition of NEM during cell lysis, were precipitated by cold acetone (1:4 by volume) for 30 min in -20°C. Samples were then centrifuged at 14,000 rpm for 3 min, and the pellet was re-dissolved in click buffer (0.1 M Tris-HCl pH 7.4) by sonicating for 5 seconds. Click reaction was performed as described in the previous study.24 Briefly, click reaction was carried out for 1 h at room temperature with biotin-alkyne (0.2 mM) or rhodamine alkyne (0.2 mM) in the presence of CuBr (1 mM) and Tris[(1-benzyl-1H-1,2,3-triazol-4-yl)methyl]amine (TBTA) (0.4 mM). Click reaction was terminated by adding a SDS-loading buffer and proteins were separated by SDS-PAGE. Glutathionylated proteins were visualized by in-gel fluorescence or Western blotting using streptavidin-HRP. For pull down experiments, after click reaction, all the proteins were precipitated by cold acetone, centrifuged, and washed once with cold methanol. The precipitate was completely dissolved in PBS containing 1.2% SDS, and further diluted ten times with PBS before incubating with streptavidin agarose beads (100 μL) at room temperature for 3 h. Beads were washed extensively with PBS and finally with water. Proteins on beads were eluted by a SDS-loading buffer, separated by SDS-PAGE, transferred to PVDF membrane, and probed with various primary antibodies. Alternatively, proteins on beads were digested by trypsin, and eluted for LC-MS/MS analysis.
LC/LC-MS/MS analysis
The streptavidin agarose beads after enrichment were pelleted and washed twice by Dulbecco’s phosphate-buffered saline (DPBS). After resuspending in 50 μL 6 M urea/PBS, the beads were incubated at room temperature for 1 h. 100 μL DPBS was then added to dilute urea to a final concentration of 2 M. On-bead trypsin digestion was performed overnight at 37 °C with sequencing-grade trypsin (2 μg) and 1 mM CaCl2 (100 mM stock in water). The peptide digests were centrifuged and the supernatants were collected. The beads were washed twice with water (2 × 75 μL). All supernatants and washes were combined and acidified with 15 μL formic acid. The samples were stored at −20 °C until mass spectrometry analysis. LC/LC-MS/MS analysis was performed on an Agilent 1200 series HPLC coupled to an LTQ-Orbitrap Discovery mass spectrometer (ThermoFisher). Peptide digests were pressure loaded onto a 250 μm fused silica desalting column packed with 4 cm of Aqua C18 reverse-phase resin (Phenomenex). The peptides were eluted onto a biphasic column (100 μm fused silica with a 5 μm tip, packed with 10 cm Aqua C18 reverse-phase resin (Phenomenex) and 3 cm Partisphere strong-cation-exchange resin (SCX, Whatman) using a gradient of 5-100% Buffer B in Buffer A (Buffer A: 95% water, 5% acetonitrile, 0.1% formic acid; Buffer B: 20% water, 80% acetonitrile, 0.1% formic acid). The peptides were then eluted from the SCX onto the C18 resin and into the mass spectrometer using four salt steps as previously described.25 The flow rate through the column was set to ~0.25 L/min and the spray voltage was set to 2.75 kV. One full MS scan (FTMS) (400-1800 m/z) was followed by 18 data dependent scans (ITMS) of the nth most intense ions with dynamic exclusion enabled. The generated tandem MS data was searched using the SEQUEST algorithm against the human UniProt database. SEQUEST output files were filtered using DTASelect 2.0.25 Glutathionylated proteins with two or higher fold enrichment were selected and analyzed using DAVID functional annotation tool. The mass spectrometry proteomics data have been deposited to the ProteomeXchange Consortium via the PRIDE [1] partner repository with the dataset identifier PXD004026.
Coimmunoprecipitation and immunoblotting analyses
HEK293/GSM4 cells were transfected with PP2Cα WT and C314S mutant and incubated for glucose starvation with antimycin A. Cells were then lysed using a lysis buffer without NEM. Lysates (1 mg/0.5 mL) were incubated with mouse mGluR3 primary antibody (3 μg) at 4°C for 1 h, mixed with pre-washed protein G agarose beads (30 μL), and incubated overnight at 4°C. Beads were then washed three times with PBST (0.1% Tween 20) for 10 min each time. Beads were eluted with a SDS-loading buffer in the presence of β-mercaptoethanol. Eluted proteins were separated by SDS-PAGE, transferred to PVDF membrane, and incubated with primary mouse mGluR3 or rabbit PP2Cα antibodies in a TBST buffer (Tris HCl 50 mM, NaCl 150 mM, 0.1% Tween 20, 3% BSA) overnight at 4°C. HRP-conjugated light chain specific secondary mouse and rabbit antibodies were incubated for 1 h at room temperature. After washing 3 times with a TBST buffer, immunoprecipitated proteins were visualized by chemiluminescence.
Results and discussion
Clickable glutathione is catalyzed by enzymes implicated in glutathionylation
In order to analyze the reversible change of protein glutathionylation in response to glucose metabolism, we begin to determine whether clickable glutathione can detect the reversible change of glutathionylation. Glutathionylation can occur by non-enzymatic reactions of protein cysteine residues with glutathione in the presence of ROS.26 However, redox enzymes may facilitate formation of glutathionylation. Glutathione-S-transferase pi (GSTP) was shown to catalyze formation of glutathionylation.27 Deglutathionylation (reduction of glutathionylation) can occur by non-enzymatic reactions. However, glutaredoxin 1 (Grx1), together with glutathione reductase (GR), catalyzes deglutathionylation with about 1,000-fold higher rate than glutathione alone.26 Also, glutathione-S-transferase omega (GSTO) was recently shown to catalyze deglutathionylation.28 A few other redox enzymes, such as thioredoxin and sulfiredoxin, may contribute to deglutathionylation although their specificity for deglutathionylation is low.26, 29
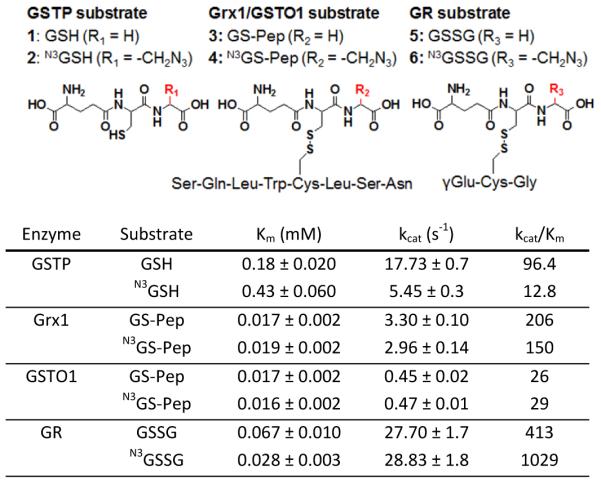
Despite the small size of azido-group in glutathione, it may interfere with enzyme-mediated (de)glutathionylation.23 In order to determine whether azido-glutathione can be used as a substrate of major enzymes involved in glutathionylation, we have prepared substrates of Grx1, GSTO1, GR, and GSTP that contain either endogenous glutathione (GSH) or azido-glutathione (N3GSH) for kinetic comparisons (Table 1 and Scheme S1). The model peptides (SQLWCLSN)28 glutathionylated by GSH or N3GSH were prepared and assayed for deglutathionylation by Grx1 and GSTO. Disulfides of GSH (GSSG and N3GSSG) were used for substrate of GR. In the kinetic data in Table 1 and Figure S1, it is notable that Grx1, GSTO1, and GR catalyzed both GSH- and N3GSH-containing substrates with the similar values of Km and kcat. This shows that the small size of azide-group could be tolerated not only by Grx1 and GSTO1 that have broad substrate specificity,28, 29 but also by GR that is relatively specific to GSSG. The exception was GSTP, which showed an 8-fold lower catalytic efficiency with N3GSH versus GSH. This suggests that GSTP may not catalyze azido-glutathione efficiently. However, note that there is no direct assay for GSTP-mediated glutathionylation, and GSTP assay (1-chloro-2,4-dinitrobenzene alkylation) in this study may not represent the reaction of glutathionylation. Overall, these kinetic data support our previous analysis in which azido-glutathione detected the reversible change of glutathionylation in response to hydrogen peroxide in HEK293 cells.24
Table 1.
Kinetic comparison of substrates containing glutathione (GSH) or azido-glutathione (N3GSH) for redox enzymes involved in glutathionylation. GS-Pep and N3GS-Pep: Cys in Pep (SQLWCLSN) forms disulfide with GSH and N3GSH, respectively. GSSG and N3GSSG: disulfide of GSH with GSH and N3GSH, respectively. Kinetic values in this table are comparable with previously reported values for Grx1,30 GSTO,28 GSTP,31 and GR.32
|
Glucose starvation in combination with mROS production readily induces glutathionylation
Next, we evaluated whether glutathionylation can be induced in response to glucose starvation. HEK293/GS M4 cell line (HEK293 cells with stable transfection of GS M4) was prepared, and an incubation of azido-Ala to HEK293/GS M4 cell line for 20 h resulted in an approximately 1:1 ratio of endogenous glutathione and clickable glutathione (Fig. S2). After incubation of azido-Ala for 20 h and serum starvation for 3 h, cells were incubated in glucose-free medium for 2 h. After click reaction with rhodamine-alkyne, in-gel fluorescence analysis did not detect the significant glutathionylation at this stage (Fig. 2A, lane 1 vs. 2, and S3A). In addition, depletion of glutamine, which can be an alternative nutrient for NADPH production,33 did not induce significant glutathionylation (Fig. S3B). Then, we treated cells with the mitochondrial electron transport chain blockers (antimycin A or rotenone) that increase mROS production.34 Both antimycin A and rotenone stimulate mitochondrial dysfunction and increase mROS by inhibiting complex III and complex I, respectively.34 Interestingly, glucose starvation with an increasing dose of antimycin A induced a high level of global glutathionylation (Fig. 2B). The glutathionylation signals were insignificant at 0.5 h, but become stronger at 1-2 h (Fig. 2A, lane 4-6). Similarly, glucose starvation with rotenone rapidly induced a high level of glutathionylation (Fig. S3D). In contrast, antimycin A alone in high glucose concentration (25 mM) did not induce significant glutathionylation within 2 h (Fig. 2A, lane 2 vs. 3, and S3C). In the same context, the level of ROS was slightly increased by glucose starvation or antimycin A alone, but more significantly increased by glucose starvation with incubation of antimycin A (Fig. S4A). In this condition, the level of reduced glutathione was decreased significantly while the level of Grx1 increased (Fig. S4C and S4D). Similarly, the viability was minimally decreased by either glucose starvation or antimycin A alone, but significantly reduced in their combination after 24 h (Fig. S4B), which is in agreement with previous report.6 Overall, these data suggest that glucose depletion can cause significant glutathionylation in mROS-elevated cells.
Fig. 2. Protein glutathionylation is highly dependent on glucose metabolism in the presence of the electron transport chain blocker.

After incubation of azido-Ala to HEK293/GS M4 cells for 20 h, cells were subjected to the following stimulus: (A) glucose starvation with antimycin A in a time-dependent manner, (B) glucose starvation with an increasing concentration of antimycin A, (C) decreasing glucose concentrations with antimycin A, and (D) increasing incubation time of antimycin A in a physiological glucose concentration (5 mM). After stimulus, cell lysates were subjected to click reaction with rhodamine-alkyne, and analyzed for fluorescence and Coomassie stain.
Importantly, the intensity of glutathionylation was inversely dependent on availability of glucose in mROS-elevated (antimycin A-treated) cells (Fig. 2C). Glutathionylation was weak in a high glucose concentration (25 mM), but clearly increased in a range of physiological and hypoglycemic conditions (glucose < 5 mM) (Fig. 2C and 2A). Similarly, an incubation of antimycin A alone induced an increased level of glutathionylation in physiological glucose concentration (~5 mM) in a time-dependent manner (Fig. 2D). Also, glutathionylation induced by antimycin A was further increased by addition of 2-deoxyglucose (2-DG), which blocks glycolysis, in a physiological glucose concentration (~5 mM) (Fig. S5). Overall, these data show that electron transport chain blockers that increase mROS can induce many protein glutathionylation in physiological glucose concentration, but the level of glutathionylation can be decreased or increased in high or low glucose concentration, respectively.
Glucose availability controls the reversibility of protein glutathionylation
Because global glutathionylation is likely to be induced by disruption of redox balance in response to low or no glucose, we then analyzed whether re-addition of glucose will restore glutathionylation back to a low level. After inducing a high level of glutathionylation by glucose starvation with antimycin A for 2 h, the direct addition of glucose induced the rapid deglutathionylation over 2 h (Fig. 3A, lane 2 and 6-8), indicating dynamic reversibility of glutathionylation by metabolic change. Interestingly, the similar deglutathionylation was observed by addition of pyruvate (Fig. 3A, lane 2-5), which is a glycolytic product of glucose. Pyruvate may be used as a metabolic intermediate or a direct scavenger of ROS.35 However, addition of lactate,36 a reduced metabolite of pyruvate, did not induce deglutathionylation significantly (Fig. 3B). Overall, these data further support that glucose metabolism or its availability is a major determinant for inducing reversible protein glutathionylation in response to mROS production.
Fig. 3. Glutathionylation is reversed by re-addition of glucose.
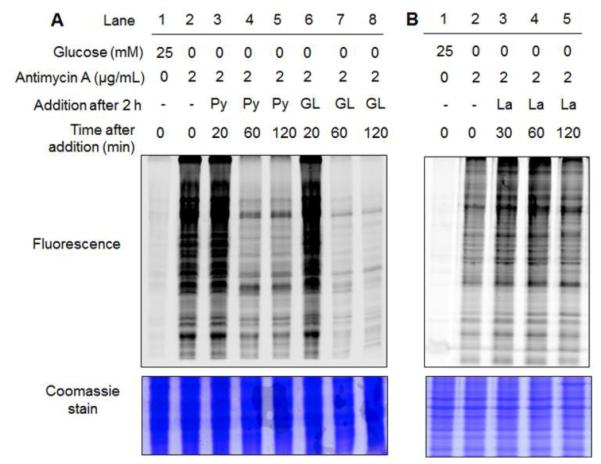
After incubation of azido-Ala to HEK293/GS M4 cells for 20 h, glutathionylation was induced by glucose starvation with treatment of antimycin A for 2 h. Subsequently, (A) glucose (GL, 5 mM), pyruvate (Py, 5 mM) or (B) lactate (La, 10 mM) was individually added to the cells for the indicated time period. Cell lysates were subjected to click reaction with rhodamine-alkyne, and analyzed for fluorescence and Coomassie stain.
Identification of glutathionylated proteins in response to glucose starvation with mROS production
The strong signals induced by glucose starvation with treatment of antimycin A indicate numerous potential proteins that can be glutathionylated in response to mROS production in low glucose concentration. We then analyzed the identity of glutathionylated proteins. After click reaction with biotin-alkyne, glutathionylated proteins were bound to streptavidin-beads, extensively washed in order to minimize the non-specific binders, eluted, run on a gel, and detected by silver staining (Fig. 4A). The strong signals, indicative of glutathionylation, were observed in glucose starvation with antimycin A treatment (Fig. 4B, lane 4). In control, the relatively weak intensity of bands was observed with glucose, glucose starvation, or antimycin A alone (Fig. 4B, lane 1-3). Proteins in lane 1 (negative) and 4 (positive) in Figure 4B were digested by trypsin on beads, and analyzed by LC-MS/MS (Fig. 4A). Mass analysis identified 278 and 1493 potential candidate proteins of glutathionylation in lane 1 (negative) and 4 (positive), respectively (Fig. 4C and Supplementary Data). Importantly, 1383 out of 1493 identified proteins (92.6%) have two or higher fold increases of the spectral counts (defined as the total number of fragmentation spectra identified for a protein)37 in the positive versus negative control (average spectral count of at least 3 replicates) while 1291 out of 1493 identified proteins (86.4%) have over 10-fold higher spectral counts in the positive versus negative control (Fig. S6 and Supplementary Data).
Fig. 4. Proteomic analysis of glutathionylated proteins.

(A) Approach for pull-down and mass analysis: after click reaction with biotin-alkyne, glutathionylated proteins enriched by streptavidin-agarose were eluted for silver staining or directly digested on-beads for LC-MS/MS analysis. (B) Analysis of enriched proteins in indicated conditions. (C) The number of glutathionylated proteins in indicated conditions by LC-MS/MS. ‘Positive’ and ‘negative’ indicate proteins enriched in lane 4 and 1, respectively, in Figure 4B. (D) DAVID gene ontology (GO) analysis of identified glutathionylated proteome. (E-F) Comparison of glutathionylated proteins in glucose starvation/antimycin A with previous proteomic data of glutathionylome (E) or sulfenylome (F) by treatment of exogenous H2O2.
1383 proteins that showed two or higher-fold increases of spectral counts in the positive versus negative control were categorized by DAVID software38 for cellular localization, molecular function, and cellular processes (Fig. 4D). Glutathionylated proteins are found in all major cellular compartments, most significantly in cytosol, and they are implicated in various cellular processes, including RNA processing, cell cycle, proteolysis, translation, stress response, glucose metabolism, and apoptosis (in the order of a decreasing –log10P value) (Fig. 4D). We also compared our identified proteins with previous proteomic analysis of 913 glutathionylated proteins in HEK293 cells induced by hydrogen peroxide (1 mM),39 which showed about 31 percentage of target proteins (434 out of 1383 proteins) overlapped in two experiments (Fig. 4E). Recently, Yang et al. reported over 600 sulfenylated proteins in RKO cells in response to hydrogen peroxide (0.5 mM).40 Because sulfenylation is one potential intermediate prior to forming glutathionylation,26 we also compared our identified proteins with sulfenylation proteomic analysis, which showed that about 21 percentage of glutathionylated proteins (285 out of 1383 proteins) in our analysis were found in sulfenylation mass analysis (Fig. 4F). This shows the significant overlapping and non-overlapping target proteins involved in sulfenylation and glutathionylation. The non-overlapping target proteins may result from different routes of forming glutathionylation versus sulfenylation, or the different target proteins of cysteine oxidation depending on cell type or stimulus, i.e. hydrogen peroxide vs. glucose starvation with treatment of antimycin A. About 120 selected proteins that have high spectral counts and high enrichment in the positive over negative sample were listed with DAVID gene ontology (GO) analysis, and in comparison with the previous proteomic results of glutathionylation39 and sulfenylation40 (Table S1).
Confirming identity and reversibility of individual proteins for glutathionylation
We further confirmed the identity of several glutathionylated proteins by pull-down and Western blotting. Glutathionylation was induced by an increasing incubation time (0-2 h) of glucose starvation with treatment of antimycin A. After enrichment of all glutathionylated proteins by streptavidin-agarose, the eluted sample was probed with various antibodies. A time-dependent increase of glutathionylation was observed with individual proteins (Fig. 5A). Glutathionylation of heat shock protein 90 (Hsp90), actin, catalase, and SMYD2 was clearly observed within 1 h. On the other hand, glutathionylation became obvious within 2 h for protein tyrosine phosphatase 1B (PTP1B), Src-homology phosphatase 2 (SHP2), AMP-activated kinase (AMPK), and protein phosphatase 2Cα (PP2Cα) (Fig. 5A). This time-dependent glutathionylation may result from the different protein abundance or redox-sensitivity of individual proteins. Notably, to our knowledge, this is the first report of detecting glutathionylation of SMYD2, PP2Cα, and catalase in gel analysis. We further analyzed the reversibility of several selected proteins for deglutathionylation upon addition of pyruvate. Deglutathionylation of PTP1B, AMPK, PP2Cα, and catalase were readily observed within 1 h, but actin glutathionylation was less significantly reduced at the identical condition (Fig. 5B). Overall, this data not only identified glutathionylated proteins, but also analyzed the time-dependent reversibility of glutathionylation for individual proteins in response to glucose metabolism.
Fig. 5. Identification of glutathionylated proteins by pull-down and Western blotting.

(A) After incubation of azido-Ala to HEK293/GS M4 cells for 20 h, cells were subjected to glucose starvation with antimycin A in a time-dependent manner. (B) After glucose starvation with treatment of antimycin A for 2 h, pyruvate was added to cells. After click reaction with biotin-alkyne, the individual proteins were probed by specific antibodies before and after pull-down by streptavidin-agarose.
PP2Cα glutathionylation and functional change
PP2Cα is a prototype of the conserved metal-dependent serine or threonine phosphatases (PPM), which catalyzes dephosphorylation by magnesium or manganese-coordinated water.41 In contrast to other serine or threonine phosphatase (PP1, PP2A, and PP2B), a class of PP2C act as an monomer, and the activity may be regulated by cell-type specific expression, post-translation modification, and protein degradation.42 PP2Cα plays a role in inhibition of cellular proliferation, metastasis and migration, and stress signaling by dephosphorylating various substrates, including p38, MAPK, AMPK, Smad2/3, and Nf-kB.42 PP2Cα also directly bind and dephosphorylate metabotropic glutamate receptor 3 (mGluR3),43 which is involved in protection of neural cells against glutamate excitotoxicity44 and important for synaptic plasticity and cognitive functions in prefrontal cortex.45 Due to the importance of mROS for etiology of various age-associated diseases,46 we further evaluated the cysteine modification site and functional effects of PP2Cα glutathionylation.
There are 11 cysteine residues in PP2Cα, and the examination of the available crystal structure (PDB:4RA2) predicted the potential cysteine modification sites, including C204 and C314 that have the solvent accessibility, and C238 that is in the proximity to the active site (Fig. 6A). Therefore, we made individual cysteine-to-serine mutants of PP2Cα, and transfected PP2Cα wild-type (WT) and mutants to HEK293/GS M4 stable cells. Glucose starvation and antimycin A significantly induced glutathionylation of PP2Cα WT (Fig. 6B, lane 1 vs. 2) while inducing global glutathionylation (Fig. S7). The similar level of glutathionylation was observed with PP2Cα C204S or C238S (Fig. 6B, lane 2-4). In contrast, PP2Cα C314S mutant significantly reduced the signal of glutathionylation (Fig. 6B, lane 2 vs. 5), indicating that C314 is the major modification site.
Fig. 6. The cysteine modification site and functional role of PP2Cα glutathionylation.

(A) The structure (PDB:4RA2) and domains of PP2Cα that shows three cysteine residues, C204 and C314 that are exposed to solvent, and C238 that is close to the active site. Two manganese atoms (purple) and a phosphate (red) in active site are shown in space-filling model. (B) PP2Cα C314 is the major cysteine residue for glutathionylation. After inducing glutathionylation in HEK293/GS M4 cells transfected with HA-PP2Cα WT and mutants, cell lysates were subjected to click reaction with biotin-alkyne. HA-PP2Cα was probed before (bottom) and after (top) pull-down by streptavidin-agarose. (C) PP2Cα glutathionylation disrupts its interaction with mGluR3. With and without inducing glutathionylation, PP2Cα and mGluR3 were co-immunoprecipitated and probed by individual antibodies.
C314 is exposed to solvent and in a 3.5 Å distance with K310 side chain (Fig. 6A), which may increase its reactivity. C314 is located in a small C-terminal domain, apart from the catalytic site (Fig. 6A). This C-terminal domain may not contribute to the catalytic activity, but it may regulate the substrate specificity.47 PP2Cα is reported to be an upstream phosphatase for AMPK,48 which is a stress-sensing kinase for metabolic adaptation. Therefore, we examined phosphorylation of AMPK after overexpression of PP2Cα WT and mutants. Phosphorylation of AMPK was strongly induced in glucose starvation and antimycin A (Fig. S8A). However, AMPK phosphorylation levels were not significantly changed among cells transfected by PP2Cα WT and mutants (Fig. S8A), indicating that PP2Cα glutathionylation may not affect its enzymatic activity. However, it is previously reported that PPM1E rather than PP2Cα (PPM1A) is the major phosphatase for AMPK in HEK293 cells.49 Therefore, we evaluated the enzymatic activity of purified PP2Cα in vitro upon addition of oxidized glutathione (GSSG), which did not change PP2Cα dephosphorylation activity significantly (Fig. S8B). Next, we evaluate whether PP2Cα glutathionylation can disrupt its protein interaction with mGluR3. Co-immunoprecipitation with and without transfection of PP2Cα showed that glucose starvation with treatment of antimycin A, which induce glutathionylation of PP2Cα, disrupted the interaction of PP2Cα WT and mGluR3 (Fig. 6C, lane 1 vs. 2 and 3 vs. 4). In contrast, the interaction of PP2Cα C314S with mGluR3 remained relatively similar with and without glucose starvation/antimycin A (Fig. 6C, lane 5 vs. 6). These data suggest that PP2Cα C314 glutathionylation disrupts its interaction with mGluR3.
Conclusion
Glutathione is a major thiol in cells for redox homeostasis. Therefore, global protein glutathionylation can represent the cellular redox disturbance. Despite the importance of glucose metabolism and mitochondrial activity for regulating cellular redox state, global and individual protein glutathionylation in response to glucose metabolism or mROS remained unknown. In this report, we used our clickable glutathione approach, which routes the glutathione biosynthesis to formation of clickable glutathione by using glutathione synthetase mutant,24 for determining identity and reversibility of glutathionylated proteins in response to glucose metabolism with mROS production. Our approach provides the small chemical tag in glutathione that can be utilized for subsequent biochemical analysis, including proteomic analysis and in-gel analysis.24 We showed in this report that this small azide tag introduced in glutathione can be tolerated by several redox enzymes implicated in glutathionylation (Table 1), supporting its use in analyzing the reversible glutathionylation.
Our analyses shows that glutathionylation is readily induced in response to antimycin A in physiological glucose concentration (~5 mM), and further increased in no or low glucose conditions, but decreased in high glucose conditions (Fig. 2). In glucose starvation with antimycin A that induces glutathionylation, the cellular redox state was disturbed with an increased level of ROS, a decreased level of reduced glutathione, and an increased level of Grx1. Antimycin A blocks the ubiquinone binding site (Qi) in complex III, which is the major site for superoxide production,34 and its treatment triggers mitochondrial dysfunction. Therefore, Antimycin A and rotenone have been extensively used as pharmacological tools for producing mitochondrial ROS in numerous cell types, including cancer,50 muscle,51 and neuronal cells.52 They are also used for mimicking mitochondrial dysfunction in various pathophysiologic models, including aging,53, 54 Parkinson disease,52, 55 cancer,50 respiratory disease,56 and cardiac damage.57 Aging and pathological diseases, including cancer, are frequently accompanied with mitochondrial DNA mutations, which often increase mROS production.58 In this regard, our data suggest that many glutathionylated proteins may be induced in mROS-elevated pathologic conditions (mitochondrial dysfunction) while the level of glutathionylation can be either decreased in cells that avidly take up a high glucose (e.g. cancer cells) or increased in glucose-limited cells (e.g. ischemia). In such conditions, individual protein glutathionylation is likely to affect its functions, thereby contributing to the mechanistic link between mROS and pathophysiological cellular phenotypes.
Numerous data have shown that high glucose metabolism in cancer cells is tuned for their survival with an increased production of NADPH59, 60 while glucose starvation depletes the production of NADPH, resulting in low viability of cancer cells.6, 61 Although we have not determined the level of NADPH in our study, it is likely that glucose availability changes the level of glutathionylation in our data, possibly via altering NADPH production. In contrast, it is worth noting that hyperglycemia is known to increase mROS production by increasing metabolic input (e.g. pyruvate or NADH) to mitochondria and overwhelming the electron transport chain activity.62, 63 Thus, a persisted hyperglycemic diabetic condition disturbs the redox state of cells, inducing protein glutathionylation.64 Overall, this suggests that many factors, including glucose concentrations and duration of exposure to high glucose, can influence the level of mROS and glutathionylation.
Our proteomic analysis identified over 1,300 glutathionylated proteins involved in various cellular processes (Fig. 4). Many of identified proteins are overlapped with previously reported glutathionylated proteins and sulfenylated proteins induced by addition of exogenous hydrogen peroxide (Fig. 4E and 4F), suggesting the fundamental redox-sensitivity of overlapped proteins even in different stimulus. While further validation of individual proteins may be necessary, our data provide the identity of potential glutathionylated proteins in response to mROS production in a low glucose condition. While confirming selected proteins for glutathionylation in gel analysis (Fig. 5), we further determined the cysteine modification site and functional change of PP2Cα glutathionylation (Fig. 6), and showed that PP2Cα C314 glutathionylation disrupts the interaction with mGluR3. mGluR3 is expressed in pre- and post-synaptic cells and astrocyte where it attenuates the glutamate, a neurotransmitter, signaling.44 A high level of glutamate exerts excitotoxicity and induces neuronal cell death in which mGluR3 plays a role for protection of synaptic cells and astrocyte.44 In addition, mGluR3 activation is important for synaptic plasticity, in particular for long-term depression, and it improves cognitive functions, including extinction learning.45 Therefore, malfunction or single-nucleotide polymorphism (SNP) of mGluR3 is closely associated with psychiatric disorders, such as schizophrenia.65 Although the functional importance of mGluR3 phosphorylation and interaction with PP2Cα is, to our knowledge, not yet clearly understood, it is notable that other mGluR (mGluR1 and 2) phosphorylation is involved in desensitization of mGluR.66 Therefore, mGluR3 and PP2Cα interaction may be important for dephosphorylation and sensitization of mGluR3, and disruption of mGluR3 and PP2Cα interaction upon glutathionylation may contribute to decreasing mGluR3 signaling.
Supplementary Material
Acknowledgements
This work was supported by Wayne State University Start-up fund and WSU University Research Grant (Y.H.A) and NIH grant 1R01GM118431-01A1 (E.W.). We thank Wayne State University Proteomic Facility for helping proteomic data analysis, and Chemistry Luminogen Instrument Center for instrumental help. We thank Dr. Ashok Bhagwat and his group members (WSU) for providing the help and instrument for cell viability assays. We thank Dr. Young-Tae Chang (NUS) for providing a plasmid of GSTO1.
Footnotes
Electronic Supplementary Information (ESI) available: [These data include syntheses of glutathione-containing substrates, enzyme kinetic data, proteomic data and other characterization described in this article].
References
- 1.Antico Arciuch VG, Elguero ME, Poderoso JJ, Carreras MC. Antioxid Redox Signal. 2012;16:1150–1180. doi: 10.1089/ars.2011.4085. [DOI] [PMC free article] [PubMed] [Google Scholar]
- 2.Mason EF, Rathmell JC. Bba-Mol Cell Res. 2011;1813:645–654. doi: 10.1016/j.bbamcr.2010.08.011. [DOI] [PMC free article] [PubMed] [Google Scholar]
- 3.Wanet A, Arnould T, Najimi M, Renard P. Stem Cells Dev. 2015;24:1957–1971. doi: 10.1089/scd.2015.0117. [DOI] [PMC free article] [PubMed] [Google Scholar]
- 4.Murphy MP. Biochem J. 2009;417:1–13. doi: 10.1042/BJ20081386. [DOI] [PMC free article] [PubMed] [Google Scholar]
- 5.Boveris A, Chance B. Biochem J. 1973;134:707–716. doi: 10.1042/bj1340707. [DOI] [PMC free article] [PubMed] [Google Scholar]
- 6.Ahmad IM, Aykin-Burns N, Sim JE, Walsh SA, Higashikubo R, Buettner GR, Venkataraman S, Mackey MA, Flanagan SW, Oberley LW, Spitz DR. J Biol Chem. 2005;280:4254–4263. doi: 10.1074/jbc.M411662200. [DOI] [PubMed] [Google Scholar]
- 7.Blackburn RV, Spitz DR, Liu X, Galoforo SS, Sim JE, Ridnour LA, Chen JC, Davis BH, Corry PM, Lee YJ. Free Radical Bio Med. 1999;26:419–430. doi: 10.1016/s0891-5849(98)00217-2. [DOI] [PubMed] [Google Scholar]
- 8.Kaur J, Debnath J. Nat Rev Mol Cell Bio. 2015;16:461–472. doi: 10.1038/nrm4024. [DOI] [PubMed] [Google Scholar]
- 9.Filomeni G, De Zio D, Cecconi F. Cell Death Differ. 2015;22:377–388. doi: 10.1038/cdd.2014.150. [DOI] [PMC free article] [PubMed] [Google Scholar]
- 10.De Saedeleer CJ, Porporato PE, Copetti T, Perez-Escuredo J, Payen VL, Brisson L, Feron O, Sonveaux P. Oncogene. 2014;33:4060–4068. doi: 10.1038/onc.2013.454. [DOI] [PubMed] [Google Scholar]
- 11.Marjon PL, Bobrovnikova-Marjon EV, Abcouwer SF. Mol Cancer. 2004;3 doi: 10.1186/1476-4598-3-4. [DOI] [PMC free article] [PubMed] [Google Scholar]
- 12.Spitz DR, Sim JE, Ridnour LA, Galoforo SS, Lee YJ. Ann Ny Acad Sci. 2000;899:349–362. doi: 10.1111/j.1749-6632.2000.tb06199.x. [DOI] [PubMed] [Google Scholar]
- 13.Graham NA, Tahmasian M, Kohli B, Komisopoulou E, Zhu MG, Vivanco I, Teitell MA, Wu H, Ribas A, Lo RS, Mellinghoff IK, Mischel PS, Graeber TG. Mol Syst Biol. 2012;8 doi: 10.1038/msb.2012.20. [DOI] [PMC free article] [PubMed] [Google Scholar]
- 14.Finkel T. J Biol Chem. 2012;287:4434–4440. doi: 10.1074/jbc.R111.271999. [DOI] [PMC free article] [PubMed] [Google Scholar]
- 15.Sena LA, Chandel NS. Mol Cell. 2012;48:158–167. doi: 10.1016/j.molcel.2012.09.025. [DOI] [PMC free article] [PubMed] [Google Scholar]
- 16.Paulsen CE, Carroll KS. Acs Chem Biol. 2010;5:47–62. doi: 10.1021/cb900258z. [DOI] [PMC free article] [PubMed] [Google Scholar]
- 17.Chandel NS, McClintock DS, Feliciano CE, Wood TM, Melendez JA, Rodriguez AM, Schumacker PT. J Biol Chem. 2000;275:25130–25138. doi: 10.1074/jbc.M001914200. [DOI] [PubMed] [Google Scholar]
- 18.Zhou RB, Yazdi AS, Menu P, Tschopp J. Nature. 2011;475 doi: 10.1038/nature09663. [DOI] [PubMed] [Google Scholar]
- 19.Scherz-Shouval R, Shvets E, Fass E, Shorer H, Gil L, Elazar Z. Embo J. 2007;26:1749–1760. doi: 10.1038/sj.emboj.7601623. [DOI] [PMC free article] [PubMed] [Google Scholar]
- 20.Kamata H, Honda S, Maeda S, Chang LF, Hirata H, Karin M. Cell. 2005;120:649–661. doi: 10.1016/j.cell.2004.12.041. [DOI] [PubMed] [Google Scholar]
- 21.Giordano FJ. J Clin Invest. 2005;115:500–508. doi: 10.1172/JCI200524408. [DOI] [PMC free article] [PubMed] [Google Scholar]
- 22.Paulsen CE, Carroll KS. Chem Rev. 2013;113:4633–4679. doi: 10.1021/cr300163e. [DOI] [PMC free article] [PubMed] [Google Scholar]
- 23.Samarasinghe KTG, Ahn YH. Synlett. 2015;26:285–293. [Google Scholar]
- 24.Samarasinghe KTG, Godage DNPM, VanHecke GC, Ahn YH. J Am Chem Soc. 2014;136:11566–11569. doi: 10.1021/ja503946q. [DOI] [PubMed] [Google Scholar]
- 25.Weerapana E, Wang C, Simon GM, Richter F, Khare S, Dillon MBD, Bachovchin DA, Mowen K, Baker D, Cravatt BF. Nature. 2010;468:790–U779. doi: 10.1038/nature09472. [DOI] [PMC free article] [PubMed] [Google Scholar]
- 26.Gallogly MM, Mieyal JJ. Curr Opin Pharmacol. 2007;7:381–391. doi: 10.1016/j.coph.2007.06.003. [DOI] [PubMed] [Google Scholar]
- 27.Tew KD. Biochem Pharmacol. 2007;73:1257–1269. doi: 10.1016/j.bcp.2006.09.027. [DOI] [PubMed] [Google Scholar]
- 28.Menon D, Board PG. J Biol Chem. 2013;288:25769–25779. doi: 10.1074/jbc.M113.487785. [DOI] [PMC free article] [PubMed] [Google Scholar]
- 29.Gallogly MM, Starke DW, Mieyal JJ. Antioxid Redox Sign. 2009;11:1059–1081. doi: 10.1089/ars.2008.2291. [DOI] [PMC free article] [PubMed] [Google Scholar]
- 30.Peltoniemi MJ, Karala AR, Jurvansuu JK, Kinnula VL, Ruddock LW. J Biol Chem. 2006;281:33107–33114. doi: 10.1074/jbc.M605602200. [DOI] [PubMed] [Google Scholar]
- 31.Hegazy UM, Mannervik B, Stenberg G. J Biol Chem. 2004;279:9586–9596. doi: 10.1074/jbc.M312320200. [DOI] [PubMed] [Google Scholar]
- 32.Ogus IH, Ozer N. Protein Expres Purif. 1998;13:41–44. doi: 10.1006/prep.1997.0865. [DOI] [PubMed] [Google Scholar]
- 33.DeBerardinis RJ, Mancuso A, Daikhin E, Nissim I, Yudkoff M, Wehrli S, Thompson CB. P Natl Acad Sci USA. 2007;104:19345–19350. doi: 10.1073/pnas.0709747104. [DOI] [PMC free article] [PubMed] [Google Scholar]
- 34.Chen YR, Zweier JL. Circ Res. 2014;114:524–537. doi: 10.1161/CIRCRESAHA.114.300559. [DOI] [PMC free article] [PubMed] [Google Scholar]
- 35.Nath KA, Ngo EO, Hebbel RP, Croatt AJ, Zhou B, Nutter LM. Am J Physiol-Cell Ph. 1995;268:C227–C236. doi: 10.1152/ajpcell.1995.268.1.C227. [DOI] [PubMed] [Google Scholar]
- 36.Ahlin G, Hilgendorf C, Karlsson J, Szigyarto CA, Uhlen M, Artursson P. Drug Metab Dispos. 2009;37:2275–2283. doi: 10.1124/dmd.109.028654. [DOI] [PubMed] [Google Scholar]
- 37.Lundgren DH, Hwang SI, Wu LF, Han DK. Expert Rev Proteomic. 2010;7:39–53. doi: 10.1586/epr.09.69. [DOI] [PubMed] [Google Scholar]
- 38.Huang DW, Sherman BT, Tan Q, Collins JR, Alvord WG, Roayaei J, Stephens R, Baseler MW, Lane HC, Lempicki RA. Genome Biol. 2007;8 doi: 10.1186/gb-2007-8-9-r183. [DOI] [PMC free article] [PubMed] [Google Scholar]
- 39.Chiang BY, Chou CC, Hsieh FT, Gao SJ, Lin JCY, Lin SH, Chen TC, Khoo KH, Lin CH. Angew Chem Int Edit. 2012;51:5871–5875. doi: 10.1002/anie.201200321. [DOI] [PMC free article] [PubMed] [Google Scholar]
- 40.Yang J, Gupta V, Carroll KS, Liebler DC. Nat Commun. 2014;5 doi: 10.1038/ncomms5776. [DOI] [PMC free article] [PubMed] [Google Scholar]
- 41.Das AK, Helps NR, Cohen PTW, Barford D. Embo J. 1996;15:6798–6809. [PMC free article] [PubMed] [Google Scholar]
- 42.Lammers T, Lavi S. Crit Rev Biochem Mol. 2007;42:437–461. doi: 10.1080/10409230701693342. [DOI] [PubMed] [Google Scholar]
- 43.Flajolet M, Rakhilin S, Wang H, Starkova N, Nuangchamnong N, Nairn AC, Greengard P. P Natl Acad Sci USA. 2003;100:16006–16011. doi: 10.1073/pnas.2136600100. [DOI] [PMC free article] [PubMed] [Google Scholar]
- 44.Niswender CM, Conn PJ. Annu Rev Pharmacol. 2010;50:295–322. doi: 10.1146/annurev.pharmtox.011008.145533. [DOI] [PMC free article] [PubMed] [Google Scholar]
- 45.Walker AG, Wenthur CJ, Xiang ZX, Rook JM, Emmitte KA, Niswender CM, Lindsley CW, Conn PJ. P Natl Acad Sci USA. 2015;112:1196–1201. doi: 10.1073/pnas.1416196112. [DOI] [PMC free article] [PubMed] [Google Scholar]
- 46.Nunnari J, Suomalainen A. Cell. 2012;148:1145–1159. doi: 10.1016/j.cell.2012.02.035. [DOI] [PMC free article] [PubMed] [Google Scholar]
- 47.Marley AE, Sullivan JE, Carling D, Abbott WM, Smith GJ, Taylor IWF, Carey F, Beri RK. Biochem J. 1996;320:801–806. doi: 10.1042/bj3200801. [DOI] [PMC free article] [PubMed] [Google Scholar]
- 48.Davies SP, Helps NR, Cohen PTW, Hardie DG. Febs Lett. 1995;377:421–425. doi: 10.1016/0014-5793(95)01368-7. [DOI] [PubMed] [Google Scholar]
- 49.Voss M, Paterson J, Kelsall IR, Martin-Granados C, Hastie CJ, Peggie MW, Cohen PTW. Cell Signal. 2011;23:947–947. doi: 10.1016/j.cellsig.2010.08.010. [DOI] [PubMed] [Google Scholar]
- 50.Hung WY, Huang KH, Wu CW, Chi CW, Kao HL, Li AFY, Yin PH, Lee HC. Bba-Gen Subjects. 2012;1820:1102–1110. doi: 10.1016/j.bbagen.2012.04.016. [DOI] [PubMed] [Google Scholar]
- 51.Chen Q, Moghaddas S, Hoppel CL, Lesnefsky EJ. Am J Physiol-Cell Ph. 2008;294:C460–C466. doi: 10.1152/ajpcell.00211.2007. [DOI] [PubMed] [Google Scholar]
- 52.Verma R, Nehru B. Neurochem Int. 2009;55:369–375. doi: 10.1016/j.neuint.2009.04.001. [DOI] [PubMed] [Google Scholar]
- 53.Velarde MC, Demaria M, Melov S, Campisi J. P Natl Acad Sci USA. 2015;112:10407–10412. doi: 10.1073/pnas.1505675112. [DOI] [PMC free article] [PubMed] [Google Scholar]
- 54.Moghaddas S, Hoppel CL, Lesnefsky EJ. Arch Biochem Biophys. 2003;414:59–66. doi: 10.1016/s0003-9861(03)00166-8. [DOI] [PubMed] [Google Scholar]
- 55.Liu LF, Song JX, Lu JH, Huang YY, Zeng Y, Chen LL, Durairajan SSK, Han QB, Li M. Sci Rep-Uk. 2015;5 doi: 10.1038/srep16862. [DOI] [PMC free article] [PubMed] [Google Scholar]
- 56.Shaham O, Slate NG, Goldberger O, Xu QW, Ramanathan A, Souza AL, Clish CB, Sims KB, Mootha VK. P Natl Acad Sci USA. 2010;107:1571–1575. doi: 10.1073/pnas.0906039107. [DOI] [PMC free article] [PubMed] [Google Scholar]
- 57.Ide T, Tsutsui H, Kinugawa S, Suematsu N, Hayashidani S, Ichikawa K, Utsumi H, Machida Y, Egashira K, Takeshita A. Circ Res. 2000;86:152–157. doi: 10.1161/01.res.86.2.152. [DOI] [PubMed] [Google Scholar]
- 58.Chatterjee A, Mambo E, Sidransky D. Oncogene. 2006;25:4663–4674. doi: 10.1038/sj.onc.1209604. [DOI] [PubMed] [Google Scholar]
- 59.Schulze A, Harris AL. Nature. 2012;491:364–373. doi: 10.1038/nature11706. [DOI] [PubMed] [Google Scholar]
- 60.Heiden MGV, Cantley LC, Thompson CB. Science. 2009;324:1029–1033. doi: 10.1126/science.1160809. [DOI] [PMC free article] [PubMed] [Google Scholar]
- 61.Fath MA, Diers AR, Aykin-Burns N, Simons AL, Hua L, Spitz DR. Cancer Biol Ther. 2009;8:1228–1236. doi: 10.4161/cbt.8.13.8631. [DOI] [PMC free article] [PubMed] [Google Scholar]
- 62.Yu TZ, Robotham JL, Yoon Y. P Natl Acad Sci USA. 2006;103:2653–2658. doi: 10.1073/pnas.0511154103. [DOI] [PMC free article] [PubMed] [Google Scholar]
- 63.Nishikawa T, Edelstein D, Du XL, Yamagishi S, Matsumura T, Kaneda Y, Yorek MA, Beebe D, Oates PJ, Hammes HP, Giardino I, Brownlee M. Nature. 2000;404:787–790. doi: 10.1038/35008121. [DOI] [PubMed] [Google Scholar]
- 64.Sanchez-Gomez FJ, Espinosa-Diez C, Dubey M, Dikshit M, Lamas S. Biol Chem. 2013;394:1263–1280. doi: 10.1515/hsz-2013-0150. [DOI] [PubMed] [Google Scholar]
- 65.Walker AG, Conn PJ. Curr Opin Pharmacol. 2015;20:40–45. doi: 10.1016/j.coph.2014.11.003. [DOI] [PMC free article] [PubMed] [Google Scholar]
- 66.Kim CH, Lee J, Lee JY, Roche KW. J Neurosci Res. 2008;86:1–10. doi: 10.1002/jnr.21437. [DOI] [PubMed] [Google Scholar]
Associated Data
This section collects any data citations, data availability statements, or supplementary materials included in this article.