Abstract
Objective
The aim of this study was to describe Duchenne muscular dystrophy (DMD) disease progression in the lower extremity muscles over 12 months using quantitative magnetic resonance (MR) biomarkers, collected across three sites in a large cohort.
Methods
A total of 109 ambulatory boys with DMD (8.7±2.0 years; range, 5.0–12.9) completed baseline and 1-year follow-up quantitative MR imaging (transverse relaxation time constant; MRI-T2), MR spectroscopy (fat fraction and 1H2O T2), and 6-minute walk test (6MWT) measurements. A subset of boys completed additional measurements after 3 or 6 months.
Results
MRI-T2 and fat fraction increased significantly over 12 months in all age groups, including in 5- to 6.9-year-old boys. Significant increases in vastus lateralis (VL) fat fraction were observed in 3 and 6 months. Even in boys whose 6MWT performance improved or remained stable over 1 year, significant increases in MRI-T2 and fat fraction were found. Of all the muscles examined, the VL and biceps femoris long head were the most responsive to disease progression in boys with DMD.
Interpretation
MR biomarkers are responsive to disease progression in 5- to 12.9-year-old boys with DMD and able to detect subclinical disease progression in DMD, even within short (3–6 months) time periods. The measured sensitivity of MR biomarkers in this multicenter study may be critically important to future clinical trials, allowing for smaller sample sizes and/or shorter study windows in this fatal rare disease.
Duchenne muscular dystrophy (DMD) is an x-linked rare disease that affects 1 in 3,500 to 6,000 newborn males.1 Boys with DMD experience progressive muscle weakness, causing disability and premature mortality. There is no cure for DMD, but extensive investment in the search for a treatment has yielded a number of promising therapeutic strategies, which are in preclinical development or have moved into clinical trials. These include exon skipping strategies,2 stop codon suppression compounds,2 and utrophin upregulators.3 Interventions are likely to be most effective in young boys with DMD, before the onset of muscle wasting.
Current clinical trials in DMD rely on muscle biopsies and functional outcome measures to demonstrate efficacy. Muscle biopsies are invasive with limited tissue sampling. Functional tests, including validated scales, have the disadvantage that they are subject to motivation, influenced by attention span, and often display limited interoperator reproducibility. Reliance on the 6-minute walk test (6MWT) and other functional outcome measures has impacted clinical trial design and resulted in narrow inclusion criteria. Although the 6MWT has been utilized as the primary outcome measure in several recent phase IIb/III clinical trials,4 it is not sensitive to disease progression in younger boys.5,6 Thus, there is a dire need for robust biomarkers that are sensitive to disease progression and treatment efficacy, especially in young boys with DMD, who may be more responsive to treatment effects.
Magnetic resonance imaging (MRI) and spectroscopy (MRS) show promise as sensitive biomarkers in DMD, with the potential for inclusion in multisite clinical trials.7 The MR transverse relaxation time constant assessed by MRI (MRI-T2; also referred to as bulk T2) is sensitive to several pathophysiological features of disease pathology in DMD, including muscle damage, inflammation, and fat infiltration, offering a potential method to monitor disease pathology over a wide age range. Furthermore, the proportion of fat infiltration in the muscle (fat fraction), measured using the gold standard, proton MRS (1H-MRS),7–13 or a 3-point Dixon imaging technique, is associated with disease progression and correlates with performance on functional tests.10,14 Finally, 1H-MRS, which permits the separation of lipid and water signal, allows for a more targeted assessment of muscle inflammation/damage using 1H2O T2.7
Our group (Imaging DMD) has shown that, using standardized procedures, these quantitative MR measures of muscle pathophysiology can be reproducibly implemented across multiple geographically distributed sites (using different MRI systems), show high day-to-day reproducibility,7 reveal differences across age groups in DMD,15 and are responsive to corticosteroid treatment in a period as short as 3 months.16 The primary objective of this study was to evaluate the ability of these quantitative MR measures to detect disease progression in a longitudinal multicenter study in a large cohort of ambulatory boys with DMD. We hypothesized that MR measures, which are sensitive to fat infiltration (MRI-T2 and fat fraction [FF]), can detect disease progression over a 1-year time frame across all ages in an ambulatory DMD population, including in young boys that are functionally stable. In addition, based on the clinically observed proximal to distal muscle involvement in DMD, we hypothesized that MR measures in the upper leg are able to detect disease progression in even shorter time frames.
Subjects and Methods
Overall Study Design
The ImagingDMD study (clinicaltrials.gov identifier: NCT01484678) was approved by the institutional review boards at the University of Florida (UF), Oregon Health & Science University (OHSU), and Children’s Hospital of Philadelphia (CHOP), and was conducted in compliance with the Health Insurance Portability and Accountability Act. Informed written consent and assent were obtained from the guardian and subject before study participation, and a detailed medical history was obtained. All boys with DMD were genetically tested and showed clinical symptoms before the age of 5 years. Further inclusion criteria included the ability to climb four stairs, the ability to walk at least 100m, and the absence of contraindications to MR examination.
Participants
A total of 109 boys with a genetically confirmed diagnosis of DMD (ages 5.0–12.9 years) and 38 age-matched healthy controls were enrolled and participated in baseline measurements. All boys with DMD completed a follow-up visit at 12.0±0.5 months. Two subgroups of boys were studied at additional time points and were included to examine the sensitivity of MR biomarkers over shorter time periods than 12 months. Corticosteroid-naïve boys ages 5 to 8 years old (n=11; 6.3±1.1 years; range, 5.1–8.5) completed additional visits at 3 and 6 months after baseline measurements. Results of this subgroup have been presented, in part, in a previous publication.16 The second subgroup consisted of boys who lost the ability to climb stairs (Vignos score: 4) at the 1 year time point. These subjects were invited for an additional 6-month follow-up time point (n=4, 9.5±0.4 years; range, 9.1–10.0). All boys completed the 6MWT as described by McDonald et al.4 The total distance walked was recorded at each visit and is referred to as the 6MWD. The Modified Brooke Lower Extremity Score was recorded for each participant as a measure of the clinical status of the boys.17 Subjects were instructed to avoid excessive physical activity for 3 days before each study visit.
MRI/MRS Data Acquisition
All MRI/MRS data were acquired using 3T whole-body MRI scanners located at three institutions (UF: Philips Achieva Quasar dual system [Philips, Amsterdam, The Netherlands]; OHSU: Siemens Magnetom TIM Trio system [Siemens, Munich, Germany]; CHOP: Siemens Magnetom Verio system). Coil configurations differed across sites.7 Standard operating procedures (SOPs) were developed by the ImagingDMD working group, distributed, and updated as required. All MR operators were trained and certified to follow SOPs. Training included MRS voxel placement on sample images, acquisition of phantom scan data using the full protocol, and acquisition of human volunteer data. All MRI/MRS data were analyzed at a central site (UF) using an automated processing stream, when appropriate, quality control feedback was provided to each site in a timely fashion (typically within 48 hours), and discussed at MR biweekly conference call meetings attended by all sites.7
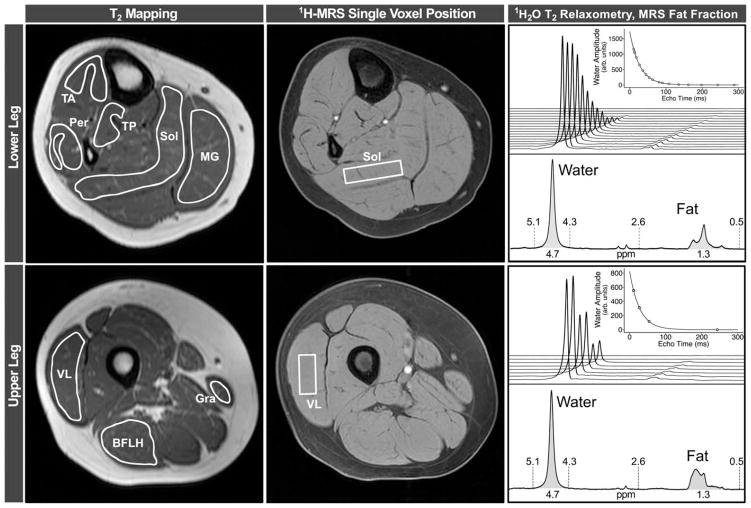
Subjects lay in a supine position in the magnet during data acquisition. They were not sedated, and they were encouraged to watch a movie throughout data acquisition. A parent or guardian and a member of the study team were also present in the scanner environment throughout the scans. Total time in the magnet was 75 to 90 minutes, which included setup and switching coils between the lower leg and upper leg exams. MRI/MRS data were acquired from the right leg, as previously described.7 Briefly, MRI-T2 was measured using axial T2-weighted multispin echo images without fat suppression. Between four and eight slices were acquired from the region centered around the largest muscle cross-sectional area (proximal one third of the lower leg and distal one third of the thigh). Slice thickness/gap was set at 7mm/3.5mm, and the in-plane resolution was 0.75mm2 in the lower leg and 1.0mm2 in the thigh. The repetition time (TR) was 3,000 ms, and 16 echo times (TEs), evenly spaced between 20 and 320ms, were collected. Refocusing pulse slice thickness was set at 1.5 times the excitation pulse slice thickness (4–6 minutes). Three-dimensional (3D) gradient echo fat-suppressed (spectral presaturation with inversion recovery) images were acquired with TR=17 to 25ms and TE=1.9 to 2.4ms. Flip angle was set at 20 degrees and 52 slices (2.8mm thick) were acquired (4–6 minutes). Single-voxel 1H-MRS (STEAM18 was performed in both the soleus (Sol) and vastus lateralis (VL) to assess the FF (lipid/lipid/water) in each of the muscles (TR=3,000ms; TE=108ms; navigation echo [Navg]=64; no water suppression; 3.2 minutes) as well as muscle 1H2O T2 (TR=9,000ms; TE=11–288ms with 16 TEs in Sol and 4 in VL; Navg=4; 9.6 minutes). The 1H-MRS voxel was positioned in the belly of the muscle, and its size and rotation were adjusted to maximize the sampled volume of each muscle and to minimize contamination from fascia and other muscle groups (Fig 1). Each participant’s voxel position and relative size to the muscle was matched as closely to the baseline scan as possible for all longitudinal follow-up visits and to account for growth in children.
FIGURE 1.
Raw data from an unaffected control subject, illustrating data analysis. For MRI-T2 mapping analysis, regions of interest were outlined on eight leg muscles on the image acquired with a TE of 20 ms. To avoid contamination from subcutaneous fat, bone, or other tissue, boundaries were traced slightly inside of the muscle boundaries. Rectangular 1H-MRS voxels were selected in the Sol and VL muscles, and used to measure both 1H20T2, by fitting water peak height to a monoexponential curve, and FF, by integrating the water and lipid peaks. BFLH=long head of the biceps femoris; GRA=gracilis; 1H-MRS=proton magnetic resonance spectroscopy; MG=medial gastrocnemius; MRI=magnetic resonance imaging; MRS=magnetic resonance spectroscopy; PER=peroneals; SOL=soleus; TA=tibialis anterior; TE=echo time; TP=tibialis posterior; VL=vastus lateralis.
MRI/MRS Data Analysis
Signal intensities from the T2-weighted spin echo images were fit to a single exponential decay function [S(TE)=A * exp(−TE/T2) ] on a voxel-by-voxel basis to generate MRI-T2 maps.7 To reduce the bias from stimulated echoes, only TEs 40 to 100ms were used in the fitting. Experienced analyzers outlined regions of interest (ROIs) for five muscles of the lower leg (medial gastrocnemius, MG; peroneals [longus and brevis], PER; soleus, SOL; tibialis anterior, TA; and tibialis posterior, TP) and three muscles of the upper leg (vastus lateralis, VL; long head of the biceps femoris, BFLH; and gracilis, GRA), avoiding inter- and intramuscular fasciae, using the TE=20ms images as a template (Fig 1). Analyzers selected slices based on a standardized internal anatomical landmark (the most proximal slice in which the flexor digitorum longus and the short head of the biceps femoris were visible in the lower leg and upper leg, respectively) to ensure consistently placed ROIs over time and between subjects. ROIs were transferred to the MRI-T2 maps, and the average muscle MRI-T2 was calculated using the ROIs outlined on three consecutive slices.
1H-MRS data processing was automated using custom-written Interactive Data Language (version 8.1; Exelis Visual Information Solutions, Boulder, CO) software. To measure muscle 1H2O T2, complex principal component analysis19 was applied in the frequency domain to the phased water peak (4.7±0.5 ppm) to determine the water signal amplitudes at each TE. The resulting amplitudes were fit to a single exponential function [S(TE)=A * exp(−TE/T2)/C ], with proton density signal A and noise floor term C also fit as independent variables.7 FF was measured using area integration of the phase-corrected spectra from the primary lipid (0.5–2.75 ppm) and 1H2O (4.3–5.1 ppm) regions of the spectrum.10 Amplitudes of these integrations (Afat=integrated amplitude fat signal and AH2O=integrated amplitude water signal) were corrected for MR signal relaxation effects by:
The T2w was obtained from 1H-MRS as described above. The water longitudinal relaxation time constant at 3 Tesla (T), T1w, was determined in a previous study with healthy subjects’ muscle T1w=1,380ms and DMD subjects’ muscle T1w=1,470ms.9 The weighted average for fat proton T2f was measured to be 59.1ms (unpublished results), and a literature value for fat proton T1f at 3T of 360ms was used.20
Statistical Analysis
Data are presented as mean±standard deviation, unless otherwise stated. Correlations between Modified Brooke Lower Extremity Score and MR biomarkers were calculated using Spearman rank correlations. DMD and control groups were compared using Wilcoxon rank-sum tests, and changes over 3, 6, and 12 months in boys with DMD, including subsets of boys grouped by age or by functional ability, were tested using Wilcoxon signed-rank tests. The standardized response mean (SRM) was used as the index of responsiveness and was calculated as SRM=mean change/standard deviation of the change. GraphPad Prism software (version 6.0; GraphPad Software Inc., La Jolla, CA) was used for all analyses, including the establishment of functional groupings. Hypothetical sample-size calculations assumed a desired power of 0.80 and treatment that halted disease progression (i.e., no change in MR biomarkers or 6MWD over 1 year).21 Statistical significance was specified as p≤0.05.
Results
Demographics
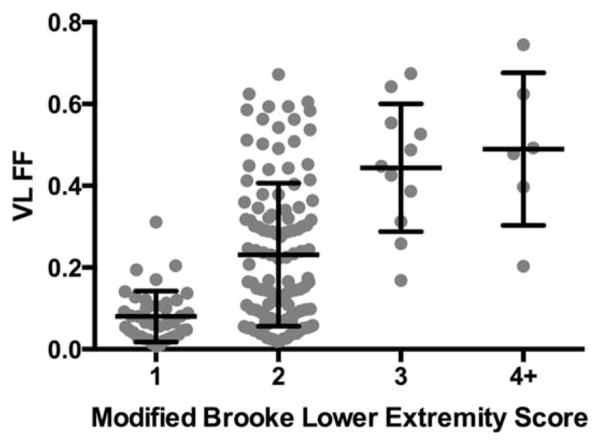
Table 1 shows baseline demographic data of the subjects included in the final data analysis (97 boys with DMD and 38 controls). Average age of the boys with DMD was 8.7±2.0 years at baseline, which was not different from the control group (9.2±1.9 years). Most boys with DMD (87%) were taking corticosteroids at the time of recruitment. Of the 109 boys enrolled, 12 began to take corticosteroids between their baseline and 12-month visits. These boys were therefore excluded from analysis to ensure that published data are relevant to clinical trial planning. The relationship between VL FF and clinical status (Modified Brooke Lower Extremity score) is shown in Figure 2 (p<0.0001).
TABLE 1.
Demographic Information From Unaffected Control Subjects and Boys With DMD
| Age Group | 5.0–6.9 | 7.0–8.9 | 9.0–10.9 | 11.0–12.9 | All Subjects |
|---|---|---|---|---|---|
| DMD | |||||
| n | 26 | 29 | 24 | 18 | 97 |
| Age (yr) | 6.2±0.6 | 8.1±0.6 | 9.9±0.6 | 11.6±0.6 | 8.7±2.0 |
| Weight (kg) | 20.9±3.3 | 27±5.8 | 29.9±6.9 | 42.2±9.4 | 28.9±9.7 |
| Height (cm) | 111±6 | 121±6 | 124±7 | 133±8 | 121±10 |
| BMI (kg/m2) | 17.0±1.7 | 18.3±3.1 | 19.2±3.3 | 23.9±4.4 | 19.2±3.9 |
| Corticosteroids, % | 73 | 86 | 96 | 94 | 87 |
| Control | |||||
| n | 6 | 12 | 14 | 6 | 38 |
| Age (yr) | 6.3±0.6 | 8.2±0.6 | 10.2±0.5 | 11.8±0.7 | 9.2±1.9 |
| Weight (kg) | 22.9±5.7 | 30.3±7.0 | 35.8±11.2 | 46.7±11.7 | 33.8±11.6 |
| Height (cm) | 122±8 | 133±6 | 143±8 | 156±8 | 138±13 |
| BMI (kg/m2) | 15.3±1.8 | 17.1±3.6 | 17.2±3.8 | 19.1±3.2 | 17.2±3.4 |
BMI=body mass index; DMD=Duchenne muscular dystrophy.
FIGURE 2.
Relationship between clinical status (Modified Brooke Lower Extremity Score) and VL FF in boys with DMD at baseline and 12 months. A moderate significant relationship was noted (r=0.54; p < 0.0001). Low FFs were noted in boys who are able to climb stairs without using hand rails (Brooke Score 1), whereas high FFs were observed in boys who climb stairs slowly (Brooke score 3), do not climb stairs at all (Brooke score 5), or are unable to walk (Brooke score 9). DMD=Duchenne muscular dystrophy; FF=fat fraction; VL=vastus lateralis.
One-Year Change in MR Measures in Boys With DMD
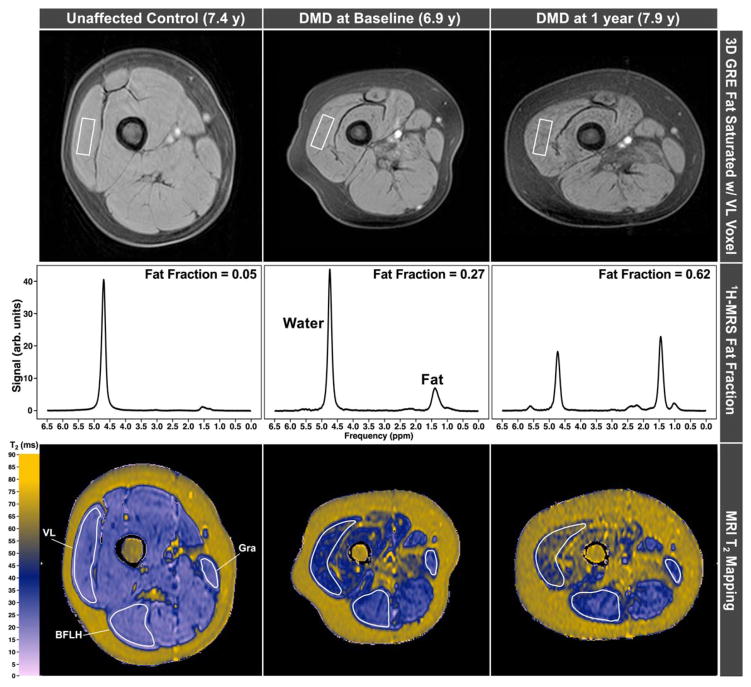
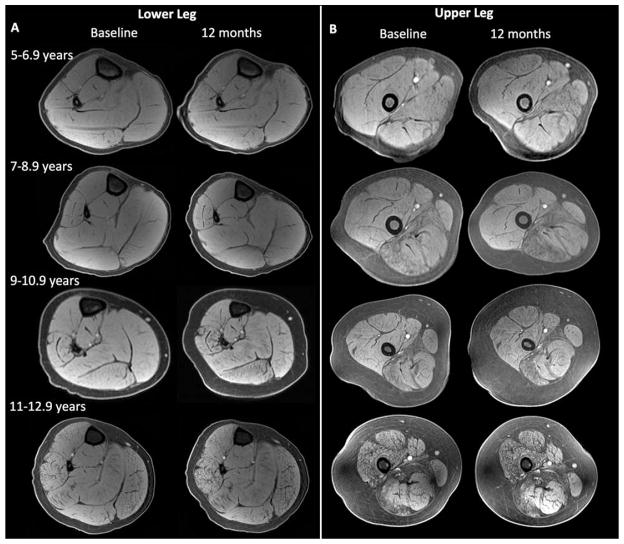
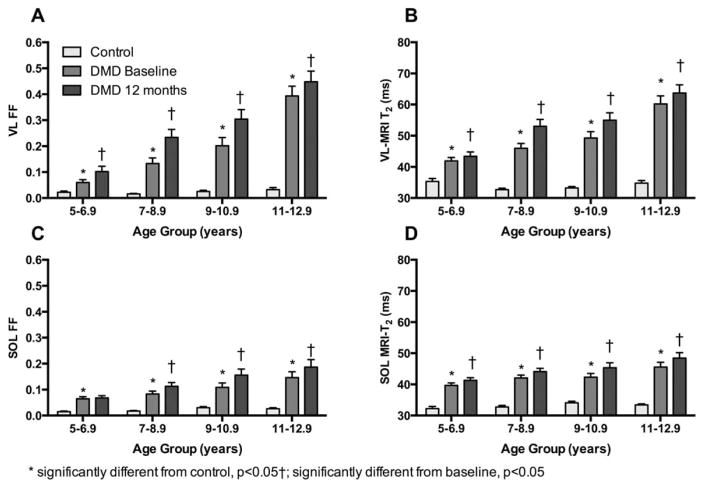
Figure 3 displays images and 1H-spectra as well as MRI-T2 maps acquired from the upper leg muscles in a control subject and a subject with DMD at baseline and at 1-year follow-up. Displayed in Figure 4 is the increase in intramuscular fat over 1 year in each age group. Increases in mean MRI-T2 over 12 months were observed in seven upper and lower leg muscles (Table 2), with significance values ranging between 0.0004 and <0.0001. The one exception was the gracilis muscle, which is known to be preferentially spared in DMD.15,22,23 MRS FF also increased significantly (p<0.0001) over 12 months in DMD in both the VL and SOL muscles. However, 1H2O T2, though significantly elevated in DMD compared to controls, did not change over 1 year. Figure 5 illustrates the progressive increases in FF and MRI-T2 in the SOL and VL in DMD groups at different ages, compared to controls.
FIGURE 3.
3D gradient echo images acquired in the upper leg of an unaffected control subject and a boy with DMD at baseline and 12-month follow-up time points show increases in intramuscular fat (top). Spectra show the quantitative increase in fat, whereas MRI-T2 maps show increased T2 concomitant with increased fat fraction. 3D=three-dimensional; BFLH=long head of the biceps femoris; DMD=Duchenne muscular dystrophy; BFLH=long head of the biceps femoris; GRA=gracilis; GRE=gradient refocused echo; 1H-MRS=proton magnetic resonance spectroscopy; MRI=magnetic resonance imaging; VL=vastus lateralis.
FIGURE 4.
Representative MR images (fat saturated gradient echo images) of the lower (A) and upper leg (B) showing the changes in muscle composition in the different age groups. MR=magnetic resonance.
TABLE 2.
Group Mean and Standard Deviation for MR Measures in DMD and Control, and Across Time in DMD
| Control | DMD Baseline | p (CON vs DMD) | DMD 12 Months | p (change over 1 year) | DMD 12-Month Change | |
|---|---|---|---|---|---|---|
| A: MRS | ||||||
| VL FF | 0.02±0.01 | 0.18±0.17 | <0.0001 | 0.25±0.19 | <0.0001 | 0.07±0.07 |
| SOL FF | 0.02±0.01 | 0.10±0.07 | <0.0001 | 0.12±0.10 | <0.0001 | 0.03±0.04 |
| VL 1H20T2 (ms) | 28.4±1.4 | 31.5±2.3 | <0.0001 | 31.6±2.6 | NS | 0.1±2.6 |
| SOL 1H20T2 (ms) | 28.2±0.7 | 31.5±2.4 | <0.0001 | 31.4±2.1 | NS | 0.9±2.0 |
| B: MRI-T2 (ms) | ||||||
| BFLH | 32.9±2.7 | 50.4±11.4 | <0.0001 | 56.0±13.2 | <0.0001 | 5.3±5.2 |
| VL | 33.6±2.0 | 48.6±10.4 | <0.0001 | 53.0±11.9 | <0.0001 | 4.2±5.5 |
| GRA | 34.8±4.9 | 39.3±4.9 | <0.0001 | 40.5±6.6 | NS | 0.9±5.5 |
| PER | 33.0±1.6 | 42.5±7.0 | <0.0001 | 45.2±8.0 | <0.0001 | 2.4±2.8 |
| SOL | 33.3±1.8 | 42.2±5.5 | <0.0001 | 44.5±6.4 | <0.0001 | 2.1±2.8 |
| MG | 32.3±1.7 | 42.1±6.4 | <0.0001 | 44.1±8.2 | <0.0001 | 2.0±3.7 |
| TP | 32.8±1.1 | 36.5±2.4 | <0.0001 | 37.3±2.9 | <0.0001 | 1.0±2.6 |
| TA | 31.9±1.3 | 37.5±4.6 | <0.0001 | 38.6±5.2 | 0.0004 | 0.9±2.0 |
All MR biomarkers were elevated in DMD compared to control subjects. Both FF (A) and MRI-T2 (B) changed significantly over 1 year. 1H20T2 values were significantly elevated in DMD compared to controls, but did not change over 1 year. BFLH=long head of the biceps femoris; CON=; DMD=Duchenne muscular dystrophy; FF=fat fraction; GRA=gracilis; MG=medial gastrocnemius; MR=magnetic resonance; MRI=magnetic resonance imaging; MRS=magnetic resonance spectroscopy; PER=peroneals; SOL=soleus; TA=tibialis anterior; TP=tibialis posterior; VL=vastus lateralis.
FIGURE 5.
FF and MRI-T2 in the SOL and VL muscle were greater in DMD than control at all ages and were higher at 12 months than baseline. This increase was significant in all groups except SOL FF in 5- to 6.9-year-old boys. Data are presented as mean±standard error. DMD=Duchenne muscular dystrophy; FF=fat fraction; MRI=magnetic resonance imaging; SOL-=soleus; VL=vastus lateralis.
Three- and 6-Month Changes in Muscle FF
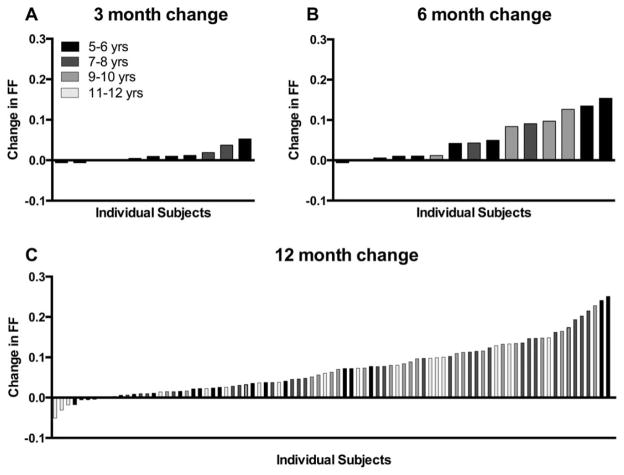
To examine whether the sensitivity of these MR biomarkers would allow us to detect changes in a shorter time frame, a sample of convenience was compiled from the overall ImagingDMD cohort. The 3-month change in VL FF (n=11) is presented in Figure 6A, whereas 6-month data are presented in Figure 6B (n=15). Note that in this sample of convenience, VL fat fraction increased significantly over both 3 (p=0.03) and 6 months (p=0.0004). Individual VL FF changes for the entire subject sample (n=97) over 12 months are displayed in Figure 6C.
FIGURE 6.
Changes in VL FF over 3, 6, and 12 months in 5- to 12.9-year-old boys. Each bar represents an individual subject. FF increased significantly over 3 (p=0.03), 6 (p=0.0004), and 12 months (p < 0.0001). FF=fat fraction; VL=vastus lateralis.
MR Variables in Functionally Stable Boys
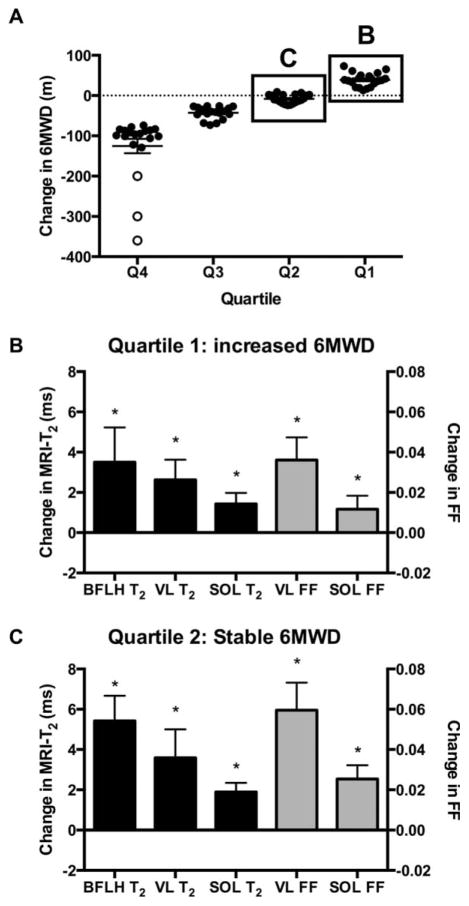
Measuring disease progression in young boys with DMD who are in the “plateau” phase of the disease is challenging.5,24 To investigate the sensitivity of MR biomarkers in functionally stable boys, we divided the DMD cohort into quartiles based on their 1-year change in 6MWD, with the third quartile representing boys that showed minimal change in 6MWD (−8±11m) and the fourth quartile boys who showed an improvement in 6MWD performance (39±17m). MRI-T2 and FF in the SOL and VL significantly increased in all groups, including in boys whose 6MWD was relatively stable or increased over 1 year (Fig 7). Large changes were also noted in MRI-T2 of the BFLH.
FIGURE 7.
(A) Boys were divided into quartiles based on the 1-year change in 6MWD. The first quartile comprised boys whose 6MWD increased, the second quartile comprised boys whose 6MWD was stable, and the third and fourth quartiles included boys whose 6MWD decreased in 1 year. Boys who lost ambulation are shown in open circles. (B and C) VL and SOL FF and T2 and BFLH T2 increased over 1 year in boys whose 6MWD was stable or improved over 1 year. 6MWT=6-minute walk test; BFLH=long head of the biceps femoris; FF=fat fraction; SOL=soleus; VL=vastus lateralis.
Responsiveness to Disease Progression
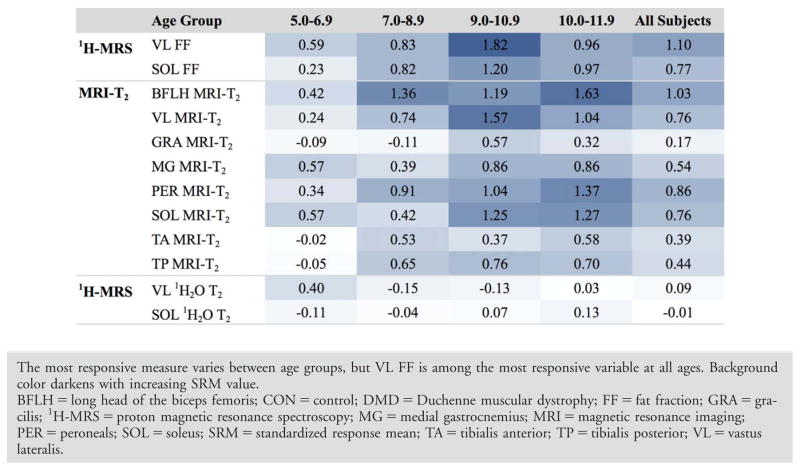
To compare the responsiveness to disease progression of the different MR measures in boys with DMD across different age groups, we calculated the standardized response mean (SRM=mean change/standard deviation of change) over 1 year. Overall, MRI-T2 in the BFLH and VL and FF in the VL and SOL were the most responsive measures, with group mean SRM values ranging from 0.76 to 1.10. Figure 8 shows the responsiveness to disease progression of MR variables across 1 year for the different age groups. To estimate the impact of the high responsiveness of the MR measures on potential sample-size calculations for clinical trials, we assumed a drug that completely halts disease progression, such that the change over 1 year in the treated group is 0 and the change in the untreated group is equivalent to our natural history cohort. Based on these assumptions, we found that 13 subjects per group would be needed to detect the difference in VL FF with 80% power. On the other hand, 68 subjects per group would be needed to detect the difference in 6 MWD (Table 3). Data for each age group are presented in Table 3.
FIGURE 8.
Standardized Response Mean for MR Measures in Age Subgroups
TABLE 3.
Number of Subjects Needed in Each Groupa to Detect a Stabilization of Disease Progression b With 80% Power
| VL FF | 6MWT | |
|---|---|---|
| All ImagingDMD subjects | 13 | 68 |
| 5.0–6.9 years | 44 | 783 |
| 7.0–8.9 years | 9 | 83 |
| 9.0–10.9 years | 5 | 27 |
| 11.0–12.9 years | 17 | 44 |
Treated and untreated.
No change over 1 year in treated group; change in untreated group based on the data presented in Table 2. 6MWT=6-minute walk test; DMD=Duchenne muscular dystrophy; FF=fat fraction; VL=vastus lateralis.
Discussion
This prospective longitudinal multicenter study evaluated the ability of quantitative MRI and MRS to monitor disease progression in the lower extremity muscles of ambulatory boys with DMD. A standardized MR protocol consisting of transaxial gradient echo and spin echo sequences and single-volume localized 1H-MRS was implemented in both the upper and lower leg muscles of 109 boys (ages 5.0–12.9 years) across three sites at baseline and 1-year follow-up. Using a centralized data analysis site, quantitative evaluations of FF, T2, and 1H2O T2 were derived for multiple muscles. Our primary finding is that both MRI-T2 and FF, measured using 1H-MRS, can readily detect disease progression in the lower extremity muscles over a 1-year time frame, in all age groups studied. Most important, these same MR measures are responsive to disease progression in young boys that are functionally stable or show improved performance on the 6MWT. Finally, we provided strong initial evidence that disease progression in upper leg muscles may be detected in time frames as short as 3 and 6 months using quantitative MRI and MRS strategies.
Clinical trials in DMD have been significantly hampered by a lack of sensitive noninvasive outcome measures. Most phase II clinical trials still depend on surgical muscle biopsies to establish efficacy, even though experts have pointed to the large variability in laboratory results.6 Functional tests, including the 6MWT, have been criticized for their dependence on subject cooperation and motivation.25 The 6MWT, selected as the primary outcome measure in several recent clinical trials, has the added disadvantage that it is only sensitive to disease progression in a specific age window.4,5 In fact, performance on the 6MWT improves between the age of 5 and 7 years, whereas performance is relatively stable between the ages of 7 to 10 years.5 This has resulted in narrowing of the inclusion criteria and competitive recruitment of a small pool of potential subjects into an increasing number of clinical trials, often at the exclusion of younger boys that are most likely to benefit from therapeutic interventions.
Quantitative MRI/MRS measures are noninvasive, objective, and, if standardized approaches are carefully implemented, provide highly reproducible results across sites and day-to-day in DMD.7 Though small single-site studies have examined the ability of quantitative MRI to detect disease progression in DMD, this is the first multicenter longitudinal study to establish the sensitivity of MR biomarkers in a large DMD cohort across multiple vendor platforms (Phillips and Siemens). For analysis of MRI-T2, various muscles with different functional roles and representing different degrees of involvement were analyzed. All upper and lower leg muscles studied, except for the GRA muscle, showed a significant change in MRI-T2 over 1 year. MR measures of muscle pathology in the VL and BFLH muscles proved to be the most responsive to disease progression in boys with DMD. MRI-T2 values increased, on average, by 1 to 5ms/year, with larger increases (4–5ms/year) observed in proximal muscles, and smaller increases in distal muscles as well as muscles that are known to be preferentially spared in DMD (gracilis, tibialis anterior, and tibialis posterior).15,22,23 Spectroscopic studies were performed using single-voxel localized spectroscopy in two large muscles with important functional roles: the distal Sol and proximal VL muscles. FF measured in the VL appeared to be among the most responsive measure in all age groups studied, including in 5- to 6-year-old boys. This is consistent with the cross-sectional comparison reported by Forbes et al,15 showing faster progression of pathology in the VL and BFLH muscles, and is consistent with previous cross-sectional observations in which these muscles were observed to be some of the most involved in DMD.26
In this study, we specifically examined the sensitivity of MRI-T2 and FF measured by MRS to disease progression. Spectroscopy is considered the gold standard for quantification of biochemical compounds in vivo, and FF measures from single-voxel spectroscopy have been shown to be associated with function in DMD.10,14 However, single-voxel 1H-MRS provides limited spatial information and coverage. As a consequence, Dixon-based imaging is rapidly emerging as a popular technique to quantify FF in multiple muscles simultaneously and has been successfully applied in longitudinal multisite studies of limb girdle muscular dystrophy and DMD.27 However, caution must be taken to ensure that appropriate fat/water separation algorithms and T2* correction are applied, especially in multicenter studies utilizing different vendors.28,29 Triplett et al9 validated a multipeak chemical shift imaging, 3-Point Dixon, using 1H-MRS and showed a strong linear correlation between both measures in DMD. Although we should point out that day-to-day variation was higher using Dixon imaging, especially in younger boys with low levels of intramuscular fat. A similar concern has been previously been raised in cardiac Dixon imaging, attributable to low myocardial fat fraction.30 MRI-T2 mapping may be considered as an alternative strategy to track disease progression in multiple muscle groups in DMD. A strong correlation between MRI-T2 and FF has been reported in DMD15 as well as in oculopharyngeal muscular dystrophy patients.31 T2 spin echo sequences are standardly available on clinical scanners, are straightforward, and do not require complex reconstructions. However, caution should be taken in interpreting the results when implementing MRI-T2, because both inflammation/damage and lipid prolong muscle T2, and the contribution of each may vary depending on the age and stage of disease progression. In addition, T2 is affected by other microenvironmental factors, such as fibrosis.32 New MR analysis strategies are being pursued to assess the water and fat contribution to MRI-T2 and examine the pathophysiological features of muscular dystrophy more closely.33,34
In contrast to MRI-T2 and FF, spectroscopic measures of 1H2O T2 in either the soleus or vastus lateralis did not significantly change in 1 year in this large DMD cohort. This is consistent with the assumption that 1H2O T2 primarily detects inflammation and damage, a pathophysiological feature that does not appear to track disease progression. We previously showed that 1H2O T2 is elevated in all boys with DMD compared to unaffected controls, with the highest values in young boys (5.0–6.9 years). A cross-sectional comparison of subjects enrolled in ImagingDMD showed a decline in 1H2O T2 with increased age, with slightly lower 1H2O T2 values in the older age groups.15 We were not able to detect this age-dependent decline over a 1-year time frame in the current longitudinal study. 1H2O T2 has been shown to be highly responsive to corticosteroid treatment, consistent with its sensitivity to muscle inflammation.16 Thus, though 1H2O T2 may not be particularly suited to monitor disease progression, it may be valuable for future clinical trials targeting anti-inflammatory therapeutic strategies.
The DMD cohort examined in this study was relatively young and highly functional compared to the population studied in other MR or natural history studies. The ImagingDMD study specifically enrolled ambulatory subjects (ages 5.0–12.9) given that this is the population most commonly targeted in current therapeutic trials and there is an urgent need for more comprehensive natural history data to assist with trial planning. In addition, the inclusion criteria were relatively stringent, requiring the subjects to have the ability to climb four stairs and walk 100m at the time of enrollment. Mean 6MWD at baseline was 368m, and the average decline in 6MWD over 1 year was 33m. In comparison, other studies have reported yearly declines in 6MWD ranging between 10 and 57m.35–37 Even in this young, highly functional group of boys, MR biomarkers were highly responsive to disease progression over 12 months. Notably, we found that even in boys whose 6MWD improved or remained stable over 12 months, a significant increase in FF and MRI-T2 was noted, indicating that MR biomarkers can detect subclinical disease progression.
Although the results of this longitudinal multicenter study are persuasive, this study does have some limitations. First, to examine changes in MR biomarkers over a 6-month time interval, subgroups of participants were pooled. In addition, 87% of the subjects enrolled in this study were corticosteroid treated, whereas the subgroup examined at 3- and 6- month intervals primarily consisted of participants that were not treated with corticosteroids. Therefore the results observed in this sample of convenience may not necessarily extrapolate to the larger population, in which corticosteroid treatment is now the current standard of care. Finally, the changes observed in this study over 1 year are smaller than those previously reported in 20 boys with DMD.21 This is likely the result of the more stringent inclusion criteria and higher functional status of the subjects enrolled in this multicenter study.
Significant consideration should be given to the inclusion of quantitative MRI/MRS as a biomarker or even surrogate outcome measure in future multicenter clinical trials. As we have shown here and elsewhere, MRI/MRS is reproducible across sites and from day-today (coefficient of variation:<5%), sensitive to disease progression, and can detect the beneficial effects of corticosteroids, the only demonstrated therapeutic treatment for DMD. In addition, our data as well as a number of studies have shown that both MRI-T2 and FF measures correlate with function17,21,38 and are predictive of loss of ambulation.39 In a smaller sample size of 20 DMD subjects, Bonati et al21 modeled the implications of the high sensitivity of MRI on effect sizes and reported that much smaller sample sizes are required to demonstrate treatment effects using MR compared with motor function measures. Using the same modeling algorithms and the data collected in this multicenter study, we found that approximately 5 times as many subjects would be needed to detect a significant slowing or stabilization of disease progression using the 6MWD compared with MR biomarkers such as FF or MRI-T2 (VL or BFLH). Collectively these studies provide strong evidence of the potential value of MRI/MRS as a biomarker in DMD clinical trials. Although there is a significant cost associated with MRI/MRS, it is comparable to or less than the cost of surgical biopsies requiring anesthesia. As well, MRI/MRS biomarkers, by virtue of their sensitivity, have the potential to reduce the size and/or shorten the duration of clinical trials, leading to less costly trials overall.
The successful integration of MRI/MRS as prognostic biomarkers in phase II multicenter clinical trials will depend on careful implementation, and there are a number of potential pitfalls that require consideration. First, it will be important that each site has trained staff with previous experience in quantitative MRI, is comfortable scanning young pediatric patients without sedation, and is committed to following SOPs. Depending on the MR measures selected, it will be critical that field strengths and key parameters are matched across sites. Another important requirement is the consistent handling and processing of MR data at a centralized analysis site, with use of raw data where possible, appropriate quality control checks, automated processing steps in place, and a well-thoughtout work flow. Finally, a number of strategies specific to pediatric studies are essential for success in DMD: child-friendly staff; use of an in-magnet movie system; comfortable and stable positioning; and postprocessing procedures to minimize the impact of motion.
This multicenter prospective longitudinal study examined the sensitivity of standardized quantitative MRI/MRS measures to disease progression in a large cohort of 5- to 12.9-year-old ambulatory boys with DMD. MRI-T2 and FF measures in lower extremity muscles changed significantly over 12 months, including in 5- to 6.9-year-old boys whose 6MWD performance remained stable or improved. VL FF was among the most responsive MR measures across all age groups and detected disease progression in 3 and 6 months. The demonstrated sensitivity of MR biomarkers in this multicenter study may have significant implications for future clinical trial design, potentially allowing for smaller sample sizes or shorter study windows.
Acknowledgments
This study was funded by the National Institute of Neurological Disorders and Stroke and the National Institute of Arthritis and Musculoskeletal and Skin Diseases through grant numbers R01AR065943, R01AR056973, and 1U54AR052646. The content is solely the responsibility of the authors and does not necessarily represent the official views of the National Institutes of Health.
Footnotes
Author Contributions
W.D.R., S.C.F., D.J.L., C.R.S., M.J.D., D.J.W., A.T.H., B.S.R., E.L.F., B.J.B., R.S.F., G.A.W., H.L.S., and K.V. contributed significantly to the conception and design of the study. R.J.W., W.D.R., W.T.T., S.C.F., D.J.L., M.J.D., D.J.W., G.I.T., E.L.F., G.A.W., and K.V. contributed significantly to data acquisition and analysis, and R.J.W., W.D.R., W.T.T., S.C.F., D.J.L., C.R.S., M.J.D., D.J.W., A.T.H., G.I.T., B.S.R., E.L.F., B.J.B., R.S.F., G.A.W., H.L.S., and K.V. contributed significantly to drafting the manuscript or figures.
Potential Conflicts of Interest
Nothing to report.
References
- 1.Mendell JR, Shilling C, Leslie ND, et al. Evidence-based path to newborn screening for Duchenne muscular dystrophy. Ann Neurol. 2012;71:304–313. doi: 10.1002/ana.23528. [DOI] [PubMed] [Google Scholar]
- 2.Hoffman EP, Connor EM. Orphan drug development in muscular dystrophy: update on two large clinical trials of dystrophin rescue therapies. Discov Med. 2013;16:233–239. [PubMed] [Google Scholar]
- 3.Fairclough RJ, Wood MJ, Davies KE. Therapy for Duchenne muscular dystrophy: renewed optimism from genetic approaches. Nat Rev Genet. 2013;14:373–378. doi: 10.1038/nrg3460. [DOI] [PubMed] [Google Scholar]
- 4.McDonald CM, Henricson EK, Abresch RT, et al. The 6-minute walk test and other clinical endpoints in Duchenne muscular dystrophy: reliability, concurrent validity, and minimal clinically important differences from a multicenter study. Muscle Nerve. 2013;48:357–368. doi: 10.1002/mus.23905. [DOI] [PMC free article] [PubMed] [Google Scholar]
- 5.McDonald CM, Henricson EK, Abresch RT, et al. The 6-minute walk test and other endpoints in Duchenne muscular dystrophy: longitudinal natural history observations over 48 weeks from a multicenter study. Muscle Nerve. 2013;48:343–356. doi: 10.1002/mus.23902. [DOI] [PMC free article] [PubMed] [Google Scholar]
- 6.Lu QL, Cirak S, Partridge T. What can we learn from clinical trials of exon skipping for DMD? Mol Ther Nucleic Acids. 2014;3:e152. doi: 10.1038/mtna.2014.6. [DOI] [PMC free article] [PubMed] [Google Scholar]
- 7.Forbes SC, Walter GA, Rooney WD, et al. Skeletal muscles of ambulant children with Duchenne muscular dystrophy: validation of multicenter study of evaluation with MR imaging and MR spectroscopy. Radiology. 2013;269:198–207. doi: 10.1148/radiol.13121948. [DOI] [PMC free article] [PubMed] [Google Scholar]
- 8.Forbes SC, Lott DJ, Finkel RS, et al. MRI/MRS evaluation of a female carrier of Duchenne muscular dystrophy. Neuromuscul Disord. 2012;22(suppl 2):s111–s121. doi: 10.1016/j.nmd.2012.05.013. [DOI] [PMC free article] [PubMed] [Google Scholar]
- 9.Triplett WT, Baligand C, Forbes SC, et al. Chemical shift-based MRI to measure fat fractions in dystrophic skeletal muscle. Magn Reson Med. 2014;72:8–19. doi: 10.1002/mrm.24917. [DOI] [PMC free article] [PubMed] [Google Scholar]
- 10.Lott DJ, Forbes SC, Mathur S, et al. Assessment of intramuscular lipid and metabolites of the lower leg using magnetic resonance spectroscopy in boys with Duchenne muscular dystrophy. Neuromuscul Disord. 2014;24:574–582. doi: 10.1016/j.nmd.2014.03.013. [DOI] [PMC free article] [PubMed] [Google Scholar]
- 11.Kinali M, Arechavala-Gomeza V, Cirak S, et al. Muscle histology vs MRI in Duchenne muscular dystrophy. Neurology. 2011;76:346–353. doi: 10.1212/WNL.0b013e318208811f. [DOI] [PMC free article] [PubMed] [Google Scholar]
- 12.Marden FA, Connolly AM, Siegel MJ, Rubin DA. Compositional analysis of muscle in boys with Duchenne muscular dystrophy using MR imaging. Skeletal Radiol. 2005;34:140–148. doi: 10.1007/s00256-004-0825-3. [DOI] [PubMed] [Google Scholar]
- 13.Liu GC, Jong YJ, Chiang CH, Jaw TS. Duchenne muscular dystrophy: MR grading system with functional correlation. Radiology. 1993;186:475–480. doi: 10.1148/radiology.186.2.8421754. [DOI] [PubMed] [Google Scholar]
- 14.Torriani M, Townsend E, Thomas BJ, et al. Lower leg muscle involvement in Duchenne muscular dystrophy: an MR imaging and spectroscopy study. Skeletal Radiol. 2012;41:437–445. doi: 10.1007/s00256-011-1240-1. [DOI] [PMC free article] [PubMed] [Google Scholar]
- 15.Forbes SC, Willcocks RJ, Triplett WT, et al. Magnetic resonance imaging and spectroscopy assessment of lower extremity skeletal muscles in boys with duchenne muscular dystrophy: a multicenter cross sectional study. PLoS One. 2014;9:e106435. doi: 10.1371/journal.pone.0106435. [DOI] [PMC free article] [PubMed] [Google Scholar]
- 16.Arpan I, Willcocks RJ, Forbes SC, et al. Examination of effects of corticosteroids on skeletal muscles of boys with DMD using MRI and MRS. Neurology. 2014;83:974–980. doi: 10.1212/WNL.0000000000000775. [DOI] [PMC free article] [PubMed] [Google Scholar]
- 17.Wren TA, Bluml S, Tseng-Ong L, Gilsanz V. Three-point technique of fat quantification of muscle tissue as a marker of disease progression in Duchenne muscular dystrophy: preliminary study. AJR Am J Roentgenol. 2008;190:W8–W12. doi: 10.2214/AJR.07.2732. [DOI] [PubMed] [Google Scholar]
- 18.Frahm J, Bruhn H, Gyngell ML, et al. Localized high-resolution proton NMR spectroscopy using stimulated echoes: initial applications to human brain in vivo. Magn Reson Med. 1989;9:79–93. doi: 10.1002/mrm.1910090110. [DOI] [PubMed] [Google Scholar]
- 19.Elliott MA, Walter GA, Swift A, et al. Spectral quantitation by principal component analysis using complex singular value decomposition. Magn Reson Med. 1999;41:450–455. doi: 10.1002/(sici)1522-2594(199903)41:3<450::aid-mrm4>3.0.co;2-9. [DOI] [PubMed] [Google Scholar]
- 20.Krssák M, Mlynárik V, Meyerspeer M, Moser E, Roden M. 1H NMR relaxation times of skeletal muscle metabolites at 3 T. MAGMA. 2004;16:155159. doi: 10.1007/s10334-003-0029-1. [DOI] [PubMed] [Google Scholar]
- 21.Bonati U, Hafner P, Schädelin S, et al. Quantitative muscle MRI: A powerful surrogate outcome measure in Duchenne muscular dystrophy. Neuromuscul Disord. 2015;25:679–685. doi: 10.1016/j.nmd.2015.05.006. [DOI] [PubMed] [Google Scholar]
- 22.Akima H, Lott D, Senesac C, et al. Relationships of thigh muscle contractile and non-contractile tissue with function, strength, and age in boys with Duchenne muscular dystrophy. Neuromuscul Disord. 2012;22:16–25. doi: 10.1016/j.nmd.2011.06.750. [DOI] [PMC free article] [PubMed] [Google Scholar]
- 23.Wattjes MP, Kley RA, Fischer D. Neuromuscular imaging in inherited muscle diseases. Eur Radiol. 2010;20:2447–2460. doi: 10.1007/s00330-010-1799-2. [DOI] [PMC free article] [PubMed] [Google Scholar]
- 24.Bushby K, Connor E. Clinical outcome measures for trials in Duchenne muscular dystrophy: report from International Working Group meetings. Clin Investig (Lond) 2011;1:1217–1235. doi: 10.4155/cli.11.113. [DOI] [PMC free article] [PubMed] [Google Scholar]
- 25.Lynn S, Aartsma-Rus A, Bushby K, et al. Measuring clinical effectiveness of medicinal products for the treatment of Duchenne muscular dystrophy. Neuromuscul Disord. 2015;25:96–105. doi: 10.1016/j.nmd.2014.09.003. [DOI] [PubMed] [Google Scholar]
- 26.Wokke BH, van den Bergen JC, Versluis MJ, et al. Quantitative MRI and strength measurements in the assessment of muscle quality in Duchenne muscular dystrophy. Neuromuscul Disord. 2014;24:409–416. doi: 10.1016/j.nmd.2014.01.015. [DOI] [PubMed] [Google Scholar]
- 27.Willis TA, Hollingsworth KG, Coombs A, et al. Quantitative muscle MRI as an assessment tool for monitoring disease progression in LGMD2I: a multicentre longitudinal study. PLoS One. 2013;8:e70993. doi: 10.1371/journal.pone.0070993. [DOI] [PMC free article] [PubMed] [Google Scholar]
- 28.Wokke BH, Bos C, Reijnierse M, et al. Comparison of dixon and T1-weighted MR methods to assess the degree of fat infiltration in duchenne muscular dystrophy patients. J Magn Reson Imaging. 2013;38:619–624. doi: 10.1002/jmri.23998. [DOI] [PubMed] [Google Scholar]
- 29.Loughran T, Higgins DM, McCallum M, et al. Improving highly accelerated fat fraction measurements for clinical trials in muscular dystrophy: origin and quantitative effect of R2* changes. Radiology. 2015;275:570–578. doi: 10.1148/radiol.14141191. [DOI] [PubMed] [Google Scholar]
- 30.Liu CY, Redheuil A, Ouwerkerk R, Lima JA, Bluemke DA. Myocardial fat quantification in humans: Evaluation by two-point water-fat imaging and localized proton spectroscopy. Magn Reson Med. 2010;63:892–901. doi: 10.1002/mrm.22289. [DOI] [PMC free article] [PubMed] [Google Scholar]
- 31.Fischmann A, Gloor M, Fasler S, et al. Muscular involvement assessed by MRI correlates to motor function measurement values in oculopharyngeal muscular dystrophy. J Neurol. 2011;258:1333–1340. doi: 10.1007/s00415-011-5937-9. [DOI] [PubMed] [Google Scholar]
- 32.Loganathan R, Bilgen M, Al-Hafez B, Smirnova IV. Characterization of alterations in diabetic myocardial tissue using high resolution MRI. Int J Cardiovasc Imaging. 2006;22:81–90. doi: 10.1007/s10554-005-5386-6. [DOI] [PubMed] [Google Scholar]
- 33.Rooney WD, Pollaro J, Forbes SC, Wang DJ, Vandenborne K, Walter GA. Application of the extended phase graph technique to improve T2 quantitation across sites. Proc Int Soc Mag Reson Med. 2011;19:138. [Google Scholar]
- 34.Azzabou N, Loureiro de Sousa P, Caldas E, Carlier PG. Validation of a generic approach to muscle water T2 determination at 3T in fat-infiltrated skeletal muscle. J Magn Reson Imaging. 2015;41:645–653. doi: 10.1002/jmri.24613. [DOI] [PubMed] [Google Scholar]
- 35.Henricson EK, Abresch RT, Cnaan A, et al. The cooperative international neuromuscular research group Duchenne natural history study: glucocorticoid treatment preserves clinically meaningful functional milestones and reduces rate of disease progression as measured by manual muscle testing and other commonly used clinical trial outcome measures. Muscle Nerve. 2013;48:55–67. doi: 10.1002/mus.23808. [DOI] [PMC free article] [PubMed] [Google Scholar]
- 36.McDonald CM, McDonald DA, Bagley A, et al. Relationship between clinical outcome measures and parent proxy reports of health-related quality of life in ambulatory children with Duchenne muscular dystrophy. J Child Neurol. 2010;25:1130–1144. doi: 10.1177/0883073810371509. [DOI] [PMC free article] [PubMed] [Google Scholar]
- 37.Pane M, Mazzone ES, Fanelli L, et al. Reliability of the Performance of Upper Limb assessment in Duchenne muscular dystrophy. Neuromuscul Disord. 2014;24:201–206. doi: 10.1016/j.nmd.2013.11.014. [DOI] [PubMed] [Google Scholar]
- 38.Willcocks RJ, Arpan IA, Forbes SC, et al. Longitudinal measurements of MRI-T2 in boys with Duchenne muscular dystrophy: effects of age and disease progression. Neuromuscul Disord. 2014;24:393–401. doi: 10.1016/j.nmd.2013.12.012. [DOI] [PMC free article] [PubMed] [Google Scholar]
- 39.Fischmann A, Hafner P, Gloor M, et al. Quantitative MRI and loss of free ambulation in Duchenne muscular dystrophy. J Neurol. 2013;260:969–974. doi: 10.1007/s00415-012-6733-x. [DOI] [PubMed] [Google Scholar]


