Abstract
During the development of recombinant monoclonal antibody (rMAb) drugs, glycosylation receives particular focus because changes in the attached glycans can have a significant impact on the antibody effector functions. The vast heterogeneity of structures that exist across glycosylation sites hinders the in-depth analysis of glycan changes specific to an individual protein within a complex mixture. In this study, we established a sensitive and specific method for monitoring site-specific glycosylation in rMAbs using multiple reaction monitoring (MRM) on an ultra high performance liquid chromatography – triple quadrupole MS (UHPLC-QqQ-MS). Our results showed that irrespective of the IgG subclass expressed in the drugs, the N-glycopeptide profiles are nearly the same but differ in abundances. In all rMAb drugs, a single subclass of IgG comprised over 97% of the total IgG content and showed over 97% N-glycan site occupancy. This study demonstrates the utility of an MRM-based method to rapidly characterize over 130 distinct glycopeptides and determine the extent of site occupancy within minutes. Such multi-level structural characterization is important for the successful development of therapeutic antibodies.
INTRODUCTION
Recombinant monoclonal antibody (rMAb) drugs have emerged as an effective biopharmaceutical for cancer and other chronic diseases1–4 due to the specificity of these drugs toward target antigens. They function by activating the immune system to kill tumor cells, blocking the signal transduction of tumor cells to proliferate, or carrying drugs to tumor cells as radiation targets.1 Currently, there are more than 30 approved rMAb drugs and hundreds of new rMAb drug candidates under clinical trials.5 To date, all licensed rMAbs have been of the immunoglobulin G (IgG) class; however, the four subclasses of IgG (IgG1, IgG2, IgG3 & IgG4) also exhibit unique effector functions.6 Therefore, it is important to select the IgG subclass that is anticipated to have the most potent activity for a given disease. Further studies have shown that the glycosylation of IgG influences both its physiochemical properties and, more importantly, its cell-mediated effector functions such as complement binding and activation.7–10 These biological functions are dependent not only on the presence or absence of N-linked oligosaccharides but also on the specific structure of the oligosaccharides.10 Clearly, in manufacturing therapeutic recombinant monoclonal antibodies, the site-specific N-glycosylation and assessment of N-glycan site occupancy are of utmost importance.11–14
Today, the focus on discovery and development of rMAb drugs continues to grow rapidly within the pharmaceutical industry, driven by a recognition of their significant advantages over traditional small molecule drugs.15 This growth is accompanied by new challenges in quality control and analytical characterization during drug development and production. Consequently, there is an urgent demand for developing high-performance analytical techniques for characterization of N-glycosylation and quantitation of the N-glycan site occupancy of rMAbs.
Quantitation of protein N-glycosylation is a challenging task. The lack of commercially available N-glycosylated standards precludes absolute quantitation, thus the quantitation of glycosylation is performed by relative comparisons of glycan/glycopeptide signals obtained using various detection systems.16,17 Until now, capillary electrophoresis with laser-induced fluorescence detection has been applied for the analysis of released N-linked carbohydrate moieties from an IgG1 monoclonal antibody, rituximab.18 However, based on this technique, identification is performed only by referring to retention or migration time, which cannot be used for characterizing unknown compounds. Furthermore, in using spectrophotometric detection, the released glycans need to be derivatized, which results in inter-laboratory variability due to incomplete derivatization.19 An alternative to label-free fluorescence detection of released glycans is high-performance anion-exchange chromatography with pulsed amperometric detection (HPAEC-PAD).20,21 Although this technique is less tedious, it is also less sensitive and less selective than LC-fluorescence approaches. For these reasons, in recent glycan quantitation research, LC-MS has become the common technique in analyzing released N-glycans, using Q-TOF,20,21 IT22,23 or Orbitrap24 MS. However, because the glycans are released from the proteins prior to analysis, information about the original protein and site of attachment are lost. Site-specific characterization of glycosylation is a powerful, more informative analytical tool in evaluating which specific sites are susceptible to changes when monitoring quality control and establishing the impact of introducing new steps during rMAb expression and purification. Triple quadrupole (QqQ) mass spectrometry with multiple reaction monitoring (MRM) is valued for its potential towards the reliable quantitation of analytes of low abundance in complex mixtures.25 We previously showed that MRM is a robust and sensitive technique for the characterization of immunoglobulin G and for site-specific quantitation relative to the protein content.26
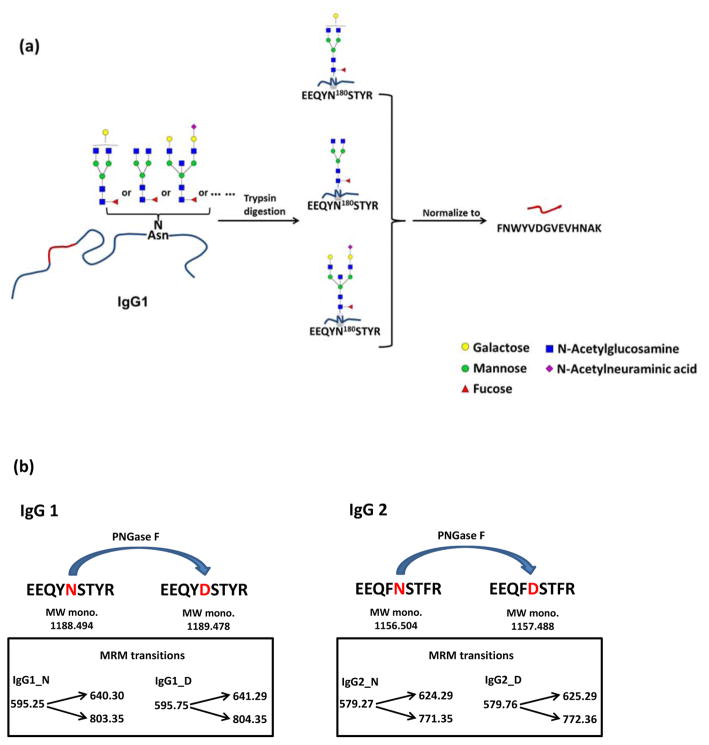
In this study, we have refined the MRM method to observe and quantify high and low abundant N-glycopeptides in both a protein- and site-specific manner directly from rMAbs without protein enrichment nor N-glycan release. Because the glycopeptide absolute ion abundances are greatly affected by protein concentration, we adopted a normalization method in which glycopeptide signals are normalized to the abundance of a distinguishing peptide belonging to the parent IgG subclass. Figure 1a shows the glycopeptide normalization method for IgG1, which was also applied for the other IgG subclasses. Furthermore, to quantify N-glycan site occupancy of rMAbs, we utilized MRM to detect the conversion of asparagine to aspartic acid at the glycosylation site by releasing the N-glycans with PNGase F, which increases the peptide molecular weight by 0.984 Da. (Figure 1b). This module was developed for IgG1 and IgG2 subclasses as the six rMAbs that we analyzed were mainly composed of IgG1 and IgG2. The MRM quantitation methods employed in this study enable rapid analysis of multiple glycoforms simultaneously within a run time of 10 minutes per sample. Here, we monitored over 130 glycopeptide transitions and determined the site-specific glycosylation and the site occupancy for each rMAb drug.
Figure 1.
Illustration of method development: (a) glycopeptide normalization method for IgG1, (b) MRM method for quantification of N-glycan site occupancy in IgG1 and IgG2.
EXPERIMENTAL PROCEDURES
Chemicals and Reagents
The rMAb drugs used in this study, panitumumab, trastuzumab, cetuximab, bevacizumab, rituximab and infliximab, were obtained from the University of California Davis Medical Center. IgG1 and IgG2 peptide standards (EEQYNSTYR, EEQYDSTYR, EEQFNSTFR and EEQFDSTFR) were purchased from A&A Labs (San Diego, CA). Sequencing grade modified trypsin and dithiothreitol (DTT) were purchased from Promega (Madison, WI). Iodoacetamide (IAA) was purchased from Sigma-Aldrich (St. Louis, MO). Peptide N-glycosidase F (PNGase F) was obtained from New England Biolabs (Ipswich, MA). All reagents were of analytical or HPLC grade.
Compositional Analysis and Quantitation of N-Glycopeptides in rMAbs
Samples were prepared by using 40 μg of rMAbs reconstituted in 50 mM NH4HCO3 to a total volume of 100 μL. Proteins were reduced using 2 μL of 550 mM DTT in a 60°C water bath for 50 min, and alkylated using 4 μL of 450 mM IAA at room temperature in the dark for 30 min. Then, 1 μg of trypsin in 10 μL of 50 mM NH4HCO3 was added and proteins were digested in a 37°C incubator for 18 h. When digestion was completed, the samples were kept at −20°C for 1 h to stop the reaction. The resulting peptide samples were used directly for mass spectrometric analysis without further sample cleanup or dilution.
Determination of N-Glycan Site Occupancy of rMAbs
Accurate amounts of IgG1 and IgG2 peptide standards (EEQYNSTYR, EEQYDSTYR, EEQFNSTFR and EEQFDSTFR) were weighed using a XP26 microbalance (Mettler Toledo, Columbus, OH), and dissolved in 50 mM NH4HCO3 to make 4 mg/mL stock solutions. A 25 μL stock solution of IgG1 and IgG2 were combined to make a standard peptide mixture. The standard protein mixture was serially diluted in nanopure water to obtain calibration curves for quantitation. For the sample preparation, 40 μg of rMAbs were reconstituted in 50 mM NH4HCO3 to a total volume of 100 μL. Proteins were reduced using 2 μL of 550 mM DTT in a 60°C water bath for 50 min, and alkylated using 4 μL of 450 mM IAA at room temperature in the dark for 30 min. Then, 1 μg of trypsin in 10 μL of 50 mM NH4HCO3 was added and proteins were digested in a 37°C incubator for 18 h. After digestion, the samples were kept at −20°C for 1 h to stop the reaction and then the samples were thawed at room temperature before N-glycan release. To release the N-glycans, 2 μL of PNGase F was added to the samples, which were then incubated at 37°C in a microwave reactor (CEM Corporation, Matthews, NC) for 10 min at 20 watts. The samples were purified using solid phase extraction (SPE). The C18 SPE cartridge was preconditioned with three column volumes of pure water in 0.1% TFA, three volumes of 80% acetonitrile (ACN), and three volumes of pure water in 0.1% TFA. The samples were loaded on the column and washed with three volumes of pure water in 0.1% TFA, prior to eluting with two volumes of 40% ACN in 0.1% TFA and two volumes of 80% ACN in 0.1% TFA, and dried completely. The samples were reconstituted with 100 μL nanopure water prior to injection.
Nano-LC-Chip-Quadrupole-Time-of-Flight (Q-TOF) MS/MS Analysis
Tandem MS data of peptides and glycopeptides were obtained by injecting 2 μL of sample into an Agilent 1200 series HPLC-Chip system coupled to an Agilent 6520 Q-TOF mass spectrometer (Agilent Technologies, Santa Clara, CA). The microfluidic chip consisted of C18 (300 Å, 5 μm) enrichment (4 mm, 40 nL) and separation (43 mm × 75 μm) columns with a nanoelectrospray tip. LC separation was performed using a 60-min binary gradient at a flow rate of 0.3 μL/min. Solvent A consisted of 3% acetonitrile and 0.1% formic acid in nanopure water (v/v); solvent B consisted of 90% acetonitrile and 0.1% formic acid in nanopure water (v/v). The mass spectrometer was operated in the positive mode. Collision energies (Vcollision) were calculated on the basis of m/z values using equation (1) for peptides and equation (2) for glycopeptides.
| (1) |
| (2) |
Ultra High Performance Liquid Chromatography (UHPLC)-Triple Quadrupole (QqQ) MS Analysis
The MRM method was developed on an Agilent 1290 Infinity UHPLC system coupled to an Agilent 6490 triple quadrupole mass spectrometer (Agilent Technologies, Santa Clara, CA). An Agilent Eclipse Plus C18 column (RRHD 1.8 μm, 2.1 mm × 100 mm) was used for UHPLC separation.
For quantitation of peptides and glycopeptides, 2 μL of sample was injected and separated by using a 10-minute binary gradient with solvent A consisting of 3% acetonitrile and 0.1% formic acid; solvent B consisting of 90% acetonitrile and 0.1% formic acid in nanopure water (v/v) at a flow rate of 0.5 mL/min. A 10-minute gradient was applied as follows: 0 min at 2% B; 2.5 min at 5% B; 7.0 min at 40% B; the column was washed at 100% B from 7.1 min to 8.6 min, and reequilibrated at 2.0% B from 8.7 min to 10 min.
The quantitation of N-glycan site occupancy was done by using a 13-minute binary gradient as follows: 0~2 min at 2% B; 6 min at 6% B; 6.1 min at 8% B; 10~11 min at 10% B; the column was washed at 100% B from 11.1 min to 12 min, and reequilibrated at 2% B from 12.1 min to 13 min.
To reduce the cycle time, dynamic MRM mode was used at unit resolution. For this analysis, the cycle time was fixed at 500 ms. The dwell time was varied depending on the number of concurrent transitions. Ionization was performed in the positive mode. Results were analyzed using MassHunter Quantitative Analysis B.06.00 (Agilent Technologies, Santa Clara, CA).
RESULTS AND DISCUSSION
A system-wide glycoproteomic analytical platform based on multiple reaction monitoring (MRM) was developed for the characterization of therapeutic monoclonal antibodies at the site-specific level, enabling quantitation of distinct glycoforms without glycan release and protein enrichment steps. Using this approach, the glycosylation of IgG molecules in six rMAb drugs was mapped in the following way: Per given occupied glycosylation site, we determined the heterogeneity of attached glycans and the degree of site occupancy.
Construction of the Dynamic MRM Method
Tandem MS of Peptides and Glycopeptides in rMAbs
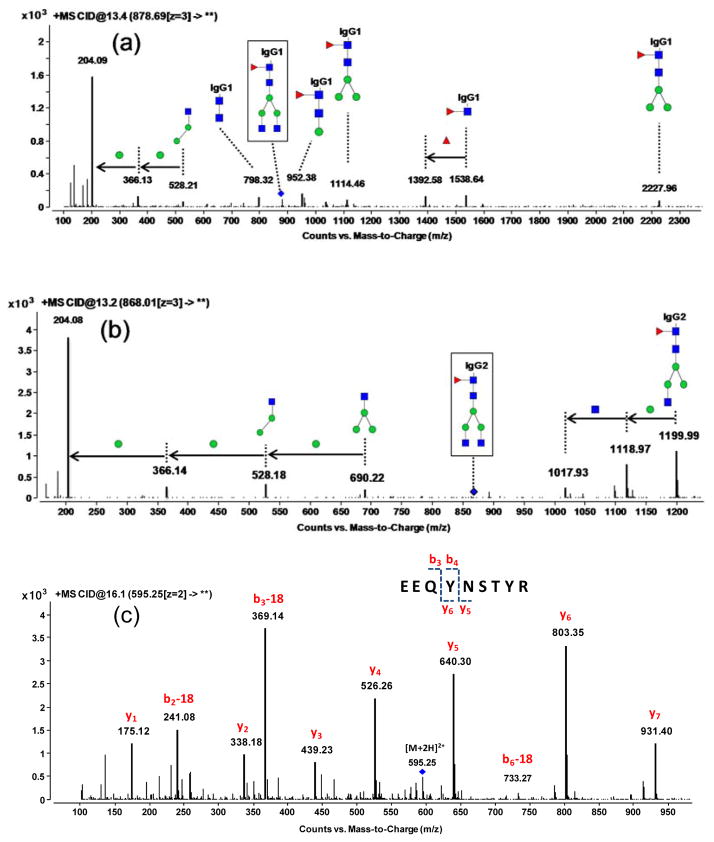
To build MRM transitions, the collision induced dissociation (CID) behavior of the selected surrogate glycopeptides and quantitating peptides was initially examined using Q-TOF-MS/MS. The tandem mass spectra of two glycopeptides (Hex3HexNAc4Fuc1_IgG1 and Hex3HexNAc4Fuc1_IgG2) are shown in Figure 2a and 2b, where the abundant ions are characteristic of glycan fragmentation. Thus, for glycopeptide identification, the most abundant and common carbohydrate oxonium ions, HexNAc (m/z 204.08) and Hex1HexNAc1 (m/z 366.14),27–29 were used as diagnostic fragments (Figure S1). Glycopeptides were identified using a library of glycan structures released from the same rMAb drugs.21 A partial list of the MRM transitions and their respective fragmentation voltages is shown in Table 1. The complete list is given in the Supporting Information (Table S1).
Figure 2.
Representative Q-TOF tandem mass spectra of glycopeptides and peptides: (a) MS/MS spectrum of glycopeptide Hex3HexNAc4Fuc1_EEQYNSTYR from IgG1, (b) MS/MS spectrum of glycopeptide Hex3HexNAc4Fuc1_EEQFNSTFR from IgG2, and (c) MS/MS spectrum of peptide EEQYNSTYR from IgG1. A blue diamond is drawn above the selected precursor ion.
Table 1.
MRM Transitions Used to Monitor Glycopeptides
| Compound Namea | Precursor Ion (m/z) | Product Ion (m/z) | Collision Energy (eV) | Retention Time (min) | Delta Retention Timeb (min) | Structures |
|---|---|---|---|---|---|---|
| 3.2.0.0.0_IgG1 | 694.6 | 204.1 | 15 | 2.6 | 1 |

|
| 3.2.1.0.0_IgG1 | 743.3 | 204.1 | 16 | 2.6 | 1 |

|
| 3.3.0.0.0_IgG1 | 762.3 | 204.1 | 16 | 2.6 | 1 |

|
| 3.3.1.0.0_IgG1 | 811.0 | 204.1 | 17 | 2.6 | 1 |

|
| 3.4.0.0.0_IgG1 | 830.0 | 204.1 | 18 | 2.6 | 1 |

|
3.2.0.0.0_IgG1 indicates 3 Hexose; 2 HexNAc; 0 Fucose; 0 N-Acetylneuraminic acid; 0 N-Glycolylneuraminic acid from IgG1.
Dynamic MRM was used. Delta retention time is the retention time window for the target transition.
Each subclass of IgG was differentiated by a distinguishing peptide: FNWYVDGVEVHNAK (IgG1); CCVECPPCPAPPVAGPSVFLFPPKPK (IgG2); WYVDGVEVHNAK (IgG3); TTPPVLDSDGSFFLYSR (IgG4). For these peptides, the following transitions were determined to be optimal based on their fragmentation patterns: ([M+2H]2+ 839.4→m/z 968.5 and m/z 1067.6) for IgG1, ([M+3H]3+ 970.1→m/z 1100.6 and m/z 839.5) for IgG2, ([M+3H]3+ 472.9→m/z 697.4 and m/z 534.3) for IgG3 and ([M+3H]3+ 635.0→m/z 1217.6 and m/z 425.2) for IgG4.
For the absolute quantification of N-glycan site occupancy, the appropriate product ions were selected for MRM according to abundances as well as the sequence to include ions containing an asparagine (N). The corresponding peptide replaced by an aspartic acid (D) residue after N-glycan release was subsequently monitored (e.g., EEQYNSTYR/EEQYDSTYR, EEQFNSTFR/EEQFDSTFR). A representative fragmentation spectrum of the IgG1 (N) peptide backbone EEQYNSTYR is shown in Figure 2c. For the quantitation of site occupancy in IgG1 and IgG2, the following transitions were determined to be optimal: ([M+2H]2+ 595.25→m/z 803.35 and m/z 640.30) for the IgG1 (N) peptide EEQYNSTYR; ([M+2H]2+ 595.75→m/z 804.35 and m/z 641.29) for the IgG1 (D) peptide EEQYDSTYR; ([M+2H]2+ 579.27→m/z 771.35 and m/z 624.29) for the IgG2 (N) peptide EEQFNSTFR; and ([M+2H]2+ 579.76→m/z 772.36 and m/z 625.29) for the IgG2 (D) peptide EEQFDSTFR.
Multiple Reaction Monitoring of IgG Subclasses and Their Glycoforms in rMAbs
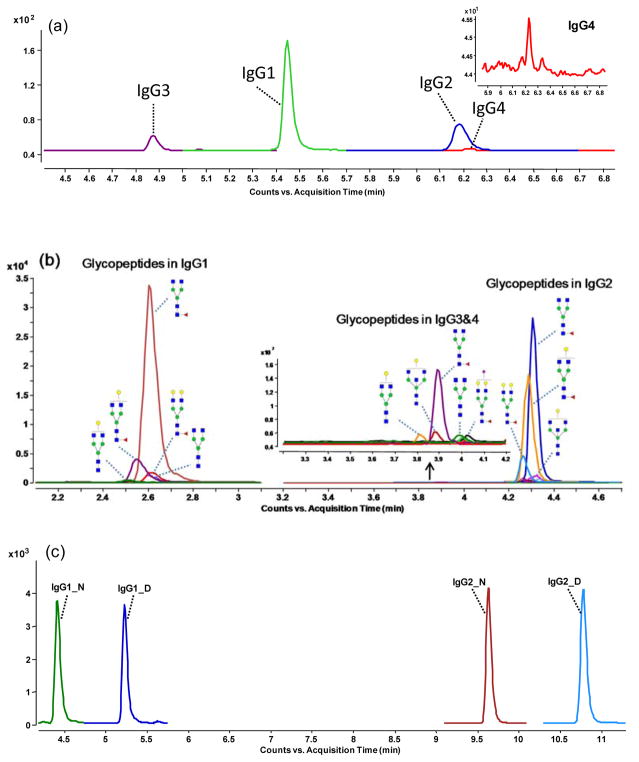
From the six rMAb drugs, a total of four peptides, representing each of the IgG subclasses, and 138 unique glycopeptides were monitored. All peptides and glycopeptides were separated using C18 ultra high performance liquid chromatography (UHPLC). As demonstrated in Figure 3a, good separation of the IgG peptides was achieved within two minutes. These peptides showed high repeatability and were used for quantitation. The MRM chromatograms of the glycopeptides from the four IgG subclasses are shown in Figure 3b. Glycopeptides from IgG1 eluted at 2.6 min, followed by IgG3/4 glycopeptides at 3.7 min and IgG2 glycopeptides at 4.2 min. In general, the glycopeptides eluted earlier than the peptides, resulting in higher sensitivity and less charge competition. The representative chromatogram in Figure 3c shows the responses of the IgG1, de-glycosylated IgG1, IgG2 and de-glycosylated IgG2 peptides that were used for quantitation of site occupancy.
Figure 3.
Representative chromatograms of peptides and glycopeptides: (a) MRM chromatogram of the four IgG subclass peptides, (b) MRM chromatogram of glycopeptides in each of the four subclasses, and (c) MRM chromatogram of glycosylated and deglycosylated IgG1 and IgG2 peptides with asparagine and aspartic acid residues.
The peptide-centric separation of glycopeptides on the C18 stationary phase results in co-elution of glycoforms that share the same peptide backbone. However, performing multiple concurrent transitions will necessitate either a longer cycle time, which will lower the sampling efficiency, or a shorter dwell time, which will result in a poor signal-to-noise ratio. Therefore, in our experiments, dynamic MRM mode was applied wherein the transitions are performed only at a specific time segment, reserving the duty cycle for compounds with overlapping retention times.26 The dynamic MRM transitions employed for all rMAbs are included in Table S1. In addition, to further reduce the number of concurrent transitions, only one transition was chosen for each glycopeptide according to abundance. We have previously shown that single transition monitoring in conjunction with dynamic MRM provides sufficient specificity as it both identifies the compound as a glycopeptide and enables quantitation.26
Analysis of IgG Glycosylation in rMAbs
Quantitation of Glycopeptides and Protein Glycosylation
Due to the lack of available standards, relative quantitation of protein glycosylation is provided by using absolute ion abundances.16,30,31 However, because protein concentration greatly influences signal intensity, we adopted a normalization method to account for the differences in IgG1-4 content in the rMAb drugs. Each glycopeptide was normalized to the abundance of the corresponding IgG molecule as follows:
The quantifying peptides were selected based on the conditions that it must be unique only to the originating subclass, abundant and devoid of post-translational modifications (PTMs).
IgG1 and IgG2 yielded distinct glycopeptides that could be individually monitored and normalized to their related subclasses. However, glycopeptides from IgG3 (EEQYN*STFR) and IgG4 (EEQFN*STYR) contain the same amino acid residues and therefore could not be distinguished. Consequently, for IgG3 and IgG4, the abundances of the two contributing peptides were summed together for normalization.
N-Glycan and N-Glycopeptide Profiles of rMAb Drugs
Following IgG subclass quantification, we observed that all of the rMAb drugs in this study are predominantly IgG1 except panitumumab, which mainly consists of IgG2 (Figure S2). These results show that the rMAb drugs are not purely of one subclass but the main subclass comprises over 97% of the total IgG.
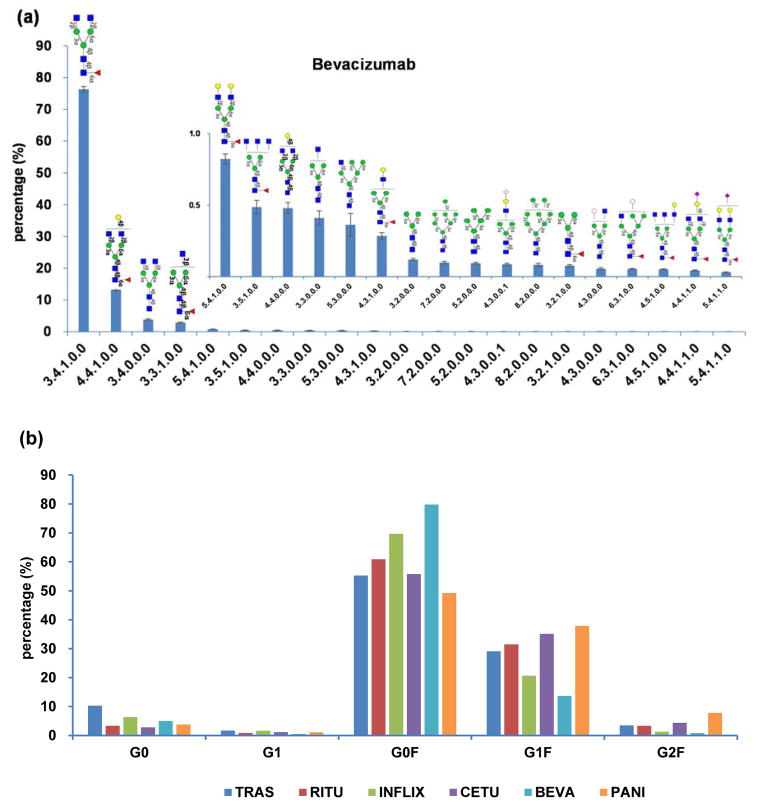
For each rMAb drug, we classified the glycans by their originating glycopeptide and by abundance to compare glycoproteome quantitation data with released glycan analysis. For example, the N-glycan profile of IgG1 from bevacizumab is shown in Figure 4a. We have previously compiled an N-glycan library of over 70 structures with isomer and linkage specificity based on a group of rMAbs analyzed by nano-LC electrospray ionization quadrupole time-of-flight (nano-LC-ESI-Q-TOF) MS.21 According to the N-glycosylation analysis, glycopeptides bearing high mannose type and sialylated biantennary complex type glycans make up less than 1% in relative abundances. The most common glycan structures in IgG possess zero, one, or two terminal galactose (G) residues and up to one fucose (F), and are defined as G0, G1, G0F, G1F and G2F.32–34 In this context, the abundances of glycopeptides analyzed in this study were grouped by the presence of these glycan structures. Figure 4b shows the distribution of these N-glycopeptides across the main IgG subclass of each antibody drug. All six rMAbs express the common glycan structures on either IgG1 or IgG2 but in different quantities. These results agree with the previous N-glycan study, which showed that most of the N-glycans between different antibodies are nearly the same but differ in abundances. It was also observed that the most abundant glycopeptides in the rMAb drugs were fucosylated.
Figure 4.
Representative profile of N-glycopeptides of rMAb drugs: (a) The N-glycan profile of IgG1 glycopeptides from Bevacizumab, (b) The N-glycopeptide distribution of six rMAb drugs.
For the relative comparison of glycoforms using MRM, a major concern is whether the response is affected by the nature of ionization and fragmentation. Recent research has shown that the ionization efficiencies of different glycoforms with the same peptide moiety are similar in electrospray ionization.35 To evaluate the contributing effects of different fragmentation efficiencies, we compared the N-glycan distribution profiles of panitumumab from Chip-Q-TOF-MS and QqQ-MS and observed that they were similar in both analyses (Figure 5). Therefore, it is possible to compare abundances of glycopeptides from MRM signals to study the distribution of N-glycans in rMAbs.
Figure 5.
Comparison of the panitumumab N-glycan distribution profiles between Chip-Q-TOF-MS and QqQ-MS.
N-Glycan Site Occupancy of rMAb Drugs
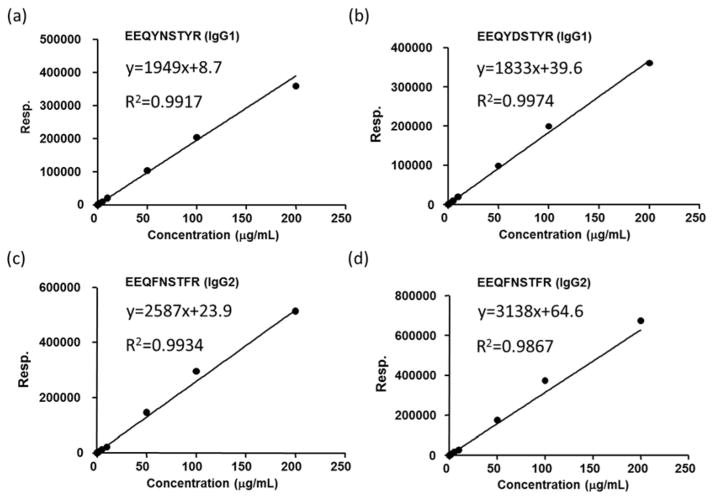
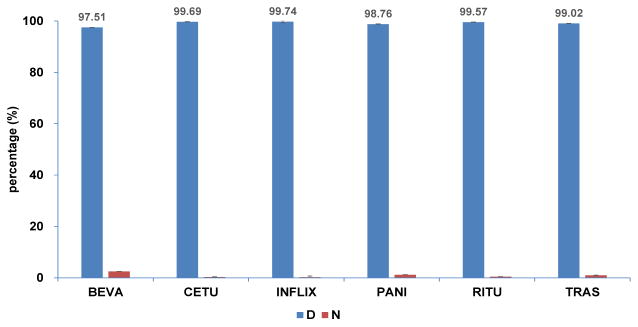
As PNGase F treatment of glycopeptides results in the deamidation of the asparagine (N) at the NxS/T site, the asparagine (N) to aspartic acid (D) conversion is used as a ‘signature’ for site occupancy. Accordingly, for site occupancy quantification of rMAb drugs, PNGase F treatment was performed to remove all N-linked glycans. The deglycosylated peptides and unoccupied peptides were then monitored simultaneously using MRM. The site occupancy was determined by the absolute concentration of deglycosylated peptides (D) and unoccupied peptides (N). Absolute concentrations of peptides were calculated using calibration curves made by serial dilutions of peptide standards, as depicted for IgG1 and IgG2 in Figure 6. The response of each peptide was plotted against concentration (0.1, 0.5, 1, 2, 5, 10, 50, 100, 200 μg/mL) and fit with good linearity. The percentage of N-glycan site occupancy for the six rMAb drugs is shown in Figure 7. All six drugs were highly glycosylated with over 97% site occupancy.
Figure 6.
Calibration curves used for quantitation of: (a) peptide EEQYNSTYR, which is indicative of unoccupied IgG1; (b) peptide EEQYDSTYR, which results from IgG1 after N-glycan release; (c) peptide EEQFNSTFR, which is indicative of unoccupied IgG2; (d) peptide EEQFDSTFR, which results from IgG2 after N-glycan release.
Figure 7.
The percentage of N-glycan site occupancy for six rMAb drugs, where occupied sites possessed aspartic acid (D) residues and unoccupied sites possessed asparagine (N) residues after PNGase F treatment.
CONCLUSION
In this study, we developed an MRM method that is not only rapid in profiling the N-glycome but that which also provides the glycoproteome details. The established methods are effective in simultaneously determining the N-glycan compositions, their sites of attachment and the site occupancy in commercial rMAb drugs. Using this approach, we determined that the six rMAb drugs analyzed in this study have similar glycopeptides but in different quantities and all of the drugs are highly glycosylated with the N-glycan site occupancy of over 97%.
The FDA and other regulatory agencies require data on the analytical characterization of rMAbs.36 The methods developed in this study are rapid and highly specific. They can be widely used to determine the protein-specific glycan profile in rMAbs and percent site occupancy during drug development and also in quality control. Further, these methods can be easily used to check batch-to-batch consistency, which is essential because the molecular heterogeneity of rMAbs will affect their stability and their potency. Understanding the distributions of N-glycan structures at the site-specific level can provide more information on the activities of rMAbs and is beneficial in optimizing their clinical outcomes for different diseases.
Acknowledgments
Funding provided by the National Institutes of Health (RO1AT008759, AT007079 to C.B.L.) is gratefully acknowledged. This project was also sponsored by the China Scholarship Council.
Footnotes
Notes
The authors declare no competing financial interest.
References
- 1.Adams GP, Weiner LM. Nat Biotechnol. 2005;23:1147–1157. doi: 10.1038/nbt1137. [DOI] [PubMed] [Google Scholar]
- 2.Oldham RK, Dillman RO. J Clin Oncol. 2008;26:1774–1777. doi: 10.1200/JCO.2007.15.7438. [DOI] [PubMed] [Google Scholar]
- 3.Waldmann TA. Nat Med. 2003;9:269–277. doi: 10.1038/nm0303-269. [DOI] [PubMed] [Google Scholar]
- 4.Weiner LM. Semin Oncol. 1999;26:41–50. [PubMed] [Google Scholar]
- 5.Leavy O. Nat Rev Immunol. 2010;10 [Google Scholar]
- 6.Jefferis R. Nat Rev Drug Discov. 2009;8:226–234. doi: 10.1038/nrd2804. [DOI] [PubMed] [Google Scholar]
- 7.Winkelhake JL. Immunochemistry. 1978;15:695–714. doi: 10.1016/0161-5890(78)90044-5. [DOI] [PubMed] [Google Scholar]
- 8.Rademacher TW, Parekh RB, Dwek RA. Annu Rev Biochem. 1988;57:785–838. doi: 10.1146/annurev.bi.57.070188.004033. [DOI] [PubMed] [Google Scholar]
- 9.Tsuchiya N, Endo T, Matsuta K, Yoshinoya S, Aikawa T, Kosuge E, Takeuchi F, Miyamoto T, Kobata A. J Rheumatol. 1989;16:285–290. [PubMed] [Google Scholar]
- 10.Wright A, Morrison SL. Trends Biotechnol. 1997;15:26–32. doi: 10.1016/S0167-7799(96)10062-7. [DOI] [PubMed] [Google Scholar]
- 11.Kobata A. Eur J Biochem. 1992;209:483–501. doi: 10.1111/j.1432-1033.1992.tb17313.x. [DOI] [PubMed] [Google Scholar]
- 12.Jefferis R. Biotechnol Prog. 2005;21:11–16. doi: 10.1021/bp040016j. [DOI] [PubMed] [Google Scholar]
- 13.Sinclair AM, Elliott S. J Pharm Sci. 2005;94:1626–1635. doi: 10.1002/jps.20319. [DOI] [PubMed] [Google Scholar]
- 14.Shields RL, Lai J, Keck R, O’Connell LY, Hong K, Meng YG, Weikert SH, Presta LG. J Biol Chem. 2002;277:26733–26740. doi: 10.1074/jbc.M202069200. [DOI] [PubMed] [Google Scholar]
- 15.Ji C, Sadagopan N, Zhang Y, Lepsy C. Anal Chem. 2009;81:9321–9328. doi: 10.1021/ac901800f. [DOI] [PubMed] [Google Scholar]
- 16.Roth Z, Yehezkel G, Khalaila I. International Journal of Carbohydrate Chemistry. 2012;2012 [Google Scholar]
- 17.Ruhaak LR, Huhn C, Waterreus W-J, de Boer AR, Neususs C, Hokke CH, Deelder AM, Wuhrer M. Analytical chemistry. 2008;80:6119–6126. doi: 10.1021/ac800630x. [DOI] [PubMed] [Google Scholar]
- 18.Ma S, Nashabeh W. Anal Chem. 1999;71:5185–5192. doi: 10.1021/ac990376z. [DOI] [PubMed] [Google Scholar]
- 19.Spellman MW. Anal Chem. 1990;62:1714–1722. doi: 10.1021/ac00216a002. [DOI] [PubMed] [Google Scholar]
- 20.Oh MJ, Hua S, Kim BJ, Jeong HN, Jeong SH, Grimm R, Yoo JS, An HJ. Bioanalysis. 2013;5:545–559. doi: 10.4155/bio.12.327. [DOI] [PubMed] [Google Scholar]
- 21.Song T, Ozcan S, Becker A, Lebrilla CB. Anal Chem. 2014;86:5661–5666. doi: 10.1021/ac501102t. [DOI] [PMC free article] [PubMed] [Google Scholar]
- 22.Jensen PH, Karlsson NG, Kolarich D, Packer NH. Nat Protoc. 2012;7:1299–1310. doi: 10.1038/nprot.2012.063. [DOI] [PubMed] [Google Scholar]
- 23.Wang Z, Hilder TL, van der Drift K, Sloan J, Wee K. Anal Biochem. 2013;437:20–28. doi: 10.1016/j.ab.2013.02.006. [DOI] [PubMed] [Google Scholar]
- 24.Chevreux G, Faid V, Scohyers JM, Bihoreau N. Glycobiology. 2013;23:1531–1546. doi: 10.1093/glycob/cwt085. [DOI] [PMC free article] [PubMed] [Google Scholar]
- 25.Lange V, Picotti P, Domon B, Aebersold R. Mol Syst Biol. 2008;4:14. doi: 10.1038/msb.2008.61. [DOI] [PMC free article] [PubMed] [Google Scholar]
- 26.Hong Q, Lebrilla CB, Miyamoto S, Ruhaak LR. Anal Chem. 2013;85:8585–8593. doi: 10.1021/ac4009995. [DOI] [PMC free article] [PubMed] [Google Scholar]
- 27.Nwosu CC, Seipert RR, Strum JS, Hua SS, An HJ, Zivkovic AM, German BJ, Lebrilla CB. J Proteome Res. 2011;10:2612–2624. doi: 10.1021/pr2001429. [DOI] [PMC free article] [PubMed] [Google Scholar]
- 28.Conboy JJ, Henion JD. J Am Soc Mass Spectrom. 1992;3:804–814. doi: 10.1016/1044-0305(92)80003-4. [DOI] [PubMed] [Google Scholar]
- 29.Wuhrer M, Deelder AM, van der Burgt YE. Mass Spectrom Rev. 2011;30:664–680. doi: 10.1002/mas.20337. [DOI] [PubMed] [Google Scholar]
- 30.Kronewitter SR, de Leoz ML, Peacock KS, McBride KR, An HJ, Miyamoto S, Leiserowitz GS, Lebrilla CB. J Proteome Res. 2010;9:4952–4959. doi: 10.1021/pr100202a. [DOI] [PMC free article] [PubMed] [Google Scholar]
- 31.Harvey DJ, Royle L, Radcliffe CM, Rudd PM, Dwek RA. Anal Biochem. 2008;376:44–60. doi: 10.1016/j.ab.2008.01.025. [DOI] [PubMed] [Google Scholar]
- 32.Masuda K, Yamaguchi Y, Kato K, Takahashi N, Shimada I, Arata Y. FEBS Lett. 2000;473:349–357. doi: 10.1016/s0014-5793(00)01557-x. [DOI] [PubMed] [Google Scholar]
- 33.Krapp S, Mimura Y, Jefferis R, Huber R, Sondermann P. J Mol Biol. 2003;325:979–989. doi: 10.1016/s0022-2836(02)01250-0. [DOI] [PubMed] [Google Scholar]
- 34.Damen CW, Chen W, Chakraborty AB, van Oosterhout M, Mazzeo JR, Gebler JC, Schellens JH, Rosing H, Beijnen JH. J Am Soc Mass Spectrom. 2009;20:2021–2033. doi: 10.1016/j.jasms.2009.07.017. [DOI] [PubMed] [Google Scholar]
- 35.Sinha S, Pipes G, Topp EM, Bondarenko PV, Treuheit MJ, Gadgil HS. J Am Soc Mass Spectrom. 2008;19:1643–1654. doi: 10.1016/j.jasms.2008.07.004. [DOI] [PubMed] [Google Scholar]
- 36.Administration, U. S. F. a. D. 2008


