Abstract
Simple and rapid methods for analysis of monoclonal antibody structure and post-translational modifications are increasingly needed due to the explosion of therapeutic monoclonal antibodies and monoclonal antibody applications. Mass spectral analysis is a powerful method for characterizing monoclonal antibodies. Recent discovery and commercialization of the Immunoglobulin G-degrading enzyme of Streptococcus pyogene (IdeS protease) has facilitated and improved the generation of antibody fragments of suitable size to allow characterization of the structure of the entire antibody molecule via analysis of just a few fragments. In this study, we coupled IdeS fragmentation and simultaneous reduction and alkylation of the resultant fragments using tributylphosphine and iodoacetamide to prepare samples in about 2 hours. Following simple introduction of a single, unseparated mixture of alkylated fragments into a mass spectrometer, detailed structural information is obtained, covering the entire antibody molecule. The large majority of the glycoforms present on the single, conserved N-linked glycosylation site of the heavy chain is elucidated, although some of the very low abundance glycoforms are not determined by this protocol. The ease, simplicity, speed, and power of this method make it attractive for analysis of the developmental stages and production batches of therapeutic monoclonal antibodies.
Keywords: Monoclonal antibody, post-translational modifications, IdeS cleavage, tributylphosphine reduction, mass spectrometry, glycoform determination
Graphical Abstract
Introduction
Monoclonal antibodies (mAbs) have become increasingly important therapeutics agents, and now constitute a substantial percentage of therapeutics in medical use, drugs newly approved by the FDA, and agents in human clinical trials. Unlike small molecule drugs, large therapeutic mAbs are more complicated in terms of their production, purification, and quality control parameters. Because therapeutic mAbs are typically recombinant proteins produced in stably transfected cell lines, there are multiple variations in post-translational modifications on a given monoclonal antibody. Thus, there is an ever-increasing need to efficiently characterize antibodies for post-translational modifications, and to subsequently evaluate the in vivo ramifications of these varying post-translation modifications. Our laboratory has developed a humanized mAb that has high affinity for cocaine and specificity for cocaine over its inactive metabolites [1]. Furthermore, this recombinant mAb protein can now be produced in Chinese hamster ovary (CHO) cells in gram quantities [2]. This humanized anti-cocaine mAb is currently in an advanced stage of pre-clinical development as a potential therapeutic for the prevention of relapse in cocaine abusers. The next major development milestone is the selection of the best producing cell line to establish a Master Cell Bank. However, this mAb, like most IgG1 isotypes is glycosylated [2], and has a number of post-translational modifications, including glycosylation, which can lead to structural, and possibly functional, heterogeneity. Antibody glycosylation is an especially important post-translational modification that may increase antibody solubility and stability, as well as serving to possibly decrease their tendency to aggregate, which are all important properties for any therapeutic protein. Glycosylation can be variable even within production batches and in cell lines with high levels of mAb expression. Slight variations in cell culture medium components and methods can result in changes in expression yields, as well as differential glycoform distributions for mammalian cell expressed antibodies, which could have functional and therapeutic consequences. Thus, methods to quickly, easily, inexpensively, and accurately elucidate the variation and extent of glycosylation and other post-translational modifications located anywhere on the antibody molecule are critical. In this study, we describe such a method to prepare reduced and alkylated fragments of our recombinant anti-cocaine mAb from three cell lines that have high expression levels of the mAb. All post-translational modifications resulting in a mass change located anywhere on the antibody molecule can be assessed using the preparation method described in this work, followed by a relatively simple and inexpensive form of mass spectral analysis. The results obtained can be easily visually inspected and compared in a single reconstructed mass spectrum covering a mass range of only a few thousand daltons. This novel and efficient combination of well-established methods should also be applicable to a broad range of recombinant mAb proteins and should be useful as a routine screening tool to quickly evaluate different cell lines producing the same cloned mAb or different production batches using the same cell line. Because the major glycoforms can be rapidly and quantitatively evaluated, the effects of the use of different media and other expression components on these important post-translational modifications can be quickly evaluated, facilitating the optimization of therapeutic mAb production.
Materials and Methods
Materials
Frag-It kits containing immobilized IdeS protease (Immunoglobulin G-degrading enzyme of Streptococcus pyogene) columns designed for cleavage of up to 0.5 mg mAb were purchased from Genovis (cat. # A2-FR2-025). Tributylphosphine (TBP) (a 200 mM solution in N-methyl-2-pyrrolidinone (cat. # T-7567)) and iodoacetamide (IAM, cat. # I-6125) were from Sigma. Tris(2-carboxyethyl)phosphine hydrochloride (TCEP, cat # 20490) was obtained from Thermo Scientific Pierce. The Vivaspin 500 μL concentrators (cat. # 28-9322-25) were from GE Healthcare. Guanidine hydrochloride (Gu-HCl, cat. # A1449) was from AppliChem. To separate TBP and IAM from the fragmented antibody after reduction and alkylation, Sephadex G-25-80 size exclusion beads were from Sigma, and disposable columns were from BioRad (Econo-Pac 14 cm–high 1.5 × 12 cm polypropylene columns, cat. # 7321010EDU). Tris base, NaCl, and concentrated formic acid, sequencing grade, were from Fisher Scientific.
Methods
Typically, 0.5 mg of the purified h2Es anti-cocaine mAb Fab was processed for analysis, since this is the maximum amount suggested for IdeS proteolysis using the immobilized enzyme on the small Frag-It spin column. Thus, after washing the column and diluting the sample with tris-buffered saline, pH=7.3 (TBS), a Frag-It spin column was used to cleave 0.25 ml of intact (0.5 mg) mAb into F(ab′)2 plus Fc fragments by incubation with end-over-end rotation of the capped column for 30 minutes at 22°C. The hydrolyzed mAb sample was recovered by a 1 minute, approximately 300g spin, followed by a wash with 0.25 ml TBS, and subsequent spin. After pooling both samples, the 0.5 ml F(ab′)2 plus Fc fragments were concentrated to less than 0.15 ml using a Vivaspin 500 10kDa MWCO filter.
Reduction and alkylation of the F(ab′)2 plus Fc fragments (without separation) was done in a total volume of 0.5 ml, by diluting the concentrated, digested mAb sample in 4M Gu-HCl, 100 mM Tris-Cl, pH=8.0, containing 10 mM TBP. Reduction was carried out for 30 min at 50°C, followed by cooling to 22°C, and addition of IAM to a final concentration of 20 mM. Alkylation was carried out for 30 min at 22°C in the dark. Immediately following the alkylation, all excess reagents were removed and the buffer was exchanged at 22°C for 0.1% formic acid by application of the sample to a 4–5 ml G-25 column, poured in water, and then equilibrated with 0.1% formic acid just before use. The absorbance of each 0.5 ml fraction (280nm) was determined and the fractions containing non-separated F(ab′)2 plus Fc fragments were pooled and concentrated as above. After concentrating to a volume of approximately 30–50 uL, a 5 uL aliquot was diluted 20 fold for determination of yield and protein concentration (typically 3–5 mg/ml, calculated using the E1% for this mAb of 1.0mg/ml = 1.463 absorbance at 280nm). The remainder of the sample was kept at 4°C. SDS-PAGE analysis of about 0.5 – 1.0 μL of each preparation was performed, with or without additional reduction with DTT, to check for the expected three fragments of approximately 23–26 kDa.
The resultant samples were analyzed by electrospray ionization time-of-flight mass spectrometry (ESI-Tof MS). Samples were typically diluted to between 150–400 ng/uL by transferring 1 uL of the concentrated sample in 0.1% formic acid into 19 uL of 50% methanol/0.1% formic acid. The mass spectral (MS) system was set up for loop injection with a constant flow of 500 nL/min in 50% methanol/0.1% formic acid using a 2 uL loop, thus producing about a 4 minute mass spectral profile for each sample. ESI was achieved through a Sciex NANOspray III source fitted with a New Objectives PicoTip emitter (20 um i.d. pulled to a 10 μm tip). Each loop-injected sample was analyzed on a Sciex 5600 + system at 500nL/min in positive ion Tof-MS mode with the following settings: ion spray voltage at 2600V, GS1 at 35, curtain gas at 35, interface heater at 125°C, declustering potential at 100, with a TOF range of 600–2200 m/z and a 1 sec accumulation time. The spectral data were further processed using the protein reconstruct algorithm in the PeakView ver 2.1 software from Sciex to generate the reconstructed mass profiles. For the calculation of the relative glycoform peak area percentages for each sample, the areas of each identified glycoform were integrated from the reconstructed mass profiles, summed and then presented as area percentages. For comparative visualization of the glycoform differences, the reconstructed mass profiles were all normalized to the most abundant (base peak) glycoform (G0F).
Results
IdeS protease (Immunoglobulin G-degrading enzyme of Streptococcus pyogene) cleaves with high specificity between two glycine residues in the hinge region of antibodies (in this case, between the underlined residues in the heavy chain in the sequence APELLGGPSVFL), resulting in the generation of a F(ab′)2 plus an Fc fragment. These fragments are too large for simple mass spectral analysis to yield the single Da resolution needed to identify many post-translation modifications. However, after reduction, three fragments are generated which fall in the range of 23–26 kDa (two Fc/2 fragments containing the single glycosylation site, two intact light chains (LC), and two Fd heavy chain fragments. These fragments fall into a convenient and suitable mass range for analysis using relatively simple and inexpensive mass spectrometry instruments.
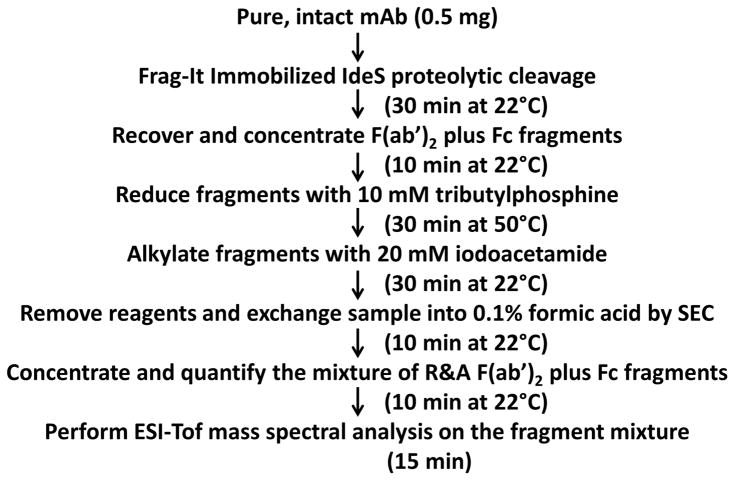
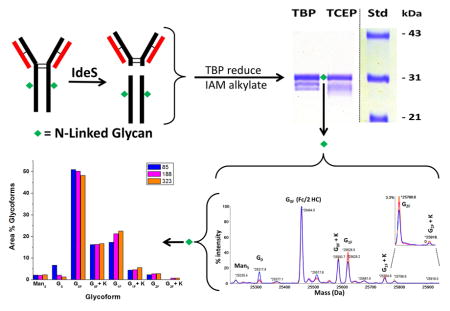
Using the sample preparation method described in this work, and starting with purified monoclonal antibody, a single sample that defines the entire mAb structure, which is suitable for direct injection into a mass spectrometer can be generated in about 2 hours, with a final “purified” yield of about 40%. The sample is then simply diluted and analyzed by electrospray ionization time-of-flight mass spectrometry (ESI-Tof MS) without utilizing any liquid chromatography to separate fragments or any orthogonal techniques. A flow chart showing the steps and approximate times required is shown in Figure 1.
Figure 1.
Flow chart of the mass spectral mAb sample preparation method.
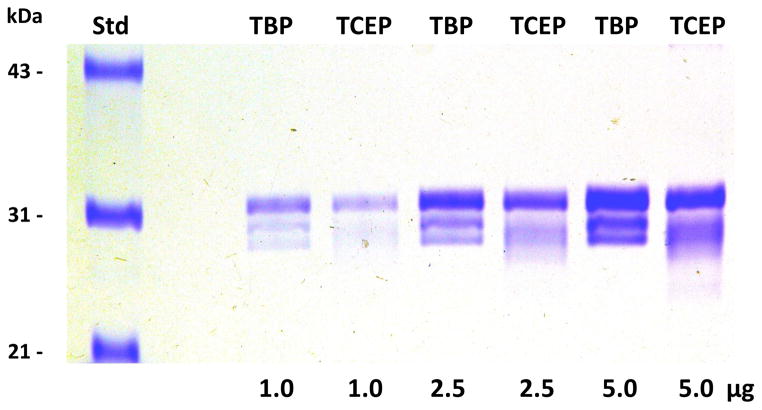
Substitution of the same concentration of water soluble TCEP phosphine reductant for the relatively insoluble TBP phosphine reductant in the protocol defined in Figure 1 did not yield identical or suitable results. TCEP reduction of the mAb light chain under these conditions was incomplete, resulting in incompletely resolved and smeared lower molecular weight protein bands on SDS-PAGE analysis, instead of the 3 discrete bands expected and observed using TBP as the reductant (see Figure 2). Incomplete reduction (and subsequent incomplete IAM alkylation) of the light chains by TCEP was confirmed by mass spectral analysis of the resulting samples (data not shown). This incomplete reduction by TCEP is consistent with the incomplete TCEP reduction of the intra-chain light chain disulfides observed when heating this mAb in SDS, when substituting TCEP for TBP in the method described previously for simultaneous complete reduction and alkylation of proteins using TBP and a fluorescent alkylating reagent, 7-fluorobenz-2-oxa-1,3-diazole-4-sulfonamide (ABD-F, see reference [3]) prior to SDS-PAGE. Hence, the use of TBP instead of the more common, and more soluble phosphine, TCEP, is an important part of the procedure, which is compatible with simultaneous IAM alkylation, but, unlike TCEP, results in complete reduction of the light chain disulfides.
Figure 2. Comparison of cell line 85 h2E2 mAb samples prepared following the protocol outlined in Figure 1 using TBP or TCEP as the reductant.
Cell line 85 mAb samples were prepared for mass spectral analyses, either using the protocol delineated in Figure 1, or using a modification of the Figure 1 protocol with TCEP replacing TBP as the reductant. Multiple aliquots of the resulting samples were analyzed by 10% SDS-PAGE, without DTT reduction prior to electrophoresis. The gel was subsequently stained with Coomassie blue.
The reduced and alkylated antibody fragments were analyzed by ESI-Tof MS, without separation of the three component fragments – the intact light chain (LC), the F(ab′) portion of the heavy chain (FD), and the Fc/2 part of the heavy chain which contains the single, conserved N-linked glycosylation site on the mAb. Based on the amino acid sequence and the following expected post-translation modifications and quantitative alkylation of all cysteines, the theoretical masses of the three fragments were calculated as follows:
Intact light chain (LC): 23016.8 Da = 22748.6 (215 amino acids) + 285.2 (5 cysteine X 57.05 Da/carboxyamidomethyl (IAM) alkylation of cys) − 17.0 (Gln to pyroGlu modification on the N-terminus)
F(ab′) heavy chain fragment (Fd): 24961.0 Da = 24561.6 (232 amino acids) +399.4 (7 cys X 57.05 Da/carboxyamidomethyl (IAM) alkylation of cys)
Main (G0F) Fc/2 heavy chain fragment: 25,463.6 Da = 23,919.1 (211 amino acids) + 228.2 (4 cys X 57.05Da/carboxyamidomethyl (IAM) alkylation of cys) + 1444.53 (G0F glycan) − 128.2 (loss of HC C-term Lys)
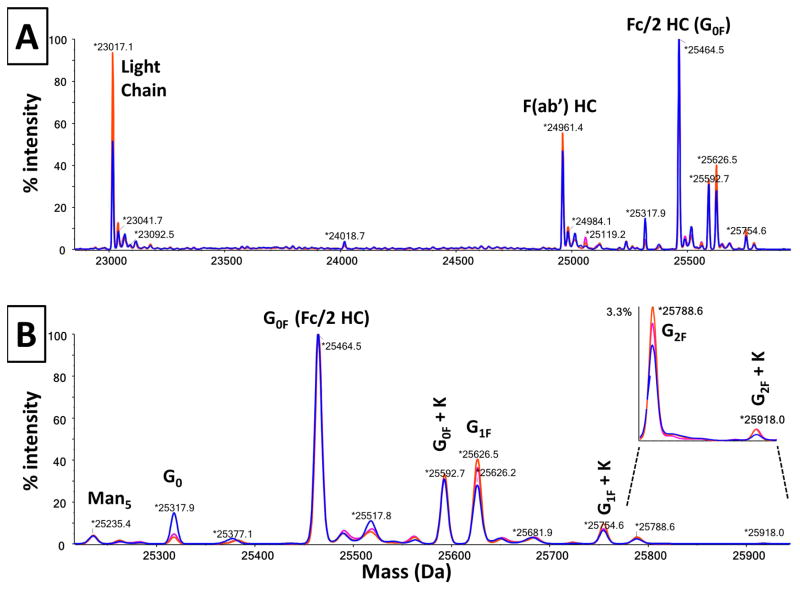
As can been seen in Figure 3A, the experimental masses for these three fragments agree well with the theoretical masses calculated above, i.e., 23017.1 vs 23016.8, 24961.4 vs 24961.0, and 25464.5 vs 25,463.6, respectively.
Figure 3. Overlay of 3 mass spectra obtained from 3 cell lines of the h2E2 anti-cocaine mAb.
Panel A shows the overlay of the 3 reconstructed mass profiles over the mass range covering all of the fragments. Panel B shows an overlay of the expanded portion of the mass spectra defining the glycoforms for the 3 cell lines of the h2E2 anti-cocaine mAb. Cell line 85-blue profile; Cell line 188-magenta profile; Cell line 323-orange profile.
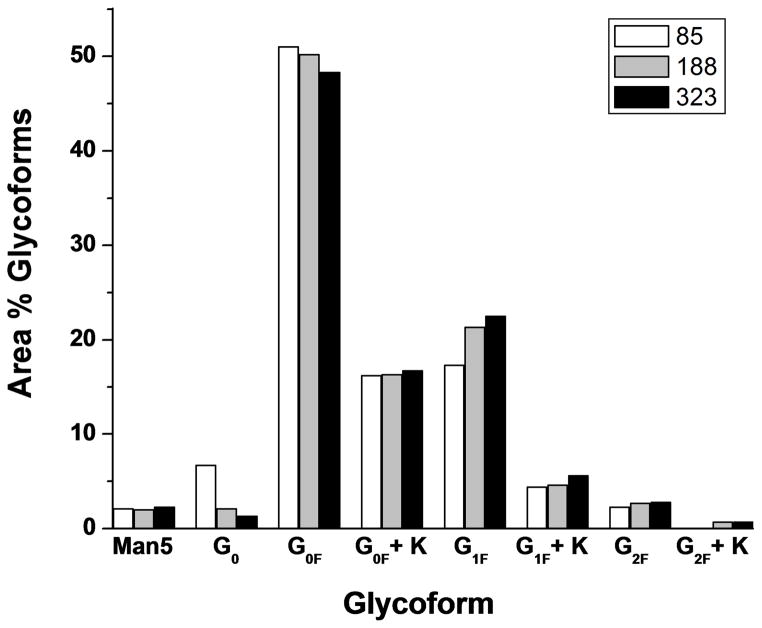
All three h2E2 mAb cell lines were analyzed in this fashion, and the mass spectral data for the 3 cell lines are shown in Figure 3A and 3B, overlaid and normalized to the peak height of the main G0F glycoform fragment (at 25464.5 Da in these spectra). The reason these data were overlaid is to show the reproducibility of the mass of the fragments, as well as to compare the glycosylation patterns on the 3 cell lines. For the latter purpose, the mass region containing all the glycoform fragments was expanded (keeping the peak heights normalized to the main G0F peak), as shown in Figure 3B. The identities of the different fragments and glycoforms are labeled and shown in Figure 3. The experimentally determined masses were compared to the theoretical masses for each identified glycoform in Figure 3B (see Table 1). As is evident the agreements between the experimental masses and the theoretical masses for all glycoform peaks (except the very small G2F + K peak) were within 1.0 Da. As can also be seen in Figure 3B, the main differences among the 3 cell lines are observed in cell line 85, which has substantially more G0, and substantially less G1F than cell lines 188 and 323. Similar results were also obtained when comparing these same Fc/2 fragments which had been chromatographically purified from the other antibody fragments after cleavage and before mass spectral analysis (data not shown). The data shown in Figure 3B were quantitated by integration of the major labeled glycoform peaks, and the results are shown in Figure 4 as relative area percentages. Again, the results indicate that cell line 85 glycosylation differs from the other 2 cell lines of the mAb, with the main differences being the presence of substantially more G0, and less G1F. To demonstrate the degree of reproducibility of the glycoform distribution determined using these methods, 3 independent samples of cell line 85 mAb were prepared and analyzed on different days. These results are tabulated in Table 2 and demonstrate the analytical reproducibility of the method, with small standard deviations, and low coefficients of variance (CVs), ranging from 0.8% to 14.4%.
Table 1.
Theoretical vs experimental masses for the h2E2 mAb glycoforms detected and quantified (see Figure 3B for experimental masses)
| Fc/2 fragment glycoform peak | Theoretical mass (Da) | Experimental mass (Da) |
|---|---|---|
| Man5 | 25235.4 | 25235.4 |
| G0 | 25316.9 | 25317.9 |
| G0F | 25463.6 | 25464.5 |
| G0F + K | 25591.8 | 25592.7 |
| G1F | 25625.7 | 25626.5 |
| G1F + K | 25753.9 | 25754.6 |
| G2F | 25787.8 | 25788.6 |
| G2F + K | 25916.0 | 25918.0 |
The theoretical masses were calculated starting with the calculated theoretical mass for the main peak, G0F = 25463.6 (calculated in the text of the Results section), and then using; fucose added/subtracted mass = 146.1, hexose added mass = 162.1, and lysine added mass = 128.2
Figure 4. Comparison of the glycoform distributions of the 3 cell lines of the h2E2 anti-cocaine mAb.
The glycoform peak areas for each of the 3 cell lines from Figure 3 were captured and plotted as area percentages of the total identified glycoforms, as described in the Methods section. White bars – cell line 85; grey bars – cell line 188; black bars – cell line 323.
Table 2.
Fc/2 fragment glycoform peak areas – reproducibility and statistics (n=3).
| Fc/2 fragment glycoform peak | Mass | Cell line 85 (Sample 1) | Cell line 85 (Sample 2) | Cell line 85 (Sample 3) | Mean area % | Standard Deviation | %CV |
|---|---|---|---|---|---|---|---|
| Man5 | 25,235 | 2.1% | 2.4% | 1.8% | 2.1% | 0.3% | 14.4% |
| G0 | 25,318 | 6.8% | 7.3% | 6.5% | 6.8% | 0.4% | 6.3% |
| G0F | 25,464 | 50.0% | 52.2% | 53.6% | 51.9% | 1.9% | 3.6% |
| G0F + K | 25,593 | 15.6% | 13.7% | 14.5% | 14.6% | 1.0% | 6.7% |
| G1F | 25,626 | 17.9% | 17.7% | 17.6% | 17.7% | 0.1% | 0.8% |
| G1F + K | 25,755 | 4.6% | 3.8% | 3.5% | 4.0% | 0.5% | 13.5% |
| G2F | 25,789 | 2.5% | 2.3% | 1.9% | 2.2% | 0.3% | 13.5% |
| G2F + K | 25,918 | 0.6% | 0.6% | 0.5% | 0.6% | 0.1% | 9.5% |
Data for cell line 85 are expressed as % of the total integrated area for all identified glycoform mass peaks in each sample.
Discussion
The burgeoning use and development of therapeutic monoclonal antibodies has increased the need for fast and simple methods to analyze their post-translational modifications and, especially, their glycosylation heterogeneity. This can be accomplished by specific cleavage of the antibody to yield a limited number of smaller protein fragments. IdeS protease (Immunoglobulin G-degrading enzyme of Streptococcus pyogene) has recently been commercialized and utilized to structurally characterize antibodies [4], since it has superior selectivity for cleavage in a region nearby the main pepsin cleavage site, resulting in the generation of a F(ab′)2 plus an Fc fragment, similar to those generated by pepsin, but with greater specificity and little, if any, non-selective cleavage.
Several somewhat similar methods for analysis of monoclonal antibodies utilizing IdeS protease and mass spectral analyses have been published recently (An et al [4], Tran et al [5] Reusch et al [6] Janin-Bussat et al [7] Chevreux et al [8]). However, unlike these previously published procedures, we alkylated the reduced monoclonal antibody (with iodoacetamide) prior to mass spectral analyses, in order to eliminate the possibility of any further cysteine modifications or oxidation leading to disulfide formation prior to analysis. Rather than using the more commonly utilized DTT reductant employed in many similar studies, we choose to use the phosphine reductant, tributylphosphine (TBP), since this allows simultaneous reduction and alkylation without quenching the reduction reaction or eliminating the reductant prior to alkylation, making the method simpler and faster [3,9]. As shown in Figure 2, preliminary experiments utilizing the more commonly employed, and more water soluble phosphine, tris(2-carboxyethyl)phosphine (TCEP), demonstrated that this reductant was less efficient in completely reducing all mAb disulfides, even though the reaction was carried out under the same conditions of elevated temperature (50°C) in a denaturant (4 M Gu-HCl). This may be due to greater accessibility of some of the light chain disulfide bonds located in very hydrophobic environments, which are accessible to the hydrophobic TBP, but not to the hydrophilic TCEP reductant. Based upon all results obtained in the course of the present study, it is clear that the reduction and alkylation protocol used (as outlined in Figure 1) resulted in quantitative reduction and alkylation of all 16 disulfides present in the mAb, with no detectable over-alkylation with iodoacetamide on lysine amino groups or other nucleophilic side chains.
Regarding the post translational modifications of the h2E2 mAb studied in this work, which is an anti-cocaine antibody whose general properties and ligand binding were described previously [2], but which has not been characterized for post-translational modifications or studied by mass spectral analysis to date, our current findings are consistent with the light chain having a Gln to pyroGlu modification on the N-terminus, and with the heavy chain being about 50% populated with a G0F glycan and lacking the heavy chain C-terminal lysine residue. The finding that one cell line (cell line 85) carries substantially more G0, and substantially less G1F, indicates that it is important to evaluate the in vivo pharmacokinetics, as well as possible differences in the solubility, stability, and tendency to aggregate of this cell line relative to the other two cell lines, before deciding which cell line should be used for generating a master cell bank and advancing into human clinical trials.
In summary, we describe a simple, rapid, quantitative, and inexpensive method that allows the assessment of post-translational modifications on the whole antibody from a single sample analyzed using a simple form of mass spectrometry. The results can be visually evaluated from a single mass spectrum, and multiple batches or cell lines of the same mAb can easily be visually compared by means of the overlaid mass spectra. Although not able to assess all of the very minor glycoforms, and not matching the gold-standard performance of glycoform analysis by fluorescence labeling after cleavage of the glycan chains from the protein, the current method does allow quantitative assessment and comparison of all the major glycoforms without the use of any liquid chromatography or orthogonal techniques prior to loop injection ESI-Tof mass spectrometry. The method described in our present study is simpler and faster than previously methods, and differs from most of these regarding the lack of separation of the generated IdeS fragments, the simplified method of introduction of sample into the mass spectrometer, the use of the phosphine reductant, TBP, as well as alkylation of the reduced antibody fragments prior to mass spectral analysis. Importantly, with coefficients of variance (CVs) of less than 15% (even for the worst case, lowest abundance glycoforms measured), the demonstrated reproducibility and precision is sufficient to use this simple method to measure clonal variations and glycosylation differences due to growth conditions or process changes, and/or lot-to-lot variations of mAb production without the need for lengthy sample preparation and analysis protocols.
Supplementary Material
Highlights.
IdeS cleavage, reduction and alkylation allows simple and rapid mAb characterization
A single mix of alkylated fragments generates global mAb structural information
The large majority of the glycoforms present on the antibody are determined
The methods used are simple, rapid, reproducible, and quantitative
These methods are ideal for development and batch analyses of therapeutic mAbs
Acknowledgments
This work was supported in part by the National Institutes of Health National Institute on Drug Abuse Grants DP1DA031386 and U01DA039550. The 5600 + TripleTof system used for the mass spectrometry analysis was funded in part through an NIH shared instrumentation grant (S10 RR027015-01). We are grateful to Catalent PharmaSolutions, Inc. (Madison, WI) for providing the recombinant humanized anti-cocaine mAb protein expressed using their GPex® technology.
Abbreviations
- mAb
monoclonal antibody
- h2E2
humanized monoclonal antibody against cocaine
- IdeS protease
Immunoglobulin G-degrading enzyme of Streptococcus pyogene
- TBP
tributylphosphine
- IAM
iodoacetamide
- TCEP
Tris(2-carboxyethyl)phosphine hydrochloride
- DTT
dithiothreitol
- Gu-HCl
Guanidine hydrochloride
- TBS
tris-buffered saline
- HPLC
high performance liquid chromatography
- ESI-Tof MS
electrospray ionization time-of-flight mass spectrometry
- CHO
Chinese hamster ovary cell
Footnotes
CONFLICT-OF-INTEREST AND FINANCIAL DISCLOSURE STATEMENT: Dr. Norman is named as a co-inventor on a patent application for the use of the h2E2 humanized anti-cocaine monoclonal antibody.
Publisher's Disclaimer: This is a PDF file of an unedited manuscript that has been accepted for publication. As a service to our customers we are providing this early version of the manuscript. The manuscript will undergo copyediting, typesetting, and review of the resulting proof before it is published in its final citable form. Please note that during the production process errors may be discovered which could affect the content, and all legal disclaimers that apply to the journal pertain.
References
- 1.Paula S, Tabet MR, Farr CD, Norman AB, Ball WJ., Jr Three-dimensional quantitative structure-activity relationship modeling of cocaine binding by a novel human monoclonal antibody. J Med Chem. 2004;47:133–142. doi: 10.1021/jm030351z. [DOI] [PubMed] [Google Scholar]
- 2.Kirley TL, Norman AB. Characterization of a recombinant humanized anti-cocaine monoclonal antibody and its Fab fragment. Hum Vaccin Immunother. 2015;11:458–467. doi: 10.4161/21645515.2014.990856. [DOI] [PMC free article] [PubMed] [Google Scholar]
- 3.Kirley TL. Reduction and fluorescent labeling of cyst(e)ine-containing proteins for subsequent structural analyses. Analytical Biochemistry. 1989;180:231–236. doi: 10.1016/0003-2697(89)90422-3. [DOI] [PubMed] [Google Scholar]
- 4.An Y, Zhang Y, Mueller HM, Shameem M, Chen X. A new tool for monoclonal antibody analysis: application of IdeS proteolysis in IgG domain-specific characterization. MAbs. 2014;6:879–893. doi: 10.4161/mabs.28762. [DOI] [PMC free article] [PubMed] [Google Scholar]
- 5.Tran BQ, Barton C, Feng J, Sandjong A, Yoon SH, Awasthi S, Liang T, Khan MM, Kilgour DP, Goodlett DR, Goo YA. Comprehensive glycosylation profiling of IgG and IgG-fusion proteins by top-down MS with multiple fragmentation techniques. J Proteomics. 2015;134:93–101. doi: 10.1016/j.jprot.2015.10.021. [DOI] [PubMed] [Google Scholar]
- 6.Reusch D, Haberger M, Falck D, Peter B, Maier B, Gassner J, Hook M, Wagner K, Bonnington L, Bulau P, Wuhrer M. Comparison of methods for the analysis of therapeutic immunoglobulin G Fc-glycosylation profiles-Part 2: Mass spectrometric methods. MAbs. 2015;7:732–742. doi: 10.1080/19420862.2015.1045173. [DOI] [PMC free article] [PubMed] [Google Scholar]
- 7.Janin-Bussat MC, Tonini L, Huillet C, Colas O, Klinguer-Hamour C, Corvaia N, Beck A. Cetuximab Fab and Fc N-glycan fast characterization using IdeS digestion and liquid chromatography coupled to electrospray ionization mass spectrometry. Methods Mol Biol. 2013;988:93–113. doi: 10.1007/978-1-62703-327-5_7. [DOI] [PubMed] [Google Scholar]
- 8.Chevreux G, Tilly N, Bihoreau N. Fast analysis of recombinant monoclonal antibodies using IdeS proteolytic digestion and electrospray mass spectrometry. Anal Biochem. 2011;415:212–214. doi: 10.1016/j.ab.2011.04.030. [DOI] [PubMed] [Google Scholar]
- 9.Kirley TL. Determination of three disulfide bonds and one free sulfhydryl in the b subunit of (Na,K)-ATPase. J Biol Chem. 1989;264:7185–7192. [PubMed] [Google Scholar]
Associated Data
This section collects any data citations, data availability statements, or supplementary materials included in this article.


