

Abstract
Deaths from opioid pain reliever overdose in the United States quadrupled between 1999 and 2013, concurrent with an increase in the use of the drugs. We used data from the Medical Expenditure Panel Survey to examine trends in opioid pain reliever expenditures, financing by various payers, and use from 1999 to 2012. We found major shifts in expenditures by payer type for these drugs, with private and public insurers paying a much larger share than patients in recent years. Consumer out-of-pocket spending on opioids per 100 morphine milligram equivalents (a standard reference measure of strength for various opioids) declined from $4.40 to $0.90 between 2001 and 2012. Since the implementation of Medicare Part D in 2006, Medicare has been the largest payer for opioid pain relievers, covering about 20–30 percent of the cost. Medicare spends considerably more on these drugs for enrollees younger than age sixty-five than it does for any other age group or than Medicaid or private insurance does for any age group. Further research is needed to evaluate whether payer strategies to address the overuse of opioids could reduce avoidable opioid-related mortality.
Deaths from drug overdose have dramatically increased in recent years, and drug overdose is now the leading cause of injury death in the United States.1 To put this in perspective, the mortality rate from drug overdose is now higher than that from motor vehicle traffic crashes, which had long been the number-one cause of injury death.2 The majority of drug overdose deaths are associated with the use of prescription drugs, particularly opioid pain relievers such as oxycodone and methadone. Annual deaths from opioid overdose quadrupled in the United States between 1999 and 2013, from 4,030 to 16,235.3 The majority of these deaths occur among adults ages 25–64, but overdose mortality has grown faster among people ages 55–64 than among any other age group.4
The rise in mortality from opioid pain reliever overdose coincided with a change in the medical treatment of pain. In the 1990s pain specialists argued that selected patients with chronic noncancer pain could be successfully treated with opioid pain relievers.5 In 1998 the Federation of State Medical Boards published model guidelines that suggested flexibility in pain management, including broader use of opioids.6 The Joint Commission required providers to assess pain during most patient encounters.7 The Veterans Health Administration incorporated routine assessment of pain as the “fifth vital sign” in 2000.8 All of these changes in pain management coincided with a dramatic increase in the medical use of opioid pain relievers, starting in the 1990s.1,9 In the same time period some pharmaceutical companies conducted extensive campaigns to promote the use of the drugs.10
Also beginning in the 1990s, employees’ health plans increasingly included prescription drug coverage. Insurers have assumed an increasing share of prescription drug expenditures.11 On average, consumers’ out-of-pocket spending as a share of total prescription drug spending declined from 26 percent in 2001 to 17 percent in 2011, while Medicare’s share of total prescription drug spending increased from 2 percent to 24 percent and Medicaid’s share declined from 17 percent to 8 percent.12 There is limited research on the impact of insurance coverage on the use of opioid pain relievers, but past research on overall medical spending found that reducing the out-of-pocket share of payment for medical services led to an increase in overall utilization and expenditure.13
Several studies14–18 have examined opioid prescribing, dependence, and overdose for the population covered by specific third-party payers. Inappropriate prescribing of opioids has been demonstrated to be prevalent in both publicly and privately insured populations.
Among publicly covered populations, there was substantial growth in the number of opioid prescriptions covered by Medicare Part D from 2007 to 2012, and prolonged use (for ninety days or more) of opioids has been associated with increased odds of emergency department visits and hospitalizations related to opioid overdose in the Medicare Part D population.14 A study of Medicaid beneficiaries showed that 40 percent of patients with an opioid prescription had at least one marker of potentially inappropriate prescribing (for example, overlapping opioid and benzodiazepine prescriptions or high daily dosages).15 Also, the Medicaid population has a higher rate of deaths related to opioid pain relievers than the general population does.16 A study in Washington State found that even though the Medicaid-enrolled population represented just 20.2 percent of the total state population, 45 percent of deaths in Washington from opioid pain reliever overdoses were among Medicaid enrollees.17 Among privately insured people who received an opioid prescription, 25 percent had at least one marker of inappropriate prescribing.18
Previous research on opioid use has documented patterns of use and potentially inappropriate prescribing, but few studies have examined differences in use and spending patterns across different types of third-party payers. One exception was a study that used HealthCore data to compare the privately insured to Medicaid beneficiaries in Arkansas.19 The study found that Medicaid enrollees had higher rates of opioid prescriptions and took higher opioid dosages. While this study yielded important information about the differences in opioid prescribing across payer populations, how representative its Medicaid sample was of the Medicaid population beyond Arkansas or nationally is unknown.
There have been substantial changes in insurer payments for pharmaceuticals during the past decade. For example, prescription coverage became available for Medicare recipients through Medicare Part D in 2006. But there is limited information on the use of opioids in the Medicare population since that time. Studies of Medicare recipients have mostly examined the receipt of opioids from multiple sources and issues of fraud.20 However, a recent analysis found that opioid prescribing for enrollees in Medicare Part D is widely distributed across providers, which suggests that a focus on outlier prescribing might miss important trends in opioid utilization.21
To our knowledge, no systematic research on expenditure patterns for opioid pain relievers across different payers has been conducted. Nor has any research analyzed different demographic groups within each payer. Specifically, we paid attention to the Medicare population. Medicare recipients include both groups of people with relatively low rates of overdose mortality related to opioid pain relievers (people ages sixty-five and older) and those with relatively high rates of overdose mortality (nonelderly adults), compared to the national average.
Understanding the source of payment for opioid pain relievers may help identify potential ways to prevent overdose, because payers have a financial incentive to reduce inappropriate prescribing. We used data for the period 1999–2012 from the Medical Expenditure Panel Survey (MEPS) to document trends in opioid prescribing and expenditures by payer type and to investigate the interaction of insurance coverage and opioid pain reliever use and spending.
We examined the following four questions: How much was spent on opioid pain relievers in the United States? What proportions of the spending were out of pocket and by public and private payers? Was increased insurance coverage associated with a decrease in the cost per dose of opioid pain relievers? Finally, if there was a significant change over time in the pattern of third-party payment—for example, if Medicare started to play a large financing role—did the change have different effects on patients in groups with higher rates of overdose (such as people ages 25–64) and the general population?
Study Data And Methods
DATA
We used MEPS data to examine payer trends in use of opioid pain relievers. Because the International Classification of Diseases, Tenth Revision (ICD-10), codes used for opioid drug poisoning deaths since 1999 are not comparable to those in the ICD, Ninth Revision (ICD-9), codes used previously, and because 2012 was the most recent year of MEPS data available, we limited our analysis to 1999–2012. MEPS is a nationally representative survey of the US civilian noninstitutionalized population on health service use and expenditures. MEPS was the most complete source of survey data on the cost and use of health care and health insurance coverage for our study.22
We used the MEPS prescribed medicines file to identify opioid prescriptions during each survey year. We matched that file with the consolidated data file to obtain characteristics of individual patients. The prescribed medicines file contains information on all prescriptions filled during the year for all participants in MEPS. Information on any prescription drugs purchased or obtained via free samples and the date on which the person first used the medicine were obtained from individuals interviewed in the MEPS Household Component. For each medication reported, the pharmacy was contacted to report the date filled, National Drug Code, medication name, strength of medication, quantity, and payment by source. We used the National Drug Code classification system to identify prescriptions for opioid pain relievers for MEPS participants. Opioids were identified from the compilation of formulations of opioid pain relievers from the Centers for Disease Control and Prevention (CDC).
Individuals with at least one opioid prescription were included in our analysis. In 1999 about 7 percent of the MEPS participants were prescribed any opioids. By 2012 that share had increased to 10 percent. In 2012 there were 3,534 MEPS participants with at least one opioid prescription, representing approximately thirty-six million people with any opioid consumption nationally when weighted. Of this population, 20 percent were ages 65 and older, and 40 percent were ages 45–64. Fifty-eight percent were female, and 80 percent were white.
METHODS
We defined expenditure as the sum of payments for opioid prescriptions. Expenditure during the study period was adjusted by the MEPS pharmaceutical price index, which used 2009 as the base year. Sources of payment were the following: self-pay, private insurance, other private insurance (that is, worker’s compensation or other unclassified insurance, such as automobile, homeowner’s, and liability insurance; and insurance from other miscellaneous or unknown sources), Medicare, Medicaid, and other public insurance (that is, from the Veterans Health Administration, Tricare, other federal sources, other state and local sources, and other public sources).
Finally, to compare the strength of a given amount of opioid pain relievers across specific brands and formulations of drugs, we converted the dosage of the amount of the drug purchased to its morphine milligram equivalent (MME). Total MME for each prescription was calculated as follows: We multiplied the quantity of each prescription by the strength of the prescription (milligrams of opioid per unit dispensed) and then multiplied the result by conversion factors derived from published sources to estimate the MME of the opioids dispensed in the prescription. These conversion factors are provided in the CDC’s compilation of formulations of opioid pain reliever with MME conversion factors.23
We also examined the amount of drugs by payer type. In cases where there were multiple payers (such as when a private insurance beneficiary has a copayment), we allocated MMEs by the percentage of the total expense that was paid by each payer. To examine the expenditure for opioids by payer and patient characteristics, we calculated expenditures per opioid patient, by payer and age category.
LIMITATIONS
This study was subject to several limitations. First, we were not able to explore any potential drug diversions from patients to others who might misuse the medication. Second, as a national survey, MEPS is designed to produce overall national expenditure estimates, but it does not provide detailed estimates for less prevalent conditions such as prescription drug overdose. Third, we did not have enough observations to investigate characteristics of individual prescriptions that might be associated with risk (for example, high dose) or to evaluate state programs such as prescription drug monitoring programs.
Study Results
SPENDING AND THIRD-PARTY PAYMENTS
We found that spending for opioid pain relievers increased dramatically from 1999 to 2012 (Exhibit 1). Americans spent $2.3 billion on the drugs in 1999. By 2006, spending had more than tripled, to over $7.0 billion. Since 2006, expenditures have been relatively stable compared to this earlier increase, with expenditures of $7.4 billion in 2012 (the most recent year of data available).
Exhibit 1. Total US expenditures for opioid pain relievers, by insurance type and year.
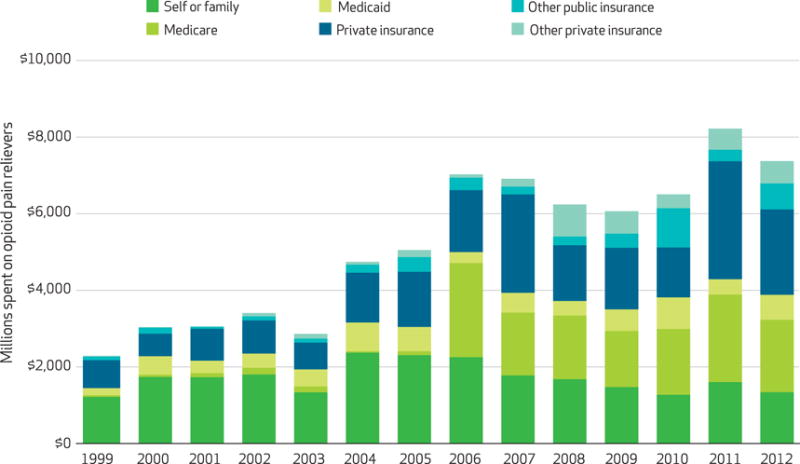
SOURCE Authors’ analysis. NOTES Expenditures were adjusted by the Medical Expenditure Panel Survey’s pharmaceutical price index, which used 2009 as the base year. The categories of insurance are explained in the text. The overall upward trend in total spending during the study period in Medicare, Medicaid, and private insurance (but not self-pay) was significant (p < 0.001). The larger changes between years, such as between 2010 and 2011 for private insurance (p < 0.01) and between 2006 and 2007 for Medicare (p < 0.05), were also significant, but some of the smaller changes were not. We used Change-Point Analyzer Software to identify changes in trends for spending. For Medicare, private insurance, and total spending, there was such a change in 2006 (99% confidence level). For self or family, there was such a change in 2004 (96% CI).
There have been major shifts in third-party payment for opioid pain relievers. In 1999, 53 percent of spending on the drugs was out of pocket ($1.2 billion of $2.3 billion) (Exhibit 1). By 2012, out-of-pocket spending had increased to $1.3 billion, but that represented just 18 percent of the $7.4 billion spent on opioid pain relievers in that year.
The most dramatic change occurred in Medicare and Medicaid. In 1999, Medicare and Medicaid paid for 9 percent of opioid drug spending (1 percent and 8 percent, respectively). In 2006 the Medicare prescription drug benefit (Medicare Part D) was implemented. Since 2006, Medicare has accounted for 20–30 percent of all spending for opioid pain relievers. In 2012, Medicare and Medicaid accounted for 35 percent of the spending (26 percent and 9 percent, respectively).
In 2006, fewer than eight million of the forty-six million Medicare beneficiaries were younger than sixty-five.24 Most Medicare enrollees in this age group have a long-term disability or end-stage renal disease. In 2006, Medicare spent more for opioid pain relievers on people younger than age sixty-five ($1.8 billion) than it did on people ages sixty-five and older ($637 million). In the same year, Medicare also spent more for the drugs on people younger than age sixty-five than Medicaid did ($280 million). Medicare continued to outspend Medicaid for the younger age group after 2006 (Exhibit 2).
Exhibit 2. US expenditures for opioid pain relievers for enrollees in Medicare or Medicaid, by age group and year.
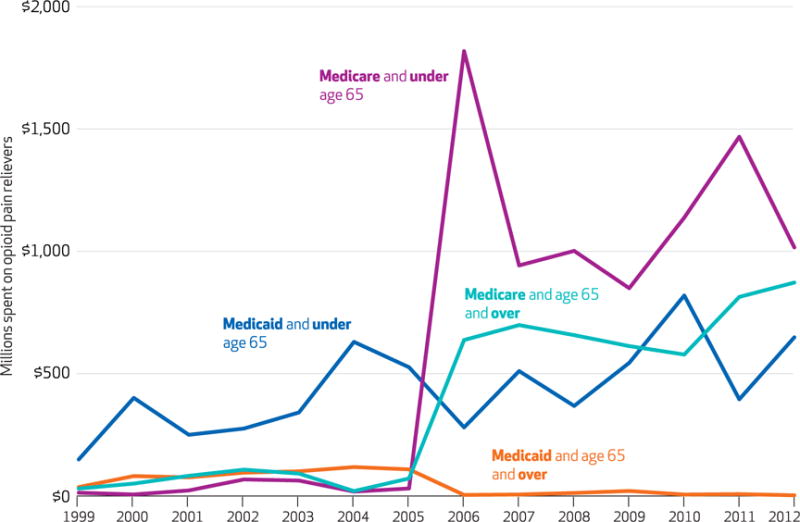
SOURCE Authors’ analysis. NOTES Expenditures were adjusted by the Medical Expenditure Panel Survey’s pharmaceutical price index, which used 2009 as the base year. Medicare spending for both elderly and nonelderly enrollees increased significantly (p < 0.01) from 2005 to 2006.
We also found that Medicare paid significantly more per patient for opioid pain relievers than Medicaid or private insurance did (Exhibit 3). Furthermore, there were substantial differences in per capita spending for payers by patient age. Spending by Medicare for people ages 45–64 was not only dramatically higher than for beneficiaries ages 65 and older, but it was also higher than spending by any other payer for any age group. Medicaid also paid significantly more for patients ages 45–64 than it did for any other age group. By contrast, per patient spending for opioids by private insurance did not differ significantly across the three older age groups in our analysis.
Exhibit 3.
US annual expenditures for opioid pain relievers per person with at least one prescription
| Age (years)
|
|||||
|---|---|---|---|---|---|
| Payer | All | 65 and older | 45–64 | 25–44 | 24 and younger |
| Medicare | $328 | $192 | $683 | $339 | $12 |
| Medicaid | 139 | 69 | 251 | 120 | 47 |
| Private insurance | 209 | 205 | 274 | 171 | 48 |
SOURCE Authors’ analysis. NOTES Expenditures were adjusted by the Medical Expenditure Panel Survey’s pharmaceutical price index, which used 2009 as the base year. Data for the years after the implementation of Medicare Part D (2006–12) were combined because of small samples sizes.
USE OF OPIOIDS
Even though total expenditures for opioid pain relievers did not increase substantially from 2006 to 2012, the amount of opioids prescribed continued to grow (Exhibit 4). The total amount of opioids (in MME) prescribed tripled between 1999 and 2012. The overall trends for MME are significant. Total opioids prescribed in terms of MME almost doubled between 2006 and 2012, while total expenditures changed little. This suggests that there has been a shift toward less expensive drugs but not toward weaker ones over this time period.
Exhibit 4. Total US morphine milligram equivalents (MMEs) prescribed, by payer type and year.
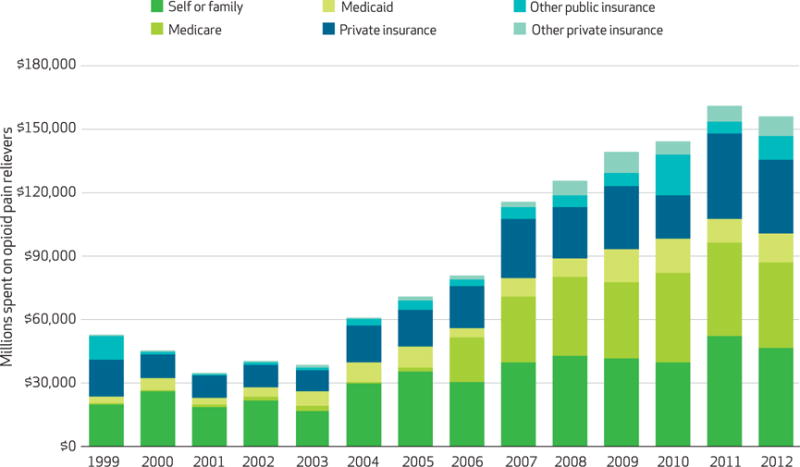
SOURCE Authors’ analysis. NOTE The overall trends for MME are significant (p < 0.001).
To further examine whether there has been a shift toward less expensive opioids, we calculated the cost per 100 MME by payer type (see the online Appendix).25 In recent years, opioids prescribed to the noninstitutionalized US population have become less expensive for a given drug strength, and the amount of the cost that patients pay out of pocket has declined as well. The average cost per 100 MME was around $8.90 in 2001. Approximately half of this amount came from out-of-pocket spending, and about one-fourth came from private insurance. By 2006 the cost per 100 MME had not changed substantially, but out-of-pocket spending covered approximately one-third of that amount instead of one-half; private insurance covered slightly less than one-quarter. Consumers’ out-of-pocket spending on opioids per 100 MME declined from $4.40 to $0.90 between 2001 and 2012 (see the online Appendix).25 The newly implemented Medicare Part D covered one-third of the amount. Finally, by 2012 the expenditure per 100 MME had dropped dramatically, falling to $4.70. Of that amount, approximately 20 percent came from out-of-pocket spending, roughly 30 percent from private insurance, and about 25 percent from Medicare.
Discussion
This study found substantial changes in the financing and cost of opioid pain relievers that coincided with the large increase in mortality associated with these drugs during the period 1999–2012. The consumer out-of-pocket share decreased from 53 percent in 1999 to 18 percent in 2012. This means that third-party payment for the drugs increased from 47 percent in 1999 of the total spending to 82 percent in 2012. Out-of-pocket spending for the drugs declined from $4.40 in 2001 to $0.90 in 2012. Medicare Part D probably had an impact on prices of these drugs. Even though Medicare does not directly negotiate drug prices with insurance companies, previous research has shown that the introduction of the Medicare drug program was associated with decreased prices in therapeutic classes that contained multiple competing drugs.26 Consistent with this research, we found that the average cost of opioid pain relievers declined after 2006.
The growing importance of third-party payment for opioid drugs—particularly the dramatic change associated with the implementation of Medicare Part D—raises the question of how financing changes are related to consumption of opioid pain relievers. The dramatic increase in Medicare spending on the drugs may seem incongruous, given the relatively low rate of fatal overdose in the elderly population. We found that since 2006, Medicare has spent more than Medicaid on opioids for people younger than sixty-five.
A potential explanation for this is that there has been a shift in how people enrolled in both Medicare and Medicaid (known as “dual eligibles”) receive prescription benefits. Dual eligibles, including those younger than age sixty-five and low-income seniors, received prescription drug benefits through Medicaid before 2006 and through Medicare Part D after 2006.27 Adults who receive Social Security Disability Insurance (SSDI) for twenty-four consecutive months are automatically enrolled in Medicare28 and receive prescription benefits through Medicare Part D. MEPS does not have sufficient information to identify the amount of time that SSDI recipients have received payments, but it is likely that most of the population receiving Medicare payments before age sixty-five are eligible for them because of disability. Given that Medicare spending for opioids among patients younger than age sixty-five has exceeded Medicaid spending for opioids since 2006, disabled Medicaid enrollees receiving their prescription benefits through Medicare Part D likely represent a large percentage of Medicaid recipients who are prescribed opioids. Medicaid recipients are at higher risk for overdose related to opioid pain relievers than the general population,16 and many of these patients may receive their prescription benefits through Medicare.
Patients receiving SSDI may be more likely than other patients to receive opioid pain relievers for many reasons. Several diagnoses that could contribute to limited functional capacity to work are also associated with long-term opioid use, including depression,29 back pain, neck pain, arthritis or joint pain, and headache.30 Providers may be prescribing opioids to patients with chronic pain to improve functional capacity, even though there is insufficient evidence to determine whether pain or functional capacity improves with long-term opioid use for chronic pain.31 In addition, exposure to chronic opioid therapy among patients with new diagnoses of chronic noncancer pain is a strong risk factor for incident opioid use disorder,32 which may contribute to the limited ability to work.
Even though our study did not explore the health conditions for which these drugs were prescribed, inappropriate prescribing is known to be common.15 The CDC recently published guidelines for prescribing opioids for chronic pain outside of active cancer treatment, palliative care, and end-of-life care.33 The audience for the guidelines is primary care providers, who prescribe the greatest proportion of opioids in the United States, including in Medicare.21 The guidelines recommend using non-opioid therapies for chronic pain, using opioids for chronic pain only when the benefits are likely to out-weigh the risks, and prescribing the lowest effective dosage when opioids are used.
Insurers have begun to implement a variety of approaches to reduce inappropriate prescribing of opioids. For example, insurance plans have used drug utilization review to attempt to reduce potentially dangerous or inappropriate opioid use.34 In addition, there have been several state Medicaid initiatives to address the inappropriate use of opioids. These include patient review and restriction programs, which have been found to be associated with cost savings and changes in utilization.35 Newer Medicaid initiatives include prior authorization for high-dose and long-acting opioid pain relievers36 and pharmacy management review programs.37
The Centers for Medicare and Medicaid Services (CMS) implemented the Overutilization Monitoring System in 2013.20 CMS uses this system to analyze data on prescription drug utilization and identify patients who may be overusing opioid pain relievers; it reports this information to the patients’ Medicare Part D plan sponsors. CMS also uses the National Benefit Integrity Medicare Drug Integrity Contractor to monitor fraud and abuse in the Medicare Part D program and since 2013 has directed that contractor to focus on proactive data analysis in Part D. Evaluations of prescribing behaviors and patient outcomes associated with these programs will be critical for determining whether they reduce high-risk opioid use, overdose, and other adverse outcomes.35
Conclusion
This study documented changes in the financing of opioid pain relievers that coincided with the opioid overdose epidemic. Insurance (private and public) now pays most of the cost for the drugs. Since the implementation of Medicare Part D in 2006, Medicare has been the leading payer for the drugs, accounting for about 20–30 percent of the cost. We observed a decline in opioid drug unit costs after 2006 as well. Medicare spent considerably more on these drugs for enrollees younger than age sixty-five than it did for any other age group or than Medicaid or private insurance payer did for any age group.
Our study was the first to comprehensively examine the financial aspects of use of opioid pain relievers at the population level. Further work is needed to evaluate how strategies employed by various payers can decrease high-risk opioid utilization and ultimately reduce overdose mortality, while ensuring that patients with pain are treated appropriately.
Supplementary Material
Footnotes
Some results from this research were presented at National Rx Abuse Summit, Atlanta, Georgia, March 2015. The findings and conclusions in this report are those of the authors and do not necessarily represent the official position of the Centers for Disease Control and Prevention.
Contributor Information
Chao Zhou, Email: xaf9@cdc.gov, Economist in the National Center for Injury Prevention and Control, Centers for Disease Control and Prevention (CDC), in Atlanta, Georgia.
Curtis S. Florence, Lead health economist in the National Center for Injury Prevention and Control, CDC
Deborah Dowell, Senior medical advisor in the National Center for Injury Prevention and Control, CDC.
NOTES
- 1.Centers for Disease Control and Prevention. Vital signs: overdoses of prescription opioid pain relievers—United States, 1999–2008. MMWR Morb Mortal Wkly Rep. 2011;60(43):1487–92. [PubMed] [Google Scholar]
- 2.Paulozzi LJ. Prescription drug overdoses: a review. J Safety Res. 2012;43(4):283–9. doi: 10.1016/j.jsr.2012.08.009. [DOI] [PubMed] [Google Scholar]
- 3.Centers for Disease Control and Prevention. CDC WONDER [Internet] Atlanta (GA): CDC; [last reviewed 2016 Feb 9, cited 2016 Mar 17]. Available from: http://wonder.cdc.gov. [Google Scholar]
- 4.Chen LH, Hedegaard H, Warner M. Drug-poisoning deaths involving opioid analgesics: United States, 1999–2011. NCHS Data Brief. 2014;(166):1–8. [PubMed] [Google Scholar]
- 5.Portenoy RK. Chronic opioid therapy in nonmalignant pain. J Pain Symptom Manage. 1990;5(1 Suppl):S46–62. [PubMed] [Google Scholar]
- 6.Federation of State Medical Boards. Model guidelines for the use of controlled substances for the treatment of pain. Euless (TX): The Federation; 1998. [Google Scholar]
- 7.Berry PH, Dahl JL. The new JCAHO pain standards: implications for pain management nurses. Pain Manag Nurs. 2000;1(1):3–12. doi: 10.1053/jpmn.2000.5833. [DOI] [PubMed] [Google Scholar]
- 8.Veterans Health Administration. Pain as the 5th vital sign toolkit [internet] Washington (DC): VHA; 2000. Oct, Rev. ed. [cited 2016 Mar 17]. Available from: http://www.va.gov/PAINMANAGEMENT/docs/Pain_As_the_5th_Vital_Sign_Toolkit.pdf. [Google Scholar]
- 9.Joranson DE, Ryan KM, Gilson AM, Dahl JL. Trends in medical use and abuse of opioid analgesics. JAMA. 2000;283(13):1710–4. doi: 10.1001/jama.283.13.1710. [DOI] [PubMed] [Google Scholar]
- 10.Goverment Accounting Office. Oxy-Contin abuse and diversion and efforts to address the problem: highlights of a government report. Jf Pain Palliat Care Pharmacother. 2004;18(3):109–13. [PubMed] [Google Scholar]
- 11.Dietz E. Trends in employer-provided prescription-drug coverage. Mon Labor Rev. 2004;127:37–45. [Google Scholar]
- 12.National Center for Health Statistics. Health, United States, 2013: with special feature on prescription drugs [Internet] Hyattsville (MD): NCHS; 2014. [cited 2016 Mar 17]. Available from: http://www.cdc.gov/nchs/data/hus/hus13.pdf. [PubMed] [Google Scholar]
- 13.Manning WG, Newhouse JP, Duan N, Keeler EB, Leibowitz A, Marquis MS. Health insurance and the demand for medical care: evidence from a randomized experiment. Am Econ Rev. 1987;77(3):251–77. [PubMed] [Google Scholar]
- 14.Kuo YF, Raji MA, Chen NW, Hasan H, Goodwin JS. Trends in opioid prescriptions among Part D Medicare recipients from 2007 to 2012. Am J Med. 2016;129(2):221 e21–30. doi: 10.1016/j.amjmed.2015.10.002. [DOI] [PMC free article] [PubMed] [Google Scholar]
- 15.Mack KA, Zhang K, Paulozzi L, Jones C. Prescription practices involving opioid analgesics among Americans with Medicaid, 2010. J Health Care Poor Underserved. 2015;26(1):182–98. doi: 10.1353/hpu.2015.0009. [DOI] [PMC free article] [PubMed] [Google Scholar]
- 16.Whitmire JT, Adams GW. Unintentional overdose deaths in the North Carolina Medicaid population: prevalence, prescription drug use, and medical care services. SCHS Studies [serial on the Internet] 2010 Aug; [cited 2016 Mar 17]. Available from: http://www.schs.state.nc.us/schs/pdf/schs_162_web_081310.pdf.
- 17.Centers for Disease Control and Prevention. Overdose deaths involving prescription opioids among Medicaid enrollees—Washington, 2004–2007. MMWR: Morb Mortal Wkly Rep. 2009;58(42):1171–5. [PubMed] [Google Scholar]
- 18.Liu Y, Logan JE, Paulozzi LJ, Zhang K, Jones CM. Potential misuse and inappropriate prescription practices involving opioid analgesics. Am J Manage Care. 2013;19(8):648–65. [PubMed] [Google Scholar]
- 19.Sullivan MD, Edlund MJ, Fan MY, Devries A, Brennan Braden J, Martin BC. Trends in use of opioids for noncancer pain conditions 2000–2005 in commercial and Medicaid insurance plans: the TROUP study. Pain. 2008;138(2):440–9. doi: 10.1016/j.pain.2008.04.027. [DOI] [PMC free article] [PubMed] [Google Scholar]
- 20.CMS.gov. CMS strategy to combat Medicare Part D prescription drug fraud and abuse [Internet] Baltimore (MD): Center for Medicare and Medicaid Services; 2014. Jan 6, [cited 2016 Mar 17]. (Fact Sheet). Available from: https://www.cms.gov/Newsroom/MediaReleaseDatabase/Fact-sheets/2014-Fact-sheets-items/2014-01-06-2.html. [Google Scholar]
- 21.Chen JH, Humphreys K, Shah NH, Lembke A. DIstribution of opioids by different types of Medicare prescribers. JAMA Intern Med. 2016;176(2):259–61. doi: 10.1001/jamainternmed.2015.6662. [DOI] [PMC free article] [PubMed] [Google Scholar]
- 22.Cohen J. Methodology Report #1: design and methods of the Medical Expenditure Panel Survey Household Component [Internet] Rockville (MD): Agency for Healthcare Research and Quality; 1997. Jul, [cited 2106 Mar 17]. Available from: http://meps.ahrq.gov/data_files/publications/mr1/mr1.shtml. [Google Scholar]
- 23.Brandeis University, Heller School for Social Policy and Management. Technical assistance guide No. 01–13: calculating daily morphine milligram equivalents [Internet] Waltham (MA): Brandeis University; 2013. Feb 28, [cited 2016 Mar 17]. Available from: http://www.pdmpassist.org/pdf/BJA_performance_measure_aid_MME_conversion.pdf. [Google Scholar]
- 24.Chronic Conditions Data Warehouse. Medicare enrollment by age group, 2004–2013 [Internet] Baltimore (MD): Centers for Medicare and Medicaid Services; 2016. [cited 2016 Mar 17]. Available from: https://www.ccwdata.org/web/guest/medicare-charts/medicare-enrollment-charts. [Google Scholar]
- 25.To access the Appendix, click on the Appendix link in the box to the right of the article online.
- 26.Duggan M, Morton FS. The effect of Medicare Part D on pharmaceutical prices and utilization. Am Econ Rev. 2010;100(1):590–607. doi: 10.1257/aer.100.1.590. [DOI] [PubMed] [Google Scholar]
- 27.Kaiser Commission on Medicaid and the Uninsured. Dual eligibles and Medicare Part D [Internet] Washington (DC): The Commission; 2006. May, [cited 2016 Mar 17]. Available from: https://kaiserfamilyfoundation.files.wordpress.com/2013/01/7454.pdf. [Google Scholar]
- 28.Social Security Administration. Disability planner: Medicare coverage if you’re disabled [Internet] Baltimore (MD): SSA; [cited 2016 Mar 17]. Available from: https://www.ssa.gov/planners/disability/dapproval4.html. [Google Scholar]
- 29.Braden JB, Sullivan MD, Ray GT, Saunders K, Merrill J, Silverberg MJ, et al. Trends in long-term opioid therapy for noncancer pain among persons with a history of depression. Gen Hosp Psychiatry. 2009;31(6):564–70. doi: 10.1016/j.genhosppsych.2009.07.003. [DOI] [PMC free article] [PubMed] [Google Scholar]
- 30.Braden JB, Fan MY, Edlund MJ, Martin BC, DeVries A, Sullivan MD. Trends in use of opioids by noncancer pain type 2000–2005 among Arkansas Medicaid and HealthCore enrollees: results from the TROUP study. J Pain. 2008;9(11):1026–35. doi: 10.1016/j.jpain.2008.06.002. [DOI] [PMC free article] [PubMed] [Google Scholar]
- 31.Chou R, Deyo R, Devine B, Hansen R, Sullivan S, Jarvik JG, et al. The effectiveness and risks of long-term opioid treatment of chronic pain [Internet] Rockville (MD): Agency for Healthcare Research and Quality; 2014. Sep, (Evidence Report/Technology Assessment No. 218). [cited 2016 Mar 17] Available from: http://www.effectivehealthcare.ahrq.gov/ehc/products/557/1971/chronic-pain-opioid-treatment-report-141205.pdf. [DOI] [PubMed] [Google Scholar]
- 32.Edlund MJ, Martin BC, Russo JE, DeVries A, Braden JB, Sullivan MD. The role of opioid prescription in incident opioid abuse and dependence among individuals with chronic noncancer pain: the role of opioid prescription. Clin J Pain. 2014;30(7):557–64. doi: 10.1097/AJP.0000000000000021. [DOI] [PMC free article] [PubMed] [Google Scholar]
- 33.Dowell D, Haegerich TM, Chou R. CDC guideline for prescribing opioids for chronic pain—United States, 2016. MMWR Recomm Rep. 2016;65:1–49. doi: 10.15585/mmwr.rr6501e1. [DOI] [PubMed] [Google Scholar]
- 34.Gonzalez AM, 3rd, Kolbasovsky A. Impact of a managed controlled-opioid prescription monitoring program on care coordination. Am J Manage Care. 2012;18(9):516–24. [PubMed] [Google Scholar]
- 35.Haegerich TM, Paulozzi LJ, Manns BJ, Jones CM. What we know, and don’t know, about the impact of state policy and systems-level interventions on prescription drug overdose. Drug Alcohol Depend. 2014;145:34–47. doi: 10.1016/j.drugalcdep.2014.10.001. [DOI] [PMC free article] [PubMed] [Google Scholar]
- 36.Oregon State, University College of Pharmacy. Drug use evaluation: long-acting opioids (LAO) [Internet] Salem (OR): The University; [cited 2016 Mar 17]. Available from: http://www.orpdl.org/durm/drug_articles/evaluations/2012_01_26_LAO_DUE.pdf. [Google Scholar]
- 37.Garcia MM, Angelini MC, Thomas T, Lenz K, Jeffrey P. Implementation of an opioid management initiative by a state Medicaid program. J Manag Care Spec Pharm. 2014;20(5):447–54. doi: 10.18553/jmcp.2014.20.5.447. [DOI] [PMC free article] [PubMed] [Google Scholar]
Associated Data
This section collects any data citations, data availability statements, or supplementary materials included in this article.