

Abstract
Eph signaling, which arises following stimulation by ephrins, is known to induce opposite cell behaviors such as promoting and inhibiting cell adhesion as well as promoting cell-cell adhesion and repulsion by altering the organization of the actin cytoskeleton and influencing the adhesion activities of integrins. However, crosstalk between Eph/ephrin with integrin signaling has not been fully elucidated in leukocytes, including monocytes and their related cells. Using a cell attachment stripe assay, we have shown that, following stimulation with ephrin-A1, kinase-independent EphA2 promoted cell spreading/elongation as well as adhesion to integrin ligand-coated surfaces in cultured U937 (monocyte) and J774.1 (monocyte/macrophage) cells as well as sublines of these cells expressing dominant negative EphA2 that lacks most of the intracellular region. Moreover, a pull-down assay showed that dominant negative EphA2 is recruited to the β2 integrin/ICAM1 and β2 integrin/VCAM1 molecular complexes in the subline cells following stimulation with ephrin-A1-Fc. Notably, this study is the first comprehensive analysis of the effects of EphA2 receptors on integrin-mediated cell adhesion in monocytic cells. Based on these findings we propose that EphA2 promotes cell adhesion by an unknown signaling pathway that largely depends on the extracellular region of EphA2 and the activation of outside-in integrin signaling.
Keywords: cell adhesion, EphA2, integrins, ICAM1, U937
Introduction
Leukocyte transendothelial migration into inflammatory tissues, a process that is induced by inflammatory mediators and proinflammatory cytokines, consists of several consecutive steps: (I) leukocyte tethering and slow rolling along the luminal wall of activated endothelial cells, (II) movement arrest and firm adhesion to the luminal wall followed by cell spreading, (III) intravascular crawling to a specific migration region, and then leukocyte transendothelial migration via paracellular and transcellular routes.1-3 These steps, which occur sequentially but partially overlap, are primarily triggered and mediated by various membrane proteins. Initially, selectins and their ligands expressed in the leukocytes and endothelial cells function to regulate transmigration, followed by extensive control by integrins in the leukocytes and integrin ligands in the endothelial cells. Finally, cell-cell adhesion molecules in the endothelial cells mediate the final stages of this process. Thus, among these various protein/ligand pairs, integrins and integrin ligands appear to play key functions during transendothelial migration and have been shown to be involved in all steps of the process.
Integrins consist of a large family of cell adhesion molecules that bind to ligands in the extracellular matrix and on the cell-surface, including intercellular adhesion molecule 1 (ICAM1) and vascular cell adhesion molecule 1 (VCAM1), which are known to play important roles during leukocyte transendothelial migration. Integrins are heterodimeric transmembrane proteins composed of an α and a β integrin subunit, and to date, 18 α subunits and 8 β subunits have been identified in humans, generating 24 heterodimers.4,5 Notably, integrins can transform their conformation from a bent inactive form to an extended closed form (intermediate ligand affinity) and further to an extended open conformation (high ligand affinity). However, integrins usually exist in their inactive forms on the cell surface and this conformation change occurs only in response to stimulating signals from other receptors.6-8 These signals resulting in integrin activation, termed “inside-out signaling,” have been intensively studied for the leukocyte integrins LFA1 (αLβ2) and VLA4 (α4β1). In this context, chemokines rapidly induce integrin activation through Rap1 small GTPase activation, a key regulator of integrins and many other molecules involved in chemokine driven signaling cascades in leukocytes. Once activated and bound to their ligands, integrins will generate intracellular signals termed “outside-in signaling,” which will in turn alter various cellular functions, including cell motility and proliferation. Moreover, in their activated state, integrins can regulate their own molecular states, such as their clustering and stabilization, allowing them to continue regulating downstream signaling.6-8
Eph receptors and their ligands, known as ephrins, are membrane proteins that regulate cell adhesion and movement as well as cell-cell repulsion and adhesion by modulating the organization of the actin cytoskeleton mainly via Rho family GTPases. In mammals, the Eph receptor tyrosine kinase superfamily has 14 members that are divided into EphA (A1–A8 and A10) and EphB (B1–B4 and B6) classes on the basis of sequence homology of their extracellular domains.9,10 Members of these 2 receptor classes promiscuously bind ligands of the ephrin-A (A1–A5) and -B (B1–B3) classes, respectively. Ephrin-A ligands are anchored to the plasma membrane through a glycosyl phosphatidylinositol linkage, while ephrin-B ligands are a class of transmembrane proteins. Interaction of Eph receptors with ephrin results in bidirectional signal propagation in both receptor- and ligand-expressing cells. Forward signaling by Eph depends mainly on autophosphorylation and phosphorylation by other tyrosine kinases as well as association of the receptor with various effector proteins. Notably, kinase-independent Eph signals induced by ephrin binding can also occur during forward signaling, while reverse signaling by ephrin largely depends on the Src kinase family.9,10
Evidence indicating crosstalk between Eph/ephrin signaling and integrin signaling has also accumulated recently.11,12 For example, integrin outside-in signaling initiated by ligand binding involves the recruitment and activation of downstream effector molecules such as focal adhesion kinase (FAK) and Src family kinases, which also serve as key players in the downstream signaling cascade mediated by Eph/ephrin signaling.11,13 While these receptor regulated pathways appear to overlap in some ways, to our knowledge, studies investigating the interaction between Eph/ephrin and integrin/integrin ligand signaling on cell adhesion are limited, particularly in leukocytes, and many of these investigations are controversial. For example, in human T cells, β1- and β2 integrin-mediated adhesion to fibronectin and ICAM1 have been shown to be stimulated by ephrin-A activation and inhibited by EphA.14 However, in chronic lymphocytic leukemia cells, ephrin-A signaling significantly reduced integrin adhesion to ICAM1, VCAM-1, and several extracellular matrix molecules in addition to impairing chemokine (C-C motif) ligand 19 (CCL-19)-mediated transendothelial migration.15 Thus, additional research is warranted in order to elucidate the relationship between these 2 receptor/ligand pairs specifically in leukocyte cells.
In the present study, we sought to evaluate the interaction between Eph/ephrin signaling and integrin/ligand signaling in cultured monocyte and monocyte/macrophage cells during cell adhesion. Based on our findings, we propose that extracellular region-dependent EphA2 signaling can promote cell adhesion and extension which in turn stimulate the clustering of integrin/integrin ligand complexes. To our knowledge, this is the first comprehensive analysis of the EphA2/integrin receptor interaction during monocytic cell adhesion.
Results
RT-PCR and flow cytometric evaluation of EphA2 expression
We successfully established the EphA2ΔC-EGFP-U937 and -J774.1 sublines which express dominant negative EphA2, a form of the protein that replaces the human EphA2 intracellular domain, including the kinase region, with EGFP. Under a fluorescent microscope, EGFP appeared to be mainly localized in the cell periphery and was likely embedded in the cell membrane. Further, while the EphA2ΔC-EGFP-U937 cell population consisted of cells of various EGFP-fluorescence intensities, the intensity was relatively weak in the EphA2ΔC-EGFP-J774.1 cell population (Fig. 1A). To determine the expression levels of endogenous and exogenous EphA2, we screened native U937 and J774.1 cells along with their EphA2 subline cells using RT-PCR. To do so, we designed 2 primer sets for human EphA2: one set was used to detect endogenous EphA2 by amplifying transcripts coding the intracellular domain, and the second set was used to detect both endogenous and exogenous EphA2 by amplifying transcripts coding the extracellular domain. Primer sets for mouse and human EphA2 were also used to identify the expression of endogenous and dominant negative EphA2, respectively, in the EphA2ΔC-EGFP-J774.1 cells. Notably, we detected transcripts for both the intracellular and extracellular domains of human EphA2, with the expression levels of the EphA2 intracellular domain being found at almost the same levels for the U937 cells and their subline cells (Fig. 1B). However, the expression of the EphA2 extodomain transcript in the EphA2ΔC-EGFP-U937 cells was significantly higher (5.99 ± 0.40 times) than that observed in the parent cell line (P = 0.0001; Fig. 1B). These results indicate that the expression of endogenous EphA2 was largely unchanged, while that of the exogenous EphA2 was over 5 times higher in the subline. In the J774.1 and EphA2ΔC-EGFP-J774.1 cells, we also detected endogenous and exogenous EphA2, and it appears that the expression of endogenous EphA2 was almost the same between the subline and the parent cells (Fig. 1C). Further, the intensity of the band highlighting the expression of exogenous EphA2 in the subline cells was substantial but relatively low in comparison with that of endogenous EphA2. However, this is not a direct comparison as different sets of primers were used. Thus, it appears that the expression of endogenous EphA2 is almost the same between the parent and the subline cells for both U937 and J774.1 cell types.
Figure 1.
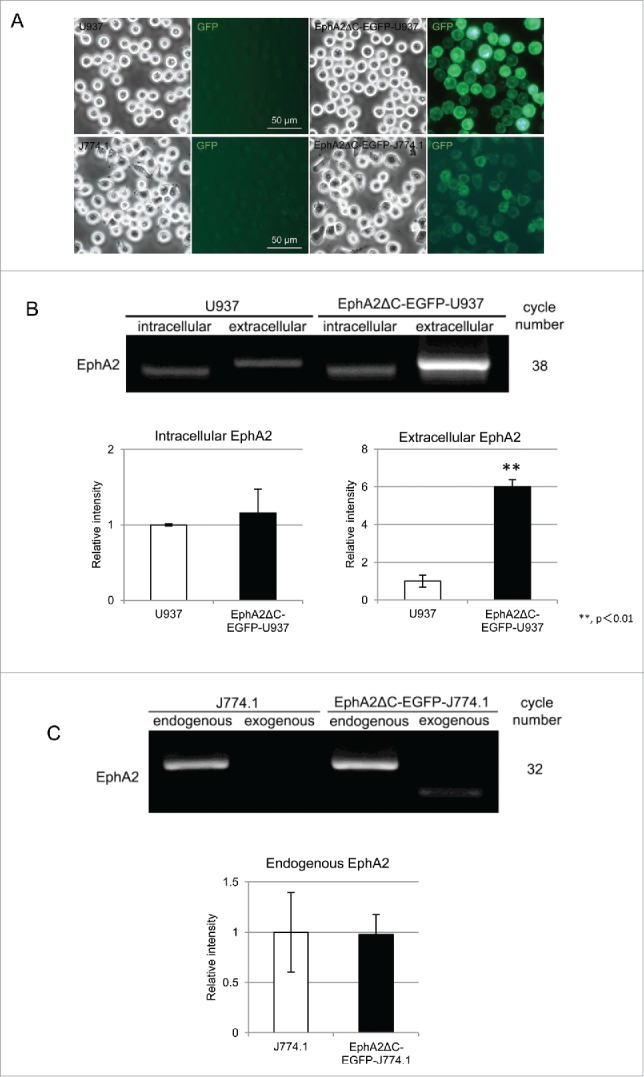
Expression of endogenous and exogenous/dominant negative EphA2 in U937, EphA2ΔC-EGFP-U937, J774.1, and EphA2ΔC-EGFP-J774.1 cells. (A) Typical phase contrast and fluorescence micrographs highlighting the expression of the EphA2ΔC-EGFP protein. (B) EphA2 mRNAs amplified from the intracellular and extracellular regions by RT-PCR showing the expression of endogenous and total (endogenous plus exogenous) EphA2, respectively, in U937 and its subline. Densitometric quantification of the RT-PCR amplification levels of EphA2 from 3 independent experiments normalized to the levels of GAPDH. Data is presented as the mean ± SD. **P< 0.01. (C) Amplification of endogenous and exogenous EphA2 in J774.1 cells and their subline cells by RT-PCR. Densitometric quantification of the RT-PCR amplification levels were determined from 3 independent experiments and normalized to the levels of GAPDH. Data is presented as the mean ± SD.
To determine cell surface expression of EphA2 protein, including the endogenous and exogenous forms, we screened the native U937 and J774.1 cells along with their sublines using flow cytometry. EphA2-positive and -negative populations were detected not only in the U937 cells, but also in their subline cells, with 38.0% being positive and 62.0% being negative in the parent cells and 74.1% and 25.9% being positive and negative, respectively, in the EphA2ΔC-EGFP-U937 cells (Fig. 2A). In the subline cells, both the EphA2-positive and -negative populations were EGFP-positive, suggesting that the dominant negative EphA2 protein may not be localized to the cell surface in the negative population. Another explanation is that the sensitivity of the cell analyzer may too low to detect EphA2-positive cells as the EGFP-fluorescence of the dominant negative EphA2 was localized to the cell periphery/cell membranes when viewed with a fluorescent microscope, particularly in faintly EphA2-positive cells (Fig. 1A). In contrast, J774.1 and its subline consisted of one population in terms of EphA2 and EGFP expression (Fig. 2B). Histograms of the fluorescence intensity of EphA2 (X-axis) and cell number (Y-axis) for the EphA2ΔC-EGFP-J774.1 cells largely overlapped with those of the parent cells, but histograms of the EGFP-fluorescence intensity clearly shifted to the right in the subline. These data indicate that the surface expression density of the dominant negative EphA2 is considerably lower than that of endogenous EphA2 in the EphA2ΔC-EGFP-J774.1 cells. Overall, our analysis of EphA2 expression, together with the fluorescent microscopy and RT-PCR data, indicates that the expression levels of dominant negative EphA2 protein are likely much higher than that of endogenous EphA2 in EphA2ΔC-EGFP-U937 cells, while being only slightly higher than that observed in -J774.1 cells. Thus, if the dominant negative EphA2 does in fact affect cell behavior, it will likely be more prominently detected in EphA2ΔC-EGFP-U937 cells compared to the in EphA2ΔC-EGFP-J774.1 cells.
Figure 2.
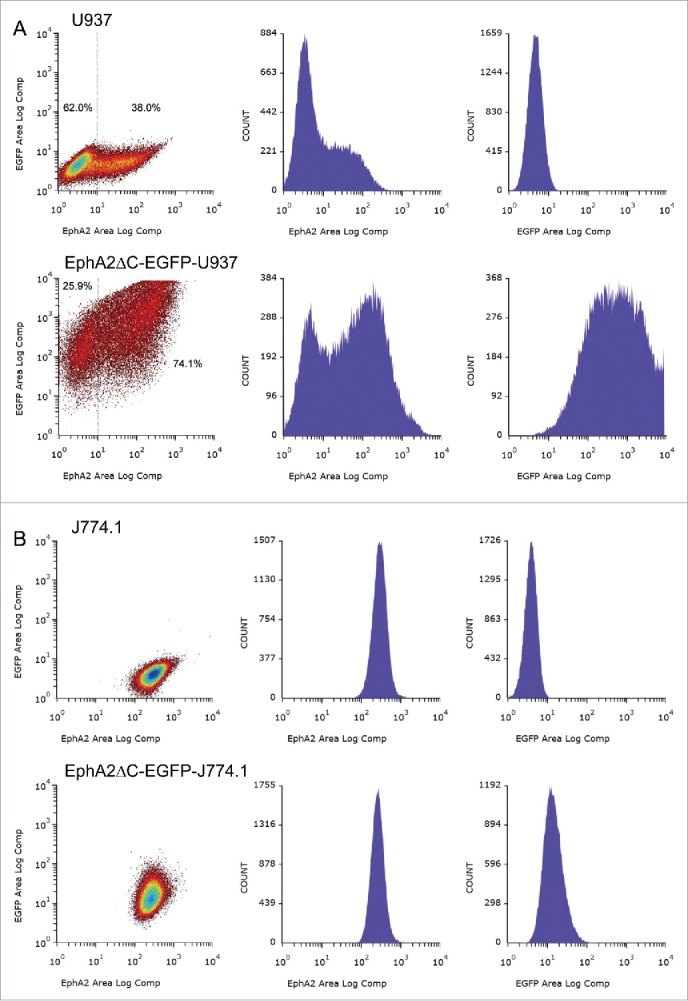
Representative histograms showing EphA2 and/or EGFP expression in U937 and EphA2ΔC-EGFP-U937 cells (A) as well as J774.1 and EphA2ΔC-EGFP-J774.1 cells (B).
RT-PCR analysis of integrin expression
To determine the expression levels of various α and β integrin chains (αL, αM, αX, αD, α4, β1, β2), we screened the U937 and J774.1 cells along with their subline cells by RT-PCR. A relatively large amount of the β1 integrin subunit and small amounts of the αM, αX, and β2 integrin subunits were detected in both the U937 and EphA2ΔC-EGFP-U937 cells, while the αL, αD, and α4 subunits were not clearly expressed in our RT-PCR analysis even when we used up to 38 Alification cycles (Fig. 3A). The expression levels observed for the αX and β2 subunits were almost the same between the parent and subline cells, while those for the αM and β1 subunits were 0.68 ± 0.17 times lower and 1.41 ± 0.12 times higher in the EphA2ΔC-EGFP-U937 cells compared to the parent cells, respectively (P = 0.042, P = 0.028; Fig. 3A). These data indicate that the U937 cells likely express a substantial amount of αMβ2 integrins (Mac1; CD11b/CD18) and αXβ2 integrins (CD11c/CD18), and expression of these integrins in EphA2ΔC-EGFP-U937 cells may not change. Moreover, the β1 integrin subunit likely forms heterodimers with a number of α subunits other than α4, such as α1, α2, α5, α6, or α11.4
Figure 3.
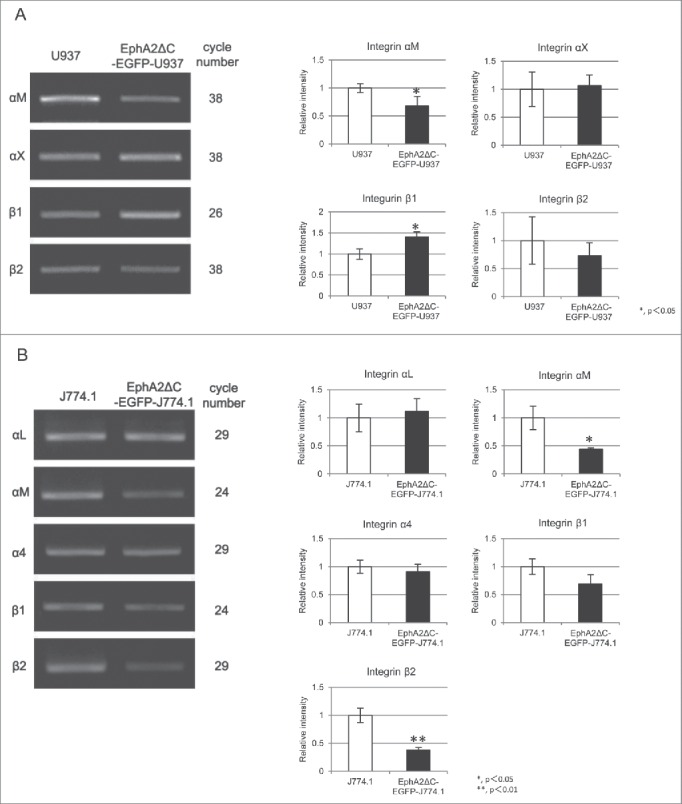
RT-PCR amplification and densitometric quantification of αM, αX, β1, and β2 integrin subunit expression in U937 and EphA2ΔC-EGFP-U937 cells (A), along with that of αL, αM, α4, β1, and β2 in J774.1 and EphA2ΔC-EGFP-J774.1 cells (B). Data from 3 independent experiments, normalized to GAPDH, are shown as mean ± SD. *P< 0.05, **P < 0.01.
In this analysis, we also found that J774.1 cells express mRNA coding the αL, αM, α4, β1, and β2 integrin subunits, and the expression levels for these integrins were higher than those observed for U937 cells in terms of cycle number during PCR amplification. In fact, J774.1 and EphA2ΔC-EGFP-J774.1 cells both expressed relatively large amounts of the αM and β1 subunits as well as moderate amounts of αL, α4, and β2 (Fig. 3B). In contrast, αX and αD were not clearly expressed in our RT-PCR analysis even when up to 29 Alification cycles were used. Notably, αL, α4, and β1 were expressed at almost the same levels in the parent and subline cells, while αM and β2 expression in the subline cells was 0.44 ± 0.02 and 0.38 ± 0.05 times lower than that in the parent cells, respectively (P = 0.01, P = 0.001; Fig. 3B). These data indicate that J774.1 cells likely express several types of integrins, such as αLβ2 (CD11a/CD18), αMβ2 (CD11b/CD18), and α4β1 (CD49d/CD29),4 and that αLβ2 and αMβ2 are likely more highly expressed in the parent cells compared to the subline.
EphA2 stimulation may be involved in cell adhesion/spreading/elongation on integrin ligand-coated surfaces
In order to determine whether EphA2 signaling affects cell adhesion processes in U937 and J774.1 cells, we analyzed the adhesion properties of the parent cell lines along with their subline cells expressing dominant negative EphA2 when cultured on coverslip surfaces coated fully with integrin ligand proteins (including ICAM1-Fc, VCAM1-Fc, fibronectin (FN), or collagen) or human IgG Fc (control) and overlaid with strips of efnA1-Fc. Thus, regions of integrin ligand plus efnA1-Fc as well as regions of only integrin ligand proteins were presented alternatively at certain intervals.
In doing so, we found that U937 cells clearly formed stripes with different cell densities corresponding to the efnA1-Fc stripes on the ICAM1-Fc, VCAM1-Fc, and collagen-coated surfaces using phase-contrast microscopy, indicating a preference for regions occupied by efnA1-Fc plus the integrin ligand over the regions containing only the integrin ligand (Fig. 4A and B). In contrast, on the surface of the efnA1-Fc plus FN/FN only and the efnA1-Fc plus Fc/Fc only coated coverslips, the U937 cells adhered to the coverslip, but did not form stripes of different cell densities (Fig. 4A). Furthermore, we calculated the cell densities for the U937 cells on the ephrin/ligand-coated surfaces relative to the ligand only-coated control regions for each. These data indicate that the relative cell densities on the efnA1-Fc plus ICAM1-Fc surface (compare to ICAM1-Fc), efnA1-Fc plus VCAM1-Fc surface (compared to VCAM1-Fc), and efnA1-Fc plus collagen surface (compared to collagen) were 3.35 ± 0.19, 2.18 ± 0.11, and 10.72 ± 2.42 fold higher, respectively, highlighting significant differences compared to the ligand only surfaces (P = 0.0003, P = 0.0015, P = 0.0029; Fig. 4C). Overall, EphA2ΔC-EGFP-U937 cells appear to not only form clear stripes with different cell densities corresponding to the efnA1-Fc stripes on various integrin ligands compared to the parent cells, but this phenomenon was also observed to occur for the Fc control proteins as well (Fig. 4A). Flat and spreading cells were also detected in the efnA1-Fc plus integrin ligand strips for the subline cells (Fig. 4B). The relative cell densities on the efnA1-Fc plus ICAM1-Fc, efnA1-Fc plus VCAM1-Fc, efnA1-Fc plus FN, efnA1-Fc plus collagen, and efnA1-Fc plus Fc surfaces compared to their ligand-only surfaces were significantly altered, being detected at 4.90 ± 0.32 (P = 0.0001), 3.19 ± 0.28 (P = 0.0002), 3.65 ± 0.20 (P = 0.0001), 8.15 ± 1.11 (P = 0.0004), and 6.81 ± 0.39 (P = 0.0001) fold higher levels, respectively (Fig. 4C). Comprehensively, these data show that EphA2ΔC-EGFP-U937 cells demonstrate stronger adhesion to the integrin ligands than the parent cells, indicating that the dominant negative EphA2 could be promoting cell adhesion to integrin ligands by binding to efnA1-Fc.
Figure 4.
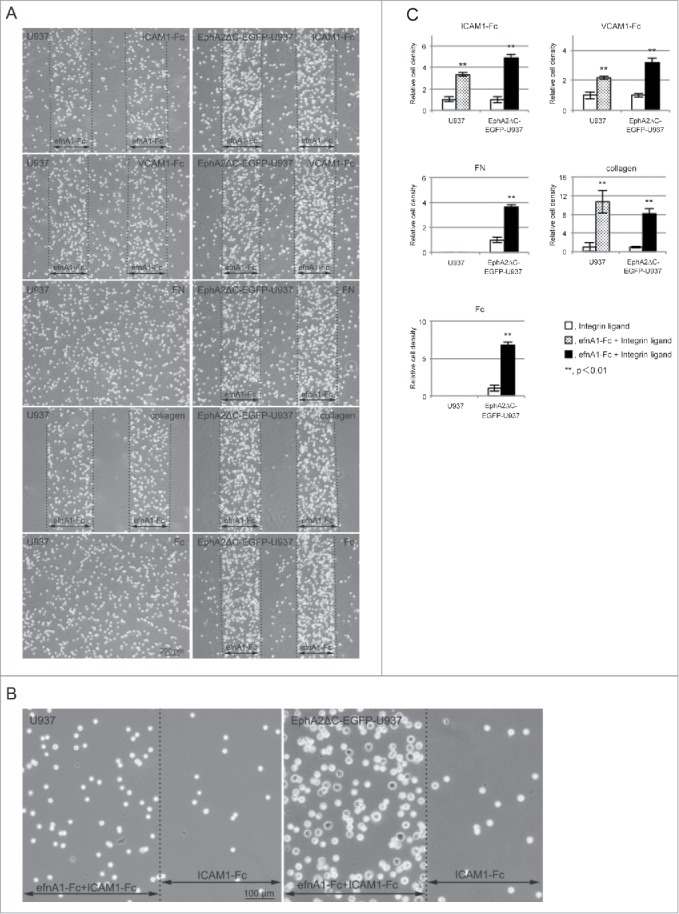
U937 and EphA2ΔC-EGFP-U937 cells preferentially occupy the efnA1-Fc plus integrin ligand protein-coated surfaces. (A) Typical phase contrast micrographs showing cells cultured on a coverslip surface on which efnA1-Fc and the indicated integrin ligand were adsorbed in stripes (approximately 0.48-mm in width) and overall, respectively. (B) Representative high magnification phase contrast micrographs showing U937 and EphA2ΔC-EGFP-U937 cells cultured on a coverslip surface in stripes of efnA1-Fc plus ICAM1-Fc and ICAM1-Fc only. (C) Quantified cell densities in the stripes of efnA1-Fc plus integrin ligand compared to integrin ligand only surfaces. The results from 3 independent experiments are shown. Data are presented as the means ± SD. **P< 0.01.
In contrast, the J774.1 cells did not form clear stripes with different cell densities on any of the efnA1-Fc/integrin ligand-coated surfaces (Fig. 5A). However, some differences in cell morphology were observed between regions corresponding to the efnA1-Fc stripes, whereby flat/elongated cells were more present in the efnA1-Fc plus integrin ligand-coated regions (Fig. 5B). Thus, we also calculated the cell densities in the regions corresponding to the efnA1-Fc stripes compared to their ligand-only counterparts and found that on the efnA1-Fc plus ICAM1-Fc, efnA1-Fc plus collagen, and efnA1-Fc plus Fc surfaces the cell densities were significantly different, being 1.23 ± 0.04 (P = 0.010), 1.13 ± 0.05 (P = 0.041), and 1.15 ± 0.07 (P = 0.045) fold higher in the ephrin/ligand strips, respectively (Fig. 5C). Notably, there were no significant differences in cell density on the VCAM1-Fc or FN surfaces. We also compared the densities of flat/elongate cells on the ephrin-A1 plus integrin ligand regions and the integrin ligand only-coated surface. This analysis revealed that the relative frequencies of flat/elongate cells on the efnA1-Fc plus ICAM1-Fc, efnA1-Fc plus VCAM1-Fc, efnA1-Fc plus FN, efnA1-Fc plus collagen, and efnA1-Fc plus Fc surfaces compared to their ligand-only surfaces were significantly different, being 2.42 ± 0.14 (P = 0.0099), 1.24 ± 0.03 (P = 0.0001), 1.63 ± 0.32 (P = 0.0410), 2.20 ± 0.36 (P = 0.0271), and 1.61 ± 0.13 (P = 0.0019) fold greater, respectively (Fig. 5D). Thus, it is likely that EphA2 signaling induces cell flattening/elongation in J774.1 cells.
Figure 5.
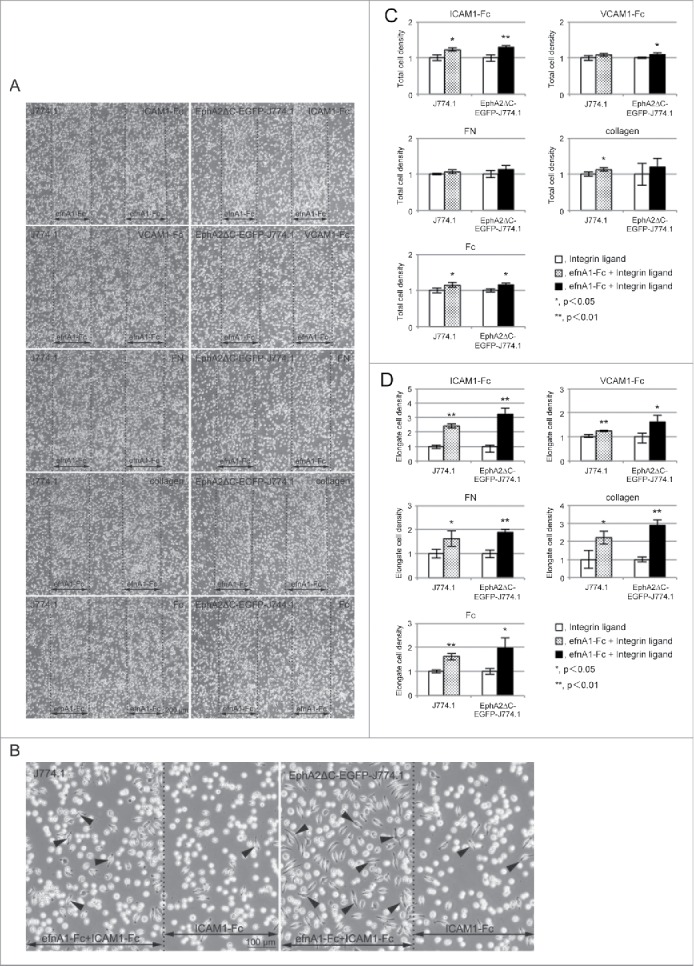
J774.1 and EphA2ΔC-EGFP-J774.1 cells preferentially occupied the efnA1-Fc plus integrin ligand protein-coated regions rather than the integrin ligand only surface. (A) Typical phase contrast micrographs showing cells cultured on a coverslip surface on which efnA1-Fc and the indicated integrin ligand were adsorbed in stripes (approximately 0.48-mm in width) and overall, respectively. (B) Representative high magnification phase contrast micrographs showing cells cultured on a coverslip surface in stripes of efnA1-Fc plus ICAM1-Fc and ICAM1-Fc only. (C) Quantified cell densities in stripes of efnA1-Fc plus each integrin ligand. The results from 3 independent experiments are shown. Data are presented as the means ± SD. *P< 0.05, **P < 0.01. (D) Quantification of the relative number of flat/elongate cells in stripes of efnA1-Fc plus integrin ligand and integrin ligand only surfaces. The results from 3 independent experiments are shown. Data are presented as the means ± SD. *P < 0.05, **P < 0.01.
Similar to their parent cells, EphA2ΔC-EGFP-J774.1 cells also lacked clearly formed stripes in the efnA1-Fc plus ligand regions (Fig. 5A). However, after calculating the cell densities in the efnA1-Fc stripes, it appears that the relative cell densities were significantly higher in the efnA1-Fc plus ICAM1-Fc (1.30 ± 0.05, P = 0.008), efnA1-Fc plus VCAM1-Fc (1.09 ± 0.05, P = 0.049), and efnA1-Fc plus Fc (1.16 ± 0.06, P = 0.020) compared to their ligand-only surfaces (Fig. 5C). No significant differences in cell density were found on the FN and collagen surfaces. These data indicate that the adhesion properties of the EphA2ΔC-EGFP-J774.1 cells on the ephrin/integrin ligand-coated surfaces are similar to those observed for the parent cells. On the other hand, the relative frequencies of flat/elongated cells appear to be significantly higher on the efnA1-Fc plus ICAM1-Fc (3.23 ± 0.39, P = 0.0006), efnA1-Fc plus VCAM1-Fc (1.61 ± 0.27, P = 0.0242), efnA1-Fc plus FN (1.89 ± 0.12, P = 0.0015), efnA1-Fc plus collagen (2.89 ± 0.30, P = 0.0006), and efnA1-Fc plus Fc (1.97 ± 0.43, P = 0.0192) surfaces compared to their ligand-only counterparts (Fig. 5D). Thus, it appears that EphA2 signaling independent of kinase activation likely induces cell extension/elongation on the integrin ligand-coated surfaces as the frequencies of flat/elongated cells on the efnA1-Fc plus integrin ligand-coated surfaces were higher in the EphA2ΔC-EGFP-J774.1 compared to the parent cells for all of the integrin ligands tested.
Actin filament staining highlights EphA2 stimulation of cell spreading/elongation
Because phase contrast images cannot adequately reveal cell shape, particularly for the thin cytoplasmic regions of the cell, we also stained the actin fibers in order to compare the morphology of the cells on the efnA1-Fc plus integrin ligand-coated surface to those on the integrin ligand only surface. Actin staining with fluorochrome-labeled phalloidin revealed a dense arch/ring bordering the cell periphery composed of actin filaments in the U937 cells cultured on the efnA1-Fc plus integrin ligand-coated surfaces compared to those on the integrin ligand only coated surface for all ligands examined (Fig. 6A). Furthermore, the fluorescence intensity of this dense actin filament arch/ring was even greater in the EphA2ΔC-EGFP-U937 cells on the efnA1-Fc plus integrin ligand-coated surfaces compared to the parent cells for all ligands tested, and more protrusions also appeared to extend from the cells (Fig. 6A).
Figure 6.
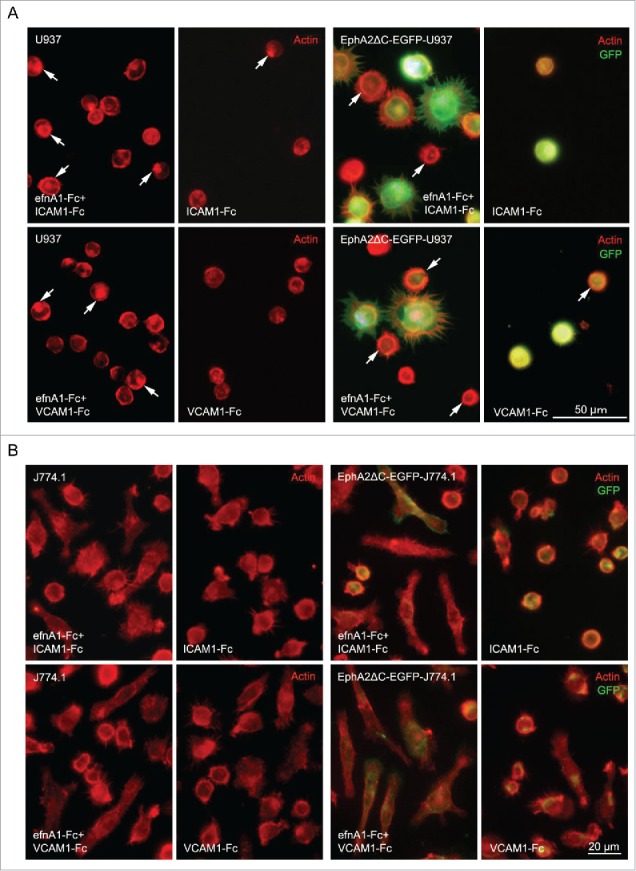
Representative images of actin fluorescence staining (red) highlighting U937 and EphA2ΔC-EGFP-U937 (A) as well as J774.1 and EphA2ΔC-EGFP-J774.1 (B) cell morphology when cultured on a coverslip surface with stripes of efnA1-Fc plus ICAM1-Fc and ICAM1-Fc alone as well as efnA1-Fc plus VCAM-1-Fc and VCAM-1-Fc alone. Arrows indicate the dense actin filament arch/ring or spots of high expression in (A).
Notably, the J774.1 cells were more frequently observed to be elongated on the efnA1-Fc plus integrin ligand-coated surfaces compared to the integrin ligand only-coated surfaces for all ligands as well (Fig. 6B). Moreover, cells on the efnA1-Fc plus integrin ligand-coated surfaces tended to be elongated considerably more in the EphA2ΔC-EGFP-J774.1 subline cells compared to the parent cells (Fig. 6B). These results not only indicate that endogenous EphA2 stimulation likely promotes polarization in actin filament distribution, but also demonstrate that dominant negative EphA2 stimulation may play a role in cell spreading/elongation via activation of the integrin-ligand interaction.
Physical association of EphA2 with β2 integrin/ICAM1 and β2 integrin/VCAM1 complexes
Because the dominant negative EphA2, which lacks the intracellular region including the kinase domain, could possibly promote kinase-independent cell adhesion to the integrin ligand-coated surfaces following stimulation by efnA1-Fc, we sought to examine whether EphA2 physically associates with integrins in U937 and EphA2ΔC-EGFP-U937 cells. To do so, endogenous EphA2 and integrin β2 were detected in pull-down precipitates with ICAM1-Fc and VCAM1-Fc from lysates of U937 and EphA2ΔC-EGFP-U937 cells treated with efnA1-Fc as well as Fc alone (control) (Fig. 7A and B). The band density in our immunoblots using an anti-EphA2 antibody raised against the extracellular region of the protein indicates that endogenous EphA2 expression was similar among samples with or without stimulation by efnA1-Fc. This was confirmed by reprobing the same PVDF membrane using another anti-EphA2 antibody raised against the C-terminal peptide of EphA2 (data not shown). Band densities in the immunoblots for the β2 integrin subunit were also similar among samples with or without efnA1-Fc stimulation. In contrast, exogenous EphA2 (EphA2ΔC-EGFP) was detected in pull-down precipitates with ICAM1-Fc and VCAM1-Fc only from lysates of EphA2ΔC-EGFP-U937 cells treated with efnA1-Fc, but not with the Fc control. Moreover, the band densities indicate that exogenous EphA2 was distinctly more expressed compared to endogenous EphA2, a result that was confirmed by reprobing the same PVDF membrane using the anti-GFP antibody. These data indicate that EphA2 does in fact associate with the β2 integrin/ICAM1 and β2 integrin/VCAM1 complexes with or without efnA1-Fc activation, indicating that ephrin stimulation is not required for this association. However, binding of the dominant negative EphA2 with the β2 integrin/ICAM1 and β2 integrin/VCAM1 complexes does appear to require efnA1-Fc activation. Taken together, it is likely that, when in the presence of ephrin, this association is largely mediated by the extracellular region of EphA2.
Figure 7.
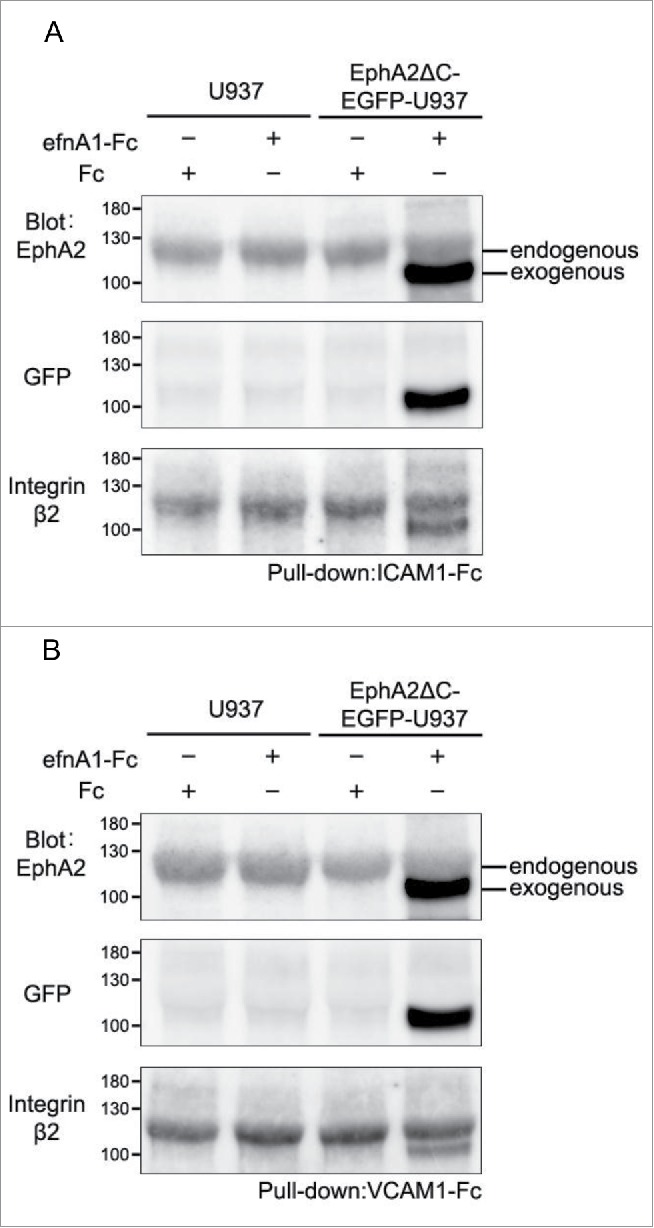
Molecular association of EphA2 with the β2 integrin/ICAM1 (A) and β2 integrin/VCAM1 complexes (B) in U937 and EphA2ΔC-EGFP-U937 cells.
Discussion
Integrins are key molecules that are known to be involved in cell adhesion and movement. These transmembrane proteins can respond, primarily with a conformational change, to signaling molecules on both the inside (i.e., “inside-out signaling”) and outside of the cell (i.e., “outside-in signaling”).6–8 This versatility allows integrins to play a role in the regulation of various cellular functions, including cell motility and proliferation, by regulating their own molecular states, such as their clustering and stabilization. In contrast, the Eph/ephrin signaling pathway primarily controls tissue organization and, at a cellular level, Eph forward signaling has been shown to regulate cell adhesion and movement as well as cell-cell adhesion/repulsion by modulating the organization of the actin cytoskeleton.9,10 This process mainly occurs via Rho family GTPases and by influencing the adhesion activities of integrins.
Notably, this is not the first time the crosstalk between Eph/ephrin and integrin/ligand signaling has been investigated. In human T cells, for example, EphA4 activation by ephrin-A1 and ephrin-A3 has been shown to inhibit β1 and β2 integrin adhesion to fibronectin- and ICAM1-coated surfaces.14 In contrast, adhesion to fibronectin, but not poly-l-lysine, appears to be increased in dendritic cells derived from CD34+ positive progenitors following EphA2 activation with ephrin-A3-Fc, probably through a β1 integrin activation pathway.16 Moreover, EphA4 was previously shown to be physically associated with αIIbβ3 integrin in resting platelets, an interaction that appears to support the stable accumulation of platelets on collagen surfaces under flow.17 However, to our knowledge, the interactions between Eph/ephrin and integrin/integrin ligand signaling on cell adhesion are largely unknown, particularly in regard to leukocytes.
In the present study, we examined the adhesion behavior of monocytic U937 and monocyte/macrophage J774.1 cells on integrin ligand-coated surfaces. Furthermore, these behaviors were also compared to those of their subline cells, which stably express dominant negative EphA2. Our RT-PCR and flow cytometry experiments showed that the expression levels of endogenous EphA2 were sufficient to perform functional experiments, and that these levels were the same between the parent and the subline cells for both U937 and J774.1. Further, the expression of EphA2ΔC-EGFP was prominent in the U937 subline, but was low in the J774.1 subline cells compared to that of endogenous EphA2 in these cell types.
Furthermore, using a cell attachment stripe assay with alternating stripes of efnA1-Fc (to trigger EphA2 signaling) plus integrin ligands with regions containing integrin ligands alone, we have shown that monocytic cells preferentially migrate and adhere to surfaces containing ligands for both Eph and integrins. U937 parent cells formed stripes of different cell densities on the efnA1-Fc stripes on the integrin ligand-coated surface for all the integrin ligands examined, except for FN. They also adhered to the FN-coated surface without forming clear stripes, which indicates that the physical tethering by binding of the EphA2 with efnA1-Fc itself is not likely a drive force behind the stripe formation of different cell densities on the efnA1-Fc stripes. Thus, the results of the cell attachment stripe assay indicate that the arrest of cellular movement may be driven by EphA signaling and that there is substantial crosstalk between EphA and integrin signaling. This crosstalk was further supported by our pull-down experiments using ICAM1 and VCAM1 as bait molecules, which indicate that endogenous EphA2 is physically associated with the β2 integrin/ICAM1 and β2 integrin/VCAM1 complexes with or without efnA1-Fc activation. Notably, this association appears to occur regardless of ephrin stimulation, which we believe indicates that this interaction likely involves the active forms of the integrin complexes, which have intermediate or high ligand affinity and the ability to recruit and activate various kinases, possibly including that of endogenous EphA2. While the exogenous EphA2 still associated with the β2 integrin/ICAM1 and VCAM1 complexes, this only occurred following ephrin activation. Thus, in this case, the activated integrins alone were likely unable to recruit/facilitate the dominant negative form of EphA2 as it lacks most of the intracellular region including most of the juxtamembrane region, kinase domain, and the cytoplasmic tail region. However, once the extracellular region of EphA2 was stimulated separately with ephrin, the interaction with the integrin complexes could proceed as usual, circumventing the need for kinase activation. Unfortunately, we were unable to differentiate between this kinase-independent binding phenomenon and the kinase-dependent interactions for the endogenous EphA2 as these effects would both result in association with the integrin complexes. It is, however, important to note that because of no clear changes were observed in the amount of endogenous EphA2 in pull-down precipitates for the U937 or the subline cells with or without efnA1-Fc, it is unlikely that the addition of ephrin significantly enhances or hinders these interactions. It is also possible that these pathways cancel each other out in an unknown way. In fact, previous studies have reported controversial behaviors in terms of cell adhesion via Eph signaling,11,13,14,16,18 and it is likely that Eph activation and association with integrin/integrin ligand complexes may be regulated by at least 2 or more different signaling pathways. Further studies are required to fully elucidate the behavior of Eph receptors in regards to their association with various integrins. Regardless of the mechanism, it appears that the EphA2 extracellular domain is able to form a molecular complex with β2 integin/ICAM1 and β2 integin/VCAM1 following activation by ephrin-A1, which in turn stimulates cell spreading and elongation possibly due to activation of outside-in integrin signaling-induced cluster formation.
As mentioned previously, the current literature on the crosstalk of these 2 prominent signaling cascades is largely controversial. This is further compounded by the various regions and domains studied for these transmembrane proteins. For example, kinase-dependent EphA2 signaling was clearly shown to inhibit cell spreading, migration, and integrin-mediated cell adhesion in tumor cells by Miao et al.; 18 however, we show in the present study that EphA2 supports these process when it lacks the kinase domain. Notably, in this previous study, EphA2 was shown to be constitutively associated with FAK in resting cells, and activation of the endogenous EphA2 kinase appeared to induce integrins to adopt an inactive conformation via the recruitment of the protein tyrosine phosphatase SHP2 followed by the dephosphorylation of FAK and dissociation of the FAK-EphA2 complex. On the other hand, our kinase-independent results are also supported by other cell adhesion studies performed in epithelial and stromal cells. In these studies, after binding with ephrin-A, EphA8 enhanced cell adhesion to fibronectin via α5β1- and β3 integrins in a kinase-independent manner that was largely dependent on the juxtamembrane segment of the cytoplasmic region which forms a stable complex with phosphatidylinositol 3-kinase (PI 3-kinase).19 However, our dominant negative EphA2 only encodes amino acids 1–563, meaning that it lacks most of juxtamembrane region that is necessary for this association with PtdIns 3-kinase.20 Thus, this may not be the primary mechanism involved in EphA2 stimulation of integrin-related cell adhesion in our cell lines. Similarly, Matsuoka et al.21 showed that by binding with ephrin-B2, a truncated EphB6 receptor lacking the cytoplasmic domain promoted cell adhesion and migration via an unknown mechanism in human embryonic kidney 293T cells. Thus, further studies are required to determine the endogenous EphA2 signaling cascade triggered by ephrin-A1 stimulation that acts to promote cell adhesion via integrins in leukocytes as well as other cell types.
Interestingly, the effects of efnA1-Fc-stimulated dominant negative EphA2 on integrin-mediated cell adhesion were not clearly detected in the J774.1 subline cells, outside of the increased level of cellular spreading and/or elongation. This is likely related to the lower expression ratio of dominant negative EphA2 to endogenous EphA2 in the J774.1 subline cells compared to the U937 subline cells. Although the results varied depending on the subline used, to our knowledge, this is the first comprehensive analysis of the effects of EphA2 receptor-stimulated integrin-mediated cell adhesion in monocytic cells. Taken together, we propose that EphA2 may play a significant role in transendothelial migration of leukocytes into inflammatory tissues via its molecular association with β2 integin/ICAM1 and β2 integin/VCAM1. This is a particularly plausible hypothesis as ephrin-A1 is upregulated by proinflammatory cytokines in inflamed blood vessels.22
Continued research in this field is essential in order to fully elucidate the level of interaction between the integrin and Eph signaling cascades. Notably, the Eph/ephrin cell-cell communication molecular system is essential to the development and physiology of various tissues and organs.9,10 There is also accumulating evidence implicating Eph/ephrin signaling in the progression of diverse chronic diseases, including cancer,9,11,23 making the moieties involved, receptors and ligands alike, prime candidates for novel therapeutic targeting.11,24 The present study highlights a molecular association of the EphA2 extracellular domain with β2 integrins that largely depends on stimulation by ephrin-A1, which regulates cell adhesion and spreading/elongation on integrin ligand-covered surfaces. It is also possible that a similar interaction may also occur during the transendothelial migration and invasion observed during tumor metastasis as EphA2 is also upregulated in this context.11,24,25 Further studies are required to fully elucidate the molecular mechanisms of EphA2/integrin interactions underlying cell adhesion and transmigration of leukocytes and other cell types.
Materials and Methods
Antibodies
The goat polyclonal antibody against the mouse EphA2 extracellular region was obtained from R&D Systems (AF639). The rabbit polyclonal antibody against the C-terminal peptide of mouse EphA2 was purchased from Santa Cruz Biotechnology (sc-924). The rat monoclonal PE-conjugated antibody against mouse EphA2 used in this study was from R&D Systems (233720). A goat polyclonal antibody against the N-terminal peptide of human integrin β2 was also attained from Santa Cruz Biotechnology (sc-6624). Finally, the rabbit polyclonal antibody against recombinant green fluorescent protein (GFP) was purchased from Invitrogen (R970–01). Horseradish peroxidase (HRP)-conjugated mouse anti-goat IgG (Jackson ImmunoResearch Laboratories; NA931) and HRP-conjugated donkey anti-rabbit IgG (GE Healthcare; 205–035–108) were used as secondary antibodies.
Cells
The human monocyte cell line, U937, was kindly gifted from Dr. Ken-Ichi Kiyomiya (School of Pharmacy, Hyogo University of Health Sciences). The mouse monocyte/macrophage cell line J774.1 used in this study was obtained from RIKEN BioResource Center (Ibaraki, Japan). Both cell types were cultured in RPMI-1640 medium (Sigma-Aldrich; R8758) supplemented with 10% heat-inactivated fetal bovine serum (FBS; Nichirei Biosciences; 171012), 100 U/mL penicillin, and 100 µg/mL streptomycin (pen/strep; Sigma-Aldrich; P4333), and maintained in a 5% CO2 atmosphere at 37°C.
Cell lines stably expressing dominant negative EphA2
The dominant negative EphA2 expression plasmid was constructed as previously described.25 Briefly, the region of human EphA2 (GenBank accession number BC037166) encoding amino acids 1–563, which includes the ectodomain, transmembrane domain, and a portion of the juxtamembrane region, but lacks the rest of the juxtamembrane region, kinase domain, and the following intracellular region.20 This truncated gene, designated EphA2ΔC was amplified by PCR using a sense primer with an EcoRI site and an anti-sense primer with a BamHI site. The PCR product was then digested with EcoRI and BamHI (New England Biolabs; R0101 and R0136, respectively) and ligated into EcoRI and BamHI digested pEGFP-N1 vector (Clontech Laboratories; 6085–1). The resulting plasmid is designated pEGFP-EphA2ΔC.
Plasmid DNA transfections into U937 and J774.1 cells were performed with DMRIE-C Reagent (Life Technologies; 10459–014) according to the manufacturer's protocol. Cells were plated at a concentration of 2 × 10⁶ cells/well in 6-well plates and then transfected with 12 µL of DMRIE-C mixed with 4 µg of the pEGFP-EphA2ΔC vector in Opti-MEM I medium (Life Technologies; 31985–070). The cells were then incubated for 4−5 hrs. After this incubation, RPMI-1640 medium containing 15% FBS was added to the well and incubated for an additional 24 hrs. The cells were then incubated in growth medium containing 1,000–1,200 µg/mL of G418 to select clones stably expressing EGFP tagged EphA2ΔC (EphA2ΔC-EGFP). Clones stably expressing EphA2ΔC-EGFP (designated EphA2ΔC-EGFP-U937 and EphA2ΔC-EGFP-J774.1) were easily identified by their membrane localization of EGFP under fluorescence microscopy. The clones with the brightest fluorescence were used for further experiments.
RT-PCR analysis
Total RNA was isolated from all 4 of the stable cell lines, EphA2ΔC-EGFP-U937, EphA2ΔC-EGFP-J774.1, U937, and J774.1, using TRIZOL reagent (Invitrogen; 15596). RT-PCR analysis was carried out as previously described.26 Briefly, 1 µg of total RNA was transcribed into first-strand cDNA using M-MLV reverse transcriptase, RNase H− (Promega; M3682), and oligo (dT)18 primers according to the manufacturer's instructions. For the detection of EphA2, various α/β integrin chains (αL, αM, αX, αD, α4, β1, β2), and GAPDH, 1 µL of the reaction mix (out of the total 25 µL) was amplified using the reverse-transcribed DNA as a template. The primer pairs and cycle numbers for PCR amplification used in this study are shown in Tables 1 and 2 for the U937 and J774.1 cells, respectively. Primer pairs amplifying the intracellular and extracellular domains of human EphA2 were used to examine the expression level of endogenous and exogenous EphA2 in the EphA2ΔC-EGFP-U937 cells, respectively. In the EphA2ΔC-EGFP-J774.1 cells, primer pairs amplifying mouse EphA2 and the extracellular domain of human EphA2 were used to examine the expression level of endogenous and exogenous EphA2, respectively. The RT reaction was omitted for the negative control sample. The expression levels of the amplified EphA2 and integrin mRNAs were compared between the parent and the subline cells from 3 independent experiments following normalization to GAPDH.
Table 1.
Primers and cycle numbers for PCR amplification used in U937 cells
| Human | Primer | Product size(bp) | Annealing temp.(˚C) | Cycle number | |
|---|---|---|---|---|---|
| Integrin αL | Forward | 5′-CGGGTGTTTATCTACCAGAG-3′ | 392 | 50.2 | 38 |
| Reverse | 5′-GACATCAGGGTGACCATATC-3′ | ||||
| Integrin αM | Forward | 5′-GTGTGATGCTGTTCTCTACG-3′ | 364 | 53.2 | 38 |
| Reverse | 5′-CTCCATGATTGCCTTGACTC-3′ | ||||
| Integrin αX | Forward | 5′-CCAGATCACCTTCTTGGCTAC-3′ | 523 | 58.0 | 38 |
| Reverse | 5′-CTTCAGGGTGAAATCCAGCTC-3′ | ||||
| Integrin αD | Forward | 5′-ATCAGCAGGCAGGAAGAATC-3′ | 518 | 52.0 | 38 |
| Reverse | 5′-ACCTCGTCTTCTTCTAGCAC-3′ | ||||
| Integrin α4 | Forward | 5′-CCTAATGGAGAACCTTGTGG-3′ | 481 | 51.9 | 38 |
| Reverse | 5′-CTACTTCGGTAGTATGCTGG-3′ | ||||
| Integrin β1 | Forward | 5′-TTCAAGGGCAAACGTGTGAG-3′ | 459 | 54.0 | 26 |
| Reverse | 5′-CCGTGTCCCATTTGGCATTC-3′ | ||||
| Integrin β2 | Forward | 5′-CAATAAACTCTCCTCCAGGG-3′ | 522 | 52.0 | 38 |
| Reverse | 5′-CAGTACTGCCCGTATATCAG-3′ | ||||
| EphA2 (intracellular) | Forward | 5′-AAGTACGAGGTCACTTACCG-3′ | 437 | 53.7 | 38 |
| Reverse | 5′-ACACAGGATGGATGGATCTC-3′ | ||||
| EphA2 (extracellular) | Forward | 5′-ACTACGGCACCAACTTCCAG-3′ | 480 | 57.0 | 38 |
| Reverse | 5′-GGCTCTCAGATGCCTCAAAC-3′ | ||||
| GAPDH | Forward | 5′-GGATGATGTTCTGGAGAGCC-3′ | 607 | 57.0 | 24 |
| Reverse | 5′-GGATGATGTTCTGGAGAGCC-3′ | ||||
Table 2.
Primers and cycle numbers for PCR amplification used in J774.1 cells
| Mouse (human) | Primer | Product size(bp) | Annealing temp.(˚C) | Cycle number | |
|---|---|---|---|---|---|
| Integrin αL | Forward | 5′-TCTGGAGGGACCTATGTTAC-3′ | 526 | 60.0 | 29 |
| Reverse | 5′-TTCCTCTACAGGTTCTGAGG-3′ | ||||
| Integrin αM | Forward | 5′-GACCAGTAAGGTCATACAGC-3′ | 586 | 60.0 | 24 |
| Reverse | 5′-CATCATGTCCTTGTACTGCC-3′ | ||||
| Integrin αX | Forward | 5′-CCAACTGTTCACTTCACACC-3′ | 404 | 56.0 | 29 |
| Reverse | 5′-GTTTGGTCATCTACAGCCAG-3′ | ||||
| Integrin αD | Forward | 5′-GTACGGTTCTCCTGGAAAGA-3′ | 513 | 48.0 | 29 |
| Reverse | 5′-GTCCCTCATATCCTCGTTCT-3′ | ||||
| Integrin α4 | Forward | 5′-CTTAGGCTACTCAGTTGGAG-3′ | 496 | 63.0 | 29 |
| Reverse | 5′-TGAGTAGGTGGAGGAGATTC-3′ | ||||
| Integrin β1 | Forward | 5′-GCCAGCCAAGTGACATAGAG-3′ | 532 | 63.0 | 24 |
| Reverse | 5′-AAGCCACCTTCTGGAGAATC-3′ | ||||
| Integrin β2 | Forward | 5′-GCACCAAGTACAAAGTCAGC-3′ | 353 | 60.1 | 29 |
| Reverse | 5′-GTCATCAAGCATGGAGTAGG-3′ | ||||
| EphA2 (intracellular) | Forward | 5′-AAAGCGGGCTACACTGAGAA-3′ | 486 | 62.0 | 32 |
| Reverse | 5′-CACTTCCCACATGACAATGC-3′ | ||||
| EphA2 (human, extracellular) | Forward | 5′-CGCCGGCTCTGATGCACCTT-3′ | 312 | 62.0 | 32 |
| Reverse | 5′-TCCTGAGGTGCCCGGAAGAA-3′ | ||||
| GAPDH | Forward | 5′-GACTCCACTCACGGCAAAT-3′ | 689 | 59.0 | 22 |
| Reverse | 5′-TCCTCAGTGTAGCCCAAGAT-3′ | ||||
Flow cytometry
EphA2ΔC-EGFP-U937, EphA2ΔC-EGFP-J774.1, and their parent cells were prepared at a concentration of 1 × 10⁷ cells/mL in PBS containing 1% BSA and 1 mM EDTA. PE-conjugated anti-EphA2 antibody (0.25 µg) was added to the cell suspension (1 × 10⁶ cells, 500 µL) and incubated for 20 min at room temperature. After washing, 50,000 cells were analyzed for EphA2 and EGFP expression with a flow cytometer (S3 Cell Sorter, Bio-Rad Laboratories). Cell analyses were performed in triplicate.
Cell adhesion assay and visualization of actin fibers
We examined the adhesion of EphA2ΔC-EGFP-U937, EphA2ΔC-EGFP-J774.1, and their parent cells to integrin ligand-coated coverslip surfaces on which ephrin-A1-Fc (efnA1-Fc; a soluble form of ephrin-A1 in which the ectodomain is fused to the Fc portion of human IgG) was adsorbed in stripes according to Ogawa et al.26 with the following modifications. Briefly, coverslips (15 mm diameter) were soaked overnight in 100 µL of 100 µg/mL poly-L-ornithine (Sigma-Aldrich; P4638) in PBS, washed with sterile water, and dried. Comb-shaped silicon masks with parallel teeth and gaps about 0.48 mm in width were then applied to the poly-L-ornithine-coated glass surface. EfnA1-Fc (100 µL of 10 µg/mL; R&D Systems; 602-A1) diluted in Hanks' balanced salt solution (HBSS; Sigma-Aldrich; H6648) was adsorbed onto these surfaces at room temperature for 60 min. The coverslips were then washed with Ca/Mg-free HBSS and the masks were removed. After washing, the following integrin ligands (100 µL of 10 µg/mL in HBSS) or human IgG Fc (control, 100 µL of 10 µg/mL in HBSS; MP Biomedicals, 55911) were adsorbed onto their respective surfaces at room temperature for 60 min: ICAM1-Fc (R&D Systems; 796-IC), VCAM1-Fc (R&D Systems; 643-VM), FN (from bovine serum, Sigma-Aldrich; F4759), or collagen (Cellmatrix, Nitta Gelatin Inc.; type I-C). After washing, coverslips were placed in 3.5 cm, culture dishes to which 2 mL of RPMI1640 containing 10% FBS were added. Cells were then plated at the following densities: 2.5 × 10⁴ cells/cm2 (U937 and the subline EphA2ΔC-EGFP-U937) or 4.37 × 10⁴ cells/cm2 (J774.1 and the subline EphA2ΔC-EGFP-J774.1). The cells were allowed to adhere for 2 and 4 hrs, respectively, at 37˚C, followed by fixation with 10% formalin in PBS for 10 min at room temperature. Phase contrast images of the cellular field, including both the efnA1-Fc and the integrin ligand or Fc protein-coated regions (test regions) and the adjacent integrin ligand or Fc protein-coated control regions, were photographed using a 4× objective lens (IX71; Olympus). To quantitatively analyze the cell density on the test region versus the control region, we counted the cells in an area of 0.48 mm × 1.55 mm in each test and control region, respectively. This was repeated for each integrin ligand protein used. We also compared the frequencies of flat/elongate cells on the test regions vs. the control regions by counting the cells. In this analysis, the dark cells under phase contrast microscopy were regarded as flat cells, while cells whose length were more than twice the width and/or had more than 3 cytoplasmic processes were regarded as elongate cells. Thus, both dark and elongate cells were counted together. These frequencies were determined from 3 independent experiments and normalized to those for the Fc-coated control region.
Furthermore, after fixation of the cells on the coverslips, they were incubated with 0.02% TritonX-100 in PBS for 5 min at room temperature. To visualize the actin filaments, cells were preincubated in a humid chamber with 1% BSA in PBS (BSA-PBS) for 30 min, followed by incubation with 165 nM Alexa 568-labeled phalloidin (Invitrogen; A12380) in BSA-PBS for 20 min at room temperature. After washing with PBS and mounting with PermaFluor (Thermo Fisher Scientific; K002), the cells were photographed under a fluorescence microscope (IX71; Olympus).
Pull-down assay and immunoblotting
To examine the molecular association between EphA2 and β2 integrins, we performed a pull-down assay. U937 and EphA2ΔC-EGFP-U937 cells stimulated by efnA1-Fc (2.0 µg/mL) or human Fc (2.0 µg/mL) at 37˚C for 30 min were homogenized in non-denaturing lysis buffer (50 mM HEPES pH 7.5, 150 mM NaCl, 1.5 mM MgCl2, 1 mM EDTA, 10 mM sodium pyrophosphate, 100 mM sodium fluoride, 10% glycerol, 1% Triton X-100) containing a phosphatase inhibitor (1 mM sodium orthovanadate) and protease inhibitors. The supernatants were collected after high-speed centrifugation, and the protein concentrations were measured using a Protein Assay kit (Bio-Rad Laboratories; 500–0006) following the manufacturer's protocol. A pull-down assay was carried out using the integrin ligands ICAM1-Fc and VCAM1-Fc as bait proteins. For precipitation, 800 µg of the cell extracts were incubated overnight at 4˚C or for 2 hrs at room temperature with 2 µg of ICAM1-Fc or VCAM1-Fc, followed by the addition of 20 µL of protein A/G-magnetic beads (Thermo Fisher Scientific; 88802) for 1 hr at room temperature. The precipitates were then separated on 10% polyacrylamide gels and transferred onto polyvinyl difluoride (PVDF) membranes. The PVDF membranes were blotted with anti-EphA2 (0.2 µg/mL, R&D Systems; AF639) in Tris-buffered saline with 0.1% Triton X-100 (TBS-T) containing 3% BSA and 0.2% nonfat dry milk. After incubation with a 1:20,000 dilution of HRP-conjugated anti-goat IgG, the immunoblots were developed using ECL Prime chemiluminescence reagents (Amersham Biosciences; RPN2232). The membrane was reprobed with 1 µg/mL of anti-integrin β2 rabbit antibody and with a 1:1,000 dilution of anti-GFP rabbit antibody in TBS-T containing 3% BSA and 0.2% nonfat dry milk. After incubation with rabbit IgG, the immunoblots were developed again. These immunoprecipitation analyses were performed in triplicate. In some cases, the membrane was reprobed with 1 µg/mL of anti-EphA2 rabbit antibody (Santa Cruz; sc-924).
Statistical analysis
Statistical analyses were performed with the statistical software package, Statcel 2 (OMS Publishing Inc., Tokorozawa, Japan). The histograms represent the mean ± SD. Unpaired t tests were used to determine the statistical significance of the results.
Disclosure of Potential Conflicts of Interest
No potential conflicts of interest were disclosed.
Funding
This work was supported by a Grant-in-Aid for Scientific Research from the Japan Society for the Promotion of Science (to K.O.; no. 24580429, 15K07769) and a Grant-in-Aid for Research Fellowships of Japan Society for the Promotion of Science for Young Scientists (to N.S.; no. 26-12377).
References
- 1.Nourshargh S, Alon R. Leukocyte migration into inflamed tissues. Immunity 2014; 41:694-707; PMID:25517612; http://dx.doi.org/ 10.1016/j.immuni.2014.10.008. [DOI] [PubMed] [Google Scholar]
- 2.Heemskerk N, van Rijssel J, van Buul JD. Rho-GTPase signaling in leukocyte extravasation: an endothelial point of view. Cell Adh Migr 2014; 8:67-75; PMID:24621576; http://dx.doi.org/ 10.4161/cam.28244. [DOI] [PMC free article] [PubMed] [Google Scholar]
- 3.Kamei M, Carman CV. New observations on the trafficking and diapedesis of monocytes. Curr Opin Hematol 2010; 17:43-52; PMID:19996887; http://dx.doi.org/ 10.1097/MOH.0b013e3283333949. [DOI] [PubMed] [Google Scholar]
- 4.Luo BH, Carman CV, Springer TA. Structural basis of integrin regulation and signaling. Annu Rev Immunol 2007; 25:619-47; PMID:17201681; http://dx.doi.org/ 10.1146/annurev.immunol.25.022106.141618. [DOI] [PMC free article] [PubMed] [Google Scholar]
- 5.Takada Y, Ye X, Simon S. The integrins. Genome Biol 2007; 8:215; PMID:17543136; http://dx.doi.org/ 10.1186/gb-2007-8-5-215. [DOI] [PMC free article] [PubMed] [Google Scholar]
- 6.Evans R, Patzak I, Svensson L, De Filippo K, Jones K, McDowall A, Hogg N. Integrins in immunity. J Cell Sci 2009; 122:215-25; PMID:19118214; http://dx.doi.org/ 10.1242/jcs.019117. [DOI] [PubMed] [Google Scholar]
- 7.Hogg N, Patzak I, Willenbrock F. The insider's guide to leukocyte integrin signalling and function. Nat Rev Immunol 2011; 11:416-26; PMID:21597477; http://dx.doi.org/ 10.1038/nri2986. [DOI] [PubMed] [Google Scholar]
- 8.Ley K, Laudanna C, Cybulsky MI, Nourshargh S. Getting to the site of inflammation: the leukocyte adhesion cascade updated. Nat Rev Immunol 2007; 7:678-89; PMID:17717539; http://dx.doi.org/ 10.1038/nri2156. [DOI] [PubMed] [Google Scholar]
- 9.Pasquale EB. Eph-ephrin bidirectional signaling in physiology and disease. Cell 2008; 133:38-52; PMID:18394988; http://dx.doi.org/ 10.1016/j.cell.2008.03.011. [DOI] [PubMed] [Google Scholar]
- 10.Pasquale EB. Eph receptor signalling casts a wide net on cell behaviour. Nat Rev Mol Cell Biol 2005; 6:462-75; PMID:15928710; http://dx.doi.org/ 10.1038/nrm1662. [DOI] [PubMed] [Google Scholar]
- 11.Pasquale EB. Eph receptors and ephrins in cancer: bidirectional signalling and beyond. Nat Rev Cancer 2010; 10:165-80; PMID:20179713; http://dx.doi.org/ 10.1038/nrc2806. [DOI] [PMC free article] [PubMed] [Google Scholar]
- 12.Gucciardo E, Sugiyama N, Lehti K. Eph- and ephrin-dependent mechanisms in tumor and stem cell dynamics. Cell Mol Life Sci 2014; 71:3685-710; PMID:24794629; http://dx.doi.org/ 10.1007/s00018-014-1633-0. [DOI] [PMC free article] [PubMed] [Google Scholar]
- 13.Kullander K, Klein R. Mechanisms and functions of Eph and ephrin signalling. Nat Rev Mol Cell Biol 2002; 3:475-86; PMID:12094214; http://dx.doi.org/ 10.1038/nrm856. [DOI] [PubMed] [Google Scholar]
- 14.Sharfe N, Nikolic M, Cimpeon L, Van De Kratts A, Freywald A, Roifman CM. EphA and ephrin-A proteins regulate integrin-mediated T lymphocyte interactions. Mol Immunol 2008; 45:1208-20; PMID:17980912; http://dx.doi.org/ 10.1016/j.molimm.2007.09.019. [DOI] [PubMed] [Google Scholar]
- 15.Trinidad EM, Ballesteros M, Zuloaga J, Zapata A, Alonso-Colmenar LM. An impaired transendothelial migration potential of chronic lymphocytic leukemia (CLL) cells can be linked to ephrin-A4 expression. Blood 2009; 114:5081-90; PMID:19828693; http://dx.doi.org/ 10.1182/blood-2009-03-210617. [DOI] [PubMed] [Google Scholar]
- 16.de Saint-Vis B, Bouchet C, Gautier G, Valladeau J, Caux C, Garrone P. Human dendritic cells express neuronal Eph receptor tyrosine kinases: role of EphA2 in regulating adhesion to fibronectin. Blood 2003; 102:4431-40; PMID:12907451; http://dx.doi.org/ 10.1182/blood-2003-02-0500. [DOI] [PubMed] [Google Scholar]
- 17.Prevost N, Woulfe DS, Jiang H, Stalker TJ, Marchese P, Ruggeri ZM, Brass LF. Eph kinases and ephrins support thrombus growth and stability by regulating integrin outside-in signaling in platelets. Proc Natl Acad Sci U S A 2005; 102:9820-5; PMID:15994237; http://dx.doi.org/ 10.1073/pnas.0404065102. [DOI] [PMC free article] [PubMed] [Google Scholar]
- 18.Miao H, Burnett E, Kinch M, Simon E, Wang B. Activation of EphA2 kinase suppresses integrin function and causes focal-adhesion-kinase dephosphorylation. Nat Cell Biol 2000; 2:62-9; PMID:10655584; http://dx.doi.org/ 10.1038/35000008. [DOI] [PubMed] [Google Scholar]
- 19.Gu C, Park S. The EphA8 receptor regulates integrin activity through p110gamma phosphatidylinositol-3 kinase in a tyrosine kinase activity-independent manner. Mol Cell Biol 2001; 21:4579-97; PMID:11416136; http://dx.doi.org/ 10.1128/MCB.21.14.4579-4597.2001. [DOI] [PMC free article] [PubMed] [Google Scholar]
- 20.Bocharov EV, Mayzel ML, Volynsky PE, Mineev KS, Tkach EN, Ermolyuk YS, Schulga AA, Efremov RG, Arseniev AS. Left-handed dimer of EphA2 transmembrane domain: Helix packing diversity among receptor tyrosine kinases. Biophys J 2010; 98:881-9; PMID:20197042; http://dx.doi.org/ 10.1016/j.bpj.2009.11.008. [DOI] [PMC free article] [PubMed] [Google Scholar]
- 21.Matsuoka H, Obama H, Kelly ML, Matsui T, Nakamoto M. Biphasic functions of the kinase-defective Ephb6 receptor in cell adhesion and migration. J Biol Chem 2005; 280:29355-63; PMID:15955811; http://dx.doi.org/ 10.1074/jbc.M500010200. [DOI] [PubMed] [Google Scholar]
- 22.Pandey A, Shao H, Marks RM, Polverini PJ, Dixit VM. Role of B61, the ligand for the Eck receptor tyrosine kinase, in TNF-α-induced angiogenesis. Science 1995; 268:567-9; PMID:7536959; http://dx.doi.org/ 10.1126/science.7536959. [DOI] [PubMed] [Google Scholar]
- 23.Coulthard MG, Morgan M, Woodruff TM, Arumugam TV, Taylor SM, Carpenter TC, Lackmann M, Boyd AW. Eph/Ephrin signaling in injury and inflammation. Am J Pathol 2012; 181:1493-503; PMID:23021982; http://dx.doi.org/ 10.1016/j.ajpath.2012.06.043. [DOI] [PubMed] [Google Scholar]
- 24.Boyd AW, Bartlett PF, Lackmann M. Therapeutic targeting of EPH receptors and their ligands. Nat Rev Drug Discov 2014; 13:39-62; PMID:24378802; http://dx.doi.org/ 10.1038/nrd4175. [DOI] [PubMed] [Google Scholar]
- 25.Ogawa K, Pasqualini R, Lindberg RA, Kain R, Freeman AL, Pasquale EB. The ephrin-A1 ligand and its receptor, EphA2, are expressed during tumor neovascularization. Oncogene 2000; 19:6043-52; PMID:11146556; http://dx.doi.org/ 10.1038/sj.onc.1204004. [DOI] [PubMed] [Google Scholar]
- 26.Ogawa K, Saeki N, Igura Y, Hayashi Y. Complementary expression and repulsive signaling suggest that EphB2 and ephrin-B1 are possibly involved in epithelial boundary formation at the squamocolumnar junction in the rodent stomach. Histochem Cell Biol 2013; 140:659-75; PMID:23881165; http://dx.doi.org/ 10.1007/s00418-013-1129-2. [DOI] [PubMed] [Google Scholar]