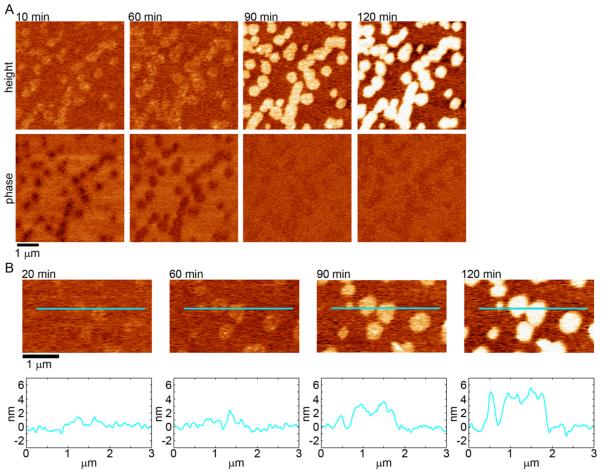
Figure 4.
(A) Sequential AFM height and phase images taken in solution of supported TBLE bilayers containing 10% exogenously added cholesterol exposed to htt-exon1(51Q). (B) AFM height images taken as a function of time demonstrating the smooth morphological changes induced in a TBLE + 10% cholesterol bilayer by htt-exon1(51Q). Blue lines correspond to the height profile presented directly below the images.

