
Figure 5. Tandem MS data for the five proteoforms of interest.
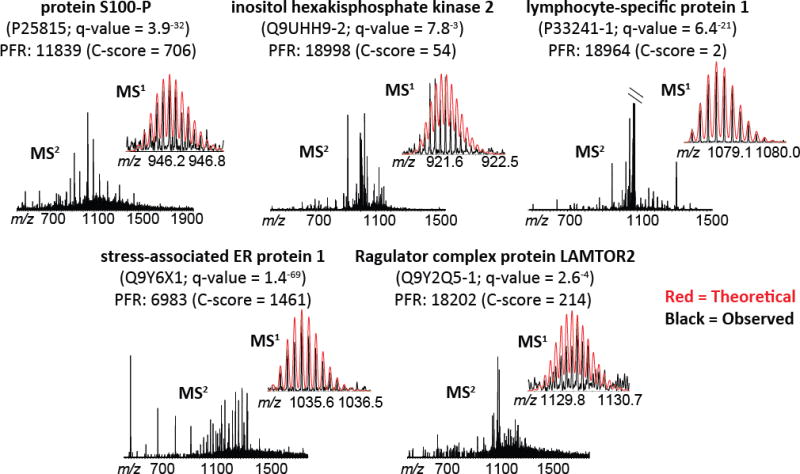
Raw spectra are shown, with theoretical MS1 overlaid for comparison (theoretical = red; observed = black). Protein descriptions and the proteoform record (PFR) number are included for each set of spectra, along with the UniProt Accession number, q-value for identification, and C-score for characterization. In the case of lymphocyte-specific protein 1 (PFRI: 18964; upper right), the MS2 spectrum was cropped to 6% of the base peak to show fragment ions; the base peak is unfragmented precursor. Refer to Table S4 for the quality metrics for identification and characterization associated with these spectra. mMass open source software [26–28] was used for modeling theoretical isotopic distributions and comparing to observed data.