Abstract
We reported c-Myc induction drives cholestatic liver injury and cholangiocarcinoma (CCA) in mice. We also showed induction of Maf proteins (MafG and c-Maf) contributed to cholestatic liver injury, whereas S-adenosylmethionine (SAMe) administration was protective. Here we determined whether there is interplay between c-Myc, Maf proteins and methionine adenosyltransferase α1 (MATα1), which is responsible for SAMe biosynthesis in liver. We used bile duct ligation (BDL) and lithocholic acid (LCA) treatment in mice as chronic cholestasis models, a murine CCA model, human CCA cell lines KMCH and Huh-28, human liver cancer HepG2, and human CCA specimens to study gene and protein expression, protein-protein interactions, molecular mechanisms and functional outcomes. We found c-Myc, MATα1 (encoded by MAT1A), MafG and c-Maf interact with each other directly. MAT1A expression fell in hepatocytes and bile duct epithelial cells during chronic cholestasis and in murine and human CCA. The opposite occurred with c-Myc, MafG and c-Maf expression. MATα1 interacts mainly with Mnt in normal liver but this switches to c-Maf, MafG and c-Myc in cholestatic livers and CCA. Promoter regions of these genes have E-boxes that are bound by MATα1 and Mnt in normal liver and benign bile duct epithelial cells that switched to c-Myc, c-Maf and MafG in cholestasis and CCA cells. E-box positively regulates c-Myc, MafG and c-Maf, but it negatively regulates MAT1A. MATα1 represses whereas c-Myc, MafG and c-Maf enhance E-box-driven promoter activity. Knocking down MAT1A or overexpressing MafG or c-Maf enhanced CCA growth and invasion in vivo.
Conclusion
We have uncovered a novel interplay between MATα1, c-Myc and Maf proteins and their deregulation during chronic cholestasis may facilitate CCA oncogenesis.
Keywords: Bile duct ligation, E-box, lithocholic acid, murine cholangiocarcinoma model
Cholangiocarcinoma (CCA) is highly malignant and the second most common primary hepatic tumors with rapidly increasing incidence (1). Well-recognized risk factors include primary sclerosing cholangitis, bile duct stones, biliary cysts and biliary infection with parasites such as Clonorchis sinensis (1). Common to these risk factors is the setting of chronic inflammation and cholestasis, which have been closely linked to development of CCA. We showed c-Myc induction plays a key role in cholestatic liver injury (2) and in CCA progression in a murine model of cholestasis-associated CCA (3). We have also shown induction of two Maf proteins, MafG and c-Maf, to play an important role in lowering glutathione (GSH) level and contributing to cholestatic liver injury due to bile duct ligation (BDL) in mice (4). Maf proteins are AP-1 family members and derive their name from the founder member, v-Maf, transduced in a retrovirus that induces musculoaponeurotic fibrosarcoma in chickens (5,6). There are seven Maf proteins, divided into large (Maf, MafB, MafA, and Nrl) and small (MafG, MafK, MafF) Mafs (5). Small Mafs lack a transcriptional activation domain and can form homodimers to repress anti-oxidant response element (ARE) (7). Small Mafs can also form heterodimers with different proteins, which can either activate (heterodimer with Nrf2) or repress (heterodimer with c-Maf) ARE (7). While small Mafs are known to be important in antioxidant defense through their regulation of the ARE-dependent gene expression, they have not been reported to be involved in oncogenesis (4,5).
Chronic cholestasis has also been reported to lower hepatic S-adenosylmethionine (SAMe) levels (8) and SAMe in turn has been found to protect against cholestatic liver injury in experimental models and in patients with cholestasis of pregnancy (4,9). SAMe is the principle biological methyl donor that is synthesized by methionine adenosyltransferase (MAT), which is encoded by two genes in mammals, MAT1A and MAT2A (9). MAT1A encodes for MATα1, which forms dimers and tetramers that are largely expressed in normal hepatocytes. Hepatic MAT activity falls in patients with chronic liver disease, as MAT1A expression falls and MAT1A-encoded isoenzymes are inactivated by elevated levels of hydroxyl radicals and nitric oxide (9). MAT1A expression is also markedly reduced in patients with hepatocellular carcinoma (HCC) and re-activation of MAT1A reduced HCC tumor growth and metastasis (10). Interestingly we found that SAMe level regulates c-Myc expression in liver and hepatocytes (11). Low SAMe level due to loss of MATα1 leads to marked c-Myc induction at the mRNA level, although the mechanism is unknown (11). Despite the importance of MAT1A in liver pathology, changes in its expression and functionality in chronic cholestasis are largely unknown.
The aim of our current work was to examine whether there is any crosstalk between c-Myc, Maf proteins and MATα1 and in the course of our study we have uncovered a previously unreported interplay amongst these proteins that not only contribute to cholestatic liver injury, but may also facilitate development of CCA.
EXPERIMENTAL PROCEDURES
Materials and reagents
γ-32P ATP (3,000 Ci/mmol) and α-32P dCTP (6,000 Ci/mmol) were purchased from PerkinElmer (Boston, MA). Antibodies used for either Western and/or immunohistochemistry to MATα1, c-Myc, MafG, c-Maf, β-actin and IgG were purchased from Abcam (Cambridge, MA). Lipofectamine 2000 and RNAi-max were purchased from Invitrogen (Carlsbad, CA). siRNAs to c-Myc (5’-CGAUUCCUUCUAACAGAAtt-3’), MafG (5’-CGGACUAGAGAGAGUUGCGtt-3’), c-Maf (5’-GCAUCGUGUACUUACCAGUtt-3’) and MAT1A (5’-GCACAACGAAGACAUCACGtt-3’) were purchased from Ambion (Grand Island, NY). DNA methylation inhibitor 5-aza-2’-deoxycytidine was purchased from Sigma-Aldrich (St. Louis, MO). 3-Deazaneplanocin A hydrochloride was purchased from TOCRIS (Bristol, UK).
Source of normal and human CCA specimens
Five normal liver and five CCA specimens were obtained from Xiangya Hospital Central South University (Changsha, Hunan province, China). After giving written consent, paraffin embedded liver tissues were obtained. The study protocol conformed to the ethical guidelines of the 1975 Declaration of Helsinki as reflected in a priori approval by the Medical Ethical Committee of Xiangya Hospital Central South University and the Keck School of Medicine’s human research review committee.
Archived fresh-frozen CCA and adjacent benign tissue samples obtained from patients undergoing surgical liver resection under protocols approved by the Institutional Review Boards of the Mayo Clinic, Rochester, MN were accessed and provided as de-identified samples for the present study. Both tumor (n=13) and normal (n=7) tissue were evaluated histologically to confirm presence or absence of neoplasm. These samples were used to measure MAT1A mRNA level (see below).
BDL, lithocholic acid (LCA) treatment in mice and murine CCA model
Two to three-month old male C57BL/6 mice were fed chow ad libitum, and housed at constant temperature (22°C) with alternating 12 hours of light and darkness. BDL and sham surgery were performed as we described (12). LCA treatment was given by oral gavage daily (200mg/kg) as we described (13). Mice were sacrificed on indicated days post surgery or treatment and livers were harvested for studies described below. All procedure protocols, use, and the care of the animals were reviewed and approved by the Institutional Animal Care and Use Committee at the Keck School of Medicine and at Cedars-Sinai Medical Center (Los Angeles, CA).
Murine cholestasis-associated CCA model was previously described (3). CCA specimens from our previous study were used for RNA, protein extraction, immunohistochemistry (IHC) and chromatin immunoprecipitation (ChIP).
Cell lines and transfection
Human CCA KMCH (14) and Huh-28 (15), and HCC HepG2 cell lines were cultured in DMEM supplemented with 10% fetal bovine serum, 100 U/mL penicillin, 0.1 mg/mL streptomycin, and 2 mmol/L L-glutamine. H69 cells, SV40 transformed normal human biliary epithelial cells, were cultured as described previously (16). Transient and stable transfections are described in SUPPLEMENTAL METHODS.
Promoter constructs and luciferase assay
MAT1A promoter (−839 to +30) was described previously (17), c-Myc promoter was purchased from Addgene (Cambridge, MA), MafG and c-Maf promoters were purchased from GeneCopoeia. The wild type E-box-luc consisted of 3-repeat sequences: 5’-CCTGTTCTCACGTGCTCACA-3’, (−155 to −175 relative to ATG start site of the human MAT1A promoter), and core motif of E-box CACGTG was changed to CTCGTC for E-box mutant. The various promoter constructs, and a control Renilla luciferase expression vector (2.5 ug) were co-transfected into KMCH or H69 cells with Lipofectamine 2000 (Invitrogen) following the manufacturer’s instructions. Luciferase assays were performed 24 hours later using the Dual Luciferase Reporter Assay System (Promega, Madison, WI) as directed by the manufacturer suggested protocol. Firefly luciferase activity was normalized to the Renilla luciferase activity.
Orthotopic metastatic CCA model
Orthotopic metastatic CCA model employed injection of KMCH cells (5 × 10⁶ cells/100 μl in Hank’s solution) into the left hepatic lobe of 4-week-old male BALB/c nude mice (The Jackson Laboratories Inc., Bar Harbor, ME). Mice were divided equally into 10 groups (n=8 per group) and given the following KMCH stable cell line injection: group 1, empty vector; group 2, MATα1 overexpression; group 3, c-Maf overexpression; group 4, MafG overexpression; group 5, c-Myc overexpression; group 6, CRISPR scrambled; Group 7, CRISPR MAT1A; group 8, CRISPR MafG; group 9, CRISPR c-Maf; group 10, CRISPR c-Myc. Animals were sacrificed at day 65. Tumor size was measured by calipers and tumor volume was calculated according to the formula: π/6 (length × width2). Parts of the tumor tissues were used for RNA and protein analysis, the rest were fixed in 4% formalin for histology and IHC.
Histology and IHC
Formalin-fixed liver and CCA tissues embedded in paraffin were cut and stained with hematoxylin and eosin (H&E) for routine histology. Immunohistochemical staining of Matα1, c-Myc, MafG, c-Maf and IgG (Abcam, Cambridge, MA) was performed with Dako kit (Carpinteria, CA) or Abcam according to the manufacturer’s method. For quantifying immunohistochemical staining, a total of five fields at 100× magnification were randomly selected (minimum of 1000 cells total) and positive nuclei or cells were counted and expressed as a percentage of the total using the MetaMorph imaging software (Woburn, MA). Control with normal mouse IgG showed no staining.
RNA isolation and gene expression analysis
RNA isolation and real-time PCR were performed as described in SUPPLEMENTAL METHODS.
Southern blot analysis
DNA from murine CCA and normal liver were extracted, and digested by MspI, HpaII, BgIII and NdeI. Southern blot was done as described previously (10).
Western blot and Co-immunoprecipitation (Co-IP) analysis
Please see SUPPLEMENTAL METHODS for details.
ChIP and Sequential-ChIP (Seq-ChIP) assay
ChIP and Seq-ChIP were done to examine changes in protein binding to the E-box region of the mouse Mat1a, c-Myc, MafG and c-Maf promoters and the human MAT1A promoter in an endogenous chromatin configuration using the manufacturer’s suggested protocol from the Pierce agarose ChIP kit (Thermo Scientific, Rockford, IL). Please see SUPPLEMENTAL METHODS for more details.
IP and proteomics assays by mass spectrometry (MS)
LCA treated livers (14 days), murine CCA and their respective control liver tissues were used for IP followed by MS. Please see SUPPLEMENTAL METHODS for details. MS assays were described previously (18).
Direct protein-protein interaction
Recombinant human MATα1, Max and MafG proteins were from Prospec (East Brunswick, NJ), and recombinant human c-Myc and c-Maf were from Mybiosource (San Diego, CA). 2 μg of MATα1 or c-Myc protein was immobilized to agarose beads by their respective antibody (Abcam). After washing, beads were mixed with 1 μg Max, c-Myc, c-Maf or MafG protein and rotated for 4 hours at 4°C. Beads were then washed 6 times, boiled in SDS sample buffer and proteins separated on SDS-PAGE.
3-Deazaneplanocin A hydrochloride and 5-aza-2’-deoxycytidine treatment
KMCH cells were treated with 1 μM of 3-deazaneplanocin A hydrochloride (DZNep) or 5-aza-2’-deoxycytidine for 2 days followed by transfection with MAT1A overexpression vector or empty vector for 1 day. The culture medium was changed every day for both control and treated cells, to maintain the drug stability during DZNep or 5-aza-2’-deoxycytidine treatment.
5-Bromo-2′-deoxyuridine (BrdU) incorporation
BrdU incorporation was measured with BrdU Detection Kit according to the manufacturer’s protocol (BD Biosciences, Pharmingen, San Jose, CA).
Statistical Analysis
Data are given as mean ± standard error of the mean (SEM). Statistical analysis was performed using analysis of variance followed by Fisher’s test for multiple comparisons. Significance was defined as p<0.05.
RESULTS
Expression of Mat1a in cholestatic liver injury in mice
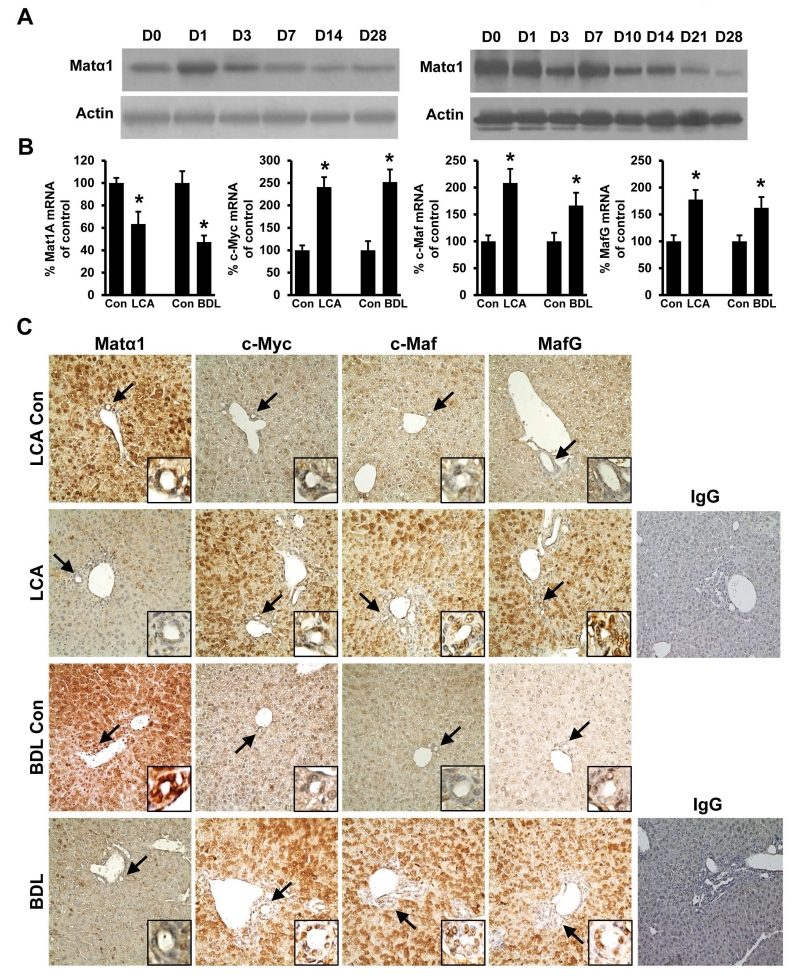
We first determined expression of Mat1a using two murine models of cholestasis, BDL and treatment with LCA. We found although there is a transient increase in Mat1a expression after BDL, its expression fell to about 50% of baseline by two weeks after either BDL or LCA treatment (Fig. 1A). Both mRNA and protein levels of Mat1a fell comparably (Fig. 1B, left panel), suggesting the mechanism lies at the pre-translational level. IHC showed that interestingly Matα1 is strongly expressed in bile duct epithelial cells in the control normal liver and this was markedly diminished after 14 days of either BDL or LCA treatment (Fig. 1C). We had previously reported that c-Myc, MafG and c-Maf are all induced in cholestatic livers (4,12) and IHC shows that while their expression is low in normal control livers, they are markedly up-regulated in both hepatocytes and biliary epithelial cells in chronic cholestasis (Fig. 1C). The mRNA levels of c-Myc, c-Maf and MafG were all increased, suggesting the mechanism also lies at the pre-translational level (Fig. 1B).
Figure 1. Matα1, c-Myc, c-Maf and MafG expression in mouse cholestatic liver injury.
(A) Western blot analysis of Matα1 in LCA treated (left) and BDL (right) mice livers from day 0 (Con) to day 28 (D28). Representative blots from six mice per condition are shown. (B) mRNA levels of Mat1a, c-Myc, c-Maf, and MafG in LCA- or BDL- treated mice day 14 livers. Results are expressed as mean ± SEM % of Con from at least six mice per condition, *p < 0.05 versus Day 0 (Con). LCA, lithocholic acid; BDL, bile duct ligation. (C) Immunohistochemistry (IHC) of Matα1, c-Myc, c-Maf, MafG and isotype control using IgG in livers in LCA- and BDL- treated mice at day 14. Arrows point to the small bile duct (insets at the bottom right of each IHC image). Original magnification, ×200. Representative IHCs from n=6 for each condition are shown.
Matα1 interacts with c-Myc, Mnt, Max, MafG and c-Maf
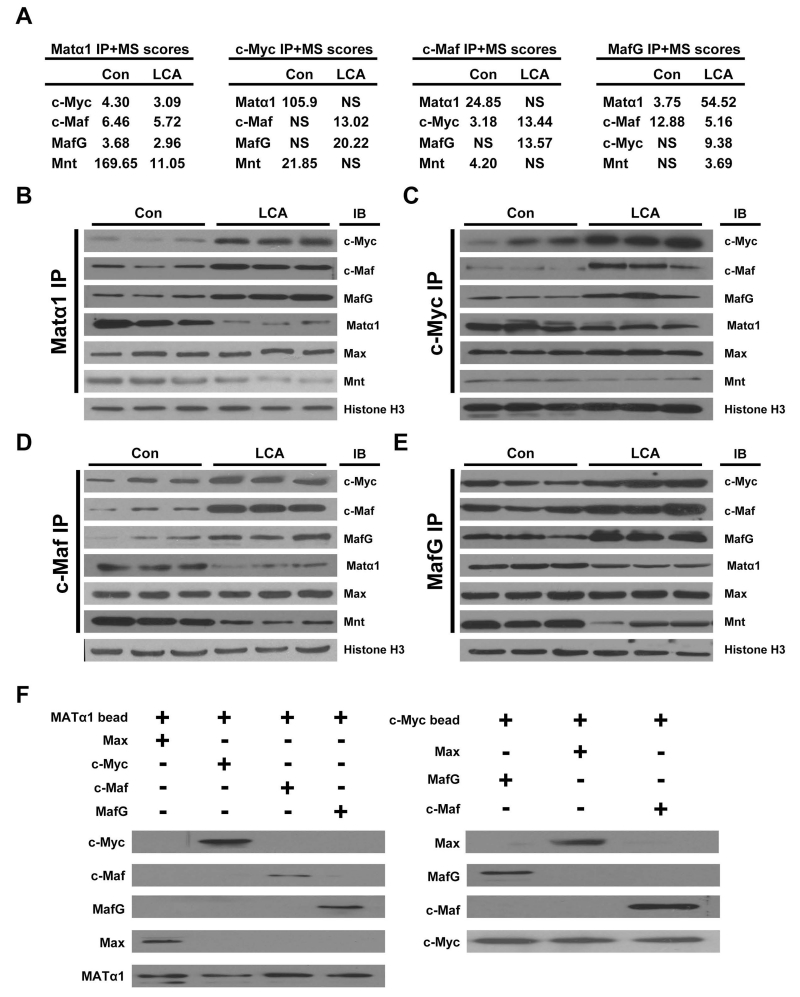
We next examined whether chronic cholestasis might affect interactions of Matα1 with other proteins. Liver protein lysates from control and 14-day LCA treated livers were subjected to IP using anti-Matα1 antibody, followed by proteomics. Using this unbiased strategy, we found Matα1 interacts with c-Myc, Mnt, Max, MafG and c-Maf (Fig. 2A and 2B). In normal control liver nuclei, Matα1 mainly interacts with Mnt but this interaction is reduced in cholestasis while interaction with c-Myc, c-Maf and MafG increased (Fig. 2B). Interaction with Max remained unaltered by cholestasis. Essentially the same findings were observed when we used anti-c-Myc, anti-c-Maf, and anti-MafG antibodies for the initial IP followed by proteomics. In control liver nuclei, c-Myc, MafG and c-Maf interact more with Matα1 and Mnt but in cholestatic livers, they interact more with each other and much less with Matα1 and Mnt (Fig. 2C-E). To see if interactions amongst these proteins are direct, MATα1 was immobilized to beads and pull-down assay using recombinant proteins showed MATα1 directly interacts with Max, c-Myc, c-Maf and MafG (Fig. 2F, left). Using a similar strategy, immobilized c-Myc directly interacts with Max, MafG and c-Maf (Fig. 2F, right).
Figure 2. Interactions of Matα1 with c-Myc, Mnt, Max, MafG and c-Maf.
(A) The liver protein lysates from control and 14-day LCA treated livers were subjected to IP using anti-Matα1, anti-c-Myc, anti-c-Maf and MafG, followed by mass spectrometry. The table shows a small subset of scores representing potential interacting proteins of interest. NS=no score. The liver protein lysates from control and 14-day LCA were immunoprecipitated (IP) with either antibodies to (B) Matα1, (C) c-Myc, (D) c-Maf, or (E) MafG and then subjected to Western blotting (IB) for Matα1, c-Myc, c-Maf, Maf, Mnt and Max. Histone H3 served as loading control. (F) In vitro pull down assay using immobilized Matα1 (left) or c-Myc (right). Matα1 directly interact with c-Myc, Max, Maf and MafG (left), and c-Myc directly interact with Max, Maf and MafG (right). Results represent a total of at least 3 independent experiments done in duplicate.
Matα1, c-Myc, MafG and c-Maf expression and interactions in CCA
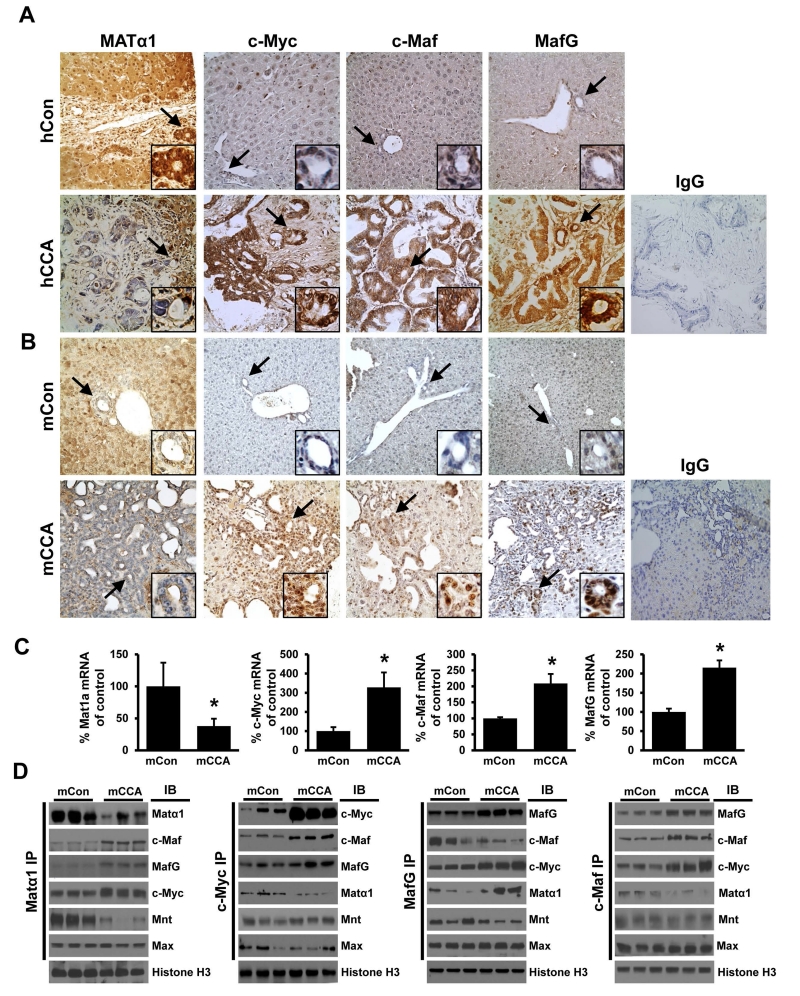
Intrigued by the interactions amongst these proteins and their expression changes in cholestasis, we next examined their protein expression in murine and human CCA samples. Similar to mouse, normal human liver expresses high levels of MATα1 in hepatocytes and bile duct epithelial cells but c-Myc, MafG and c-Maf are expressed at low levels (Fig. 3A). This is reversed in CCA, particularly in the cancerous ductal epithelial cells (Fig. 3A). Similar findings were observed in the murine CCA model and these changes in expression occurred in both mRNA and protein levels (Fig. 3B and 3C). Decreased MAT1A mRNA levels were also confirmed in human CCA as compared to benign adjacent tissues (See Supplemental Fig. 1). Using IP followed by proteomics, we found the same changes in protein-protein interactions in murine CCA as in chronic cholestasis, with reduced interactions between c-Myc, MafG and c-Maf with Matα1 and Mnt and increased interactions with each other (supplemental Fig. 2). This was also confirmed using co-IP followed by Western blotting (Fig. 3D).
Figure 3. Matα1, c-Myc, MafG and c-Maf expression and interactions in CCA.
Immunohistochemical analysis of Matα1, c-Myc, MafG and c-Maf in paraffin-embedded livers from the (A) human normal liver control (hCon, top row) and human CCA (hCCA, bottom row) and (B) mouse normal liver control (mCon, top row) and mouse CCA (mCCA, bottom row). Isotype controls using IgG are also shown. Arrows point to the small bile duct (insets at the bottom right of each IHC image). Original magnification, X200. (C) mRNA levels of Mat1a, c-Myc, c-Maf, and MafG in livers of control- or CCA-mice at week 28. Results are expressed as mean ± SEM % of mCon from at least six mice per condition, *p < 0.05 versus mCon. (D) Immunoprecipitation (IP) of nuclear extracts of the mCon and mCCA samples with Matα1, c-Myc, c-Maf, and MafG, followed by Western blots (IB) analysis for the Mnt, Max and the same proteins above. Histone H3 was used as a loading control.
MATα1, MafG and c-Maf bind to E-box and modulate E-box-driven promoter activity
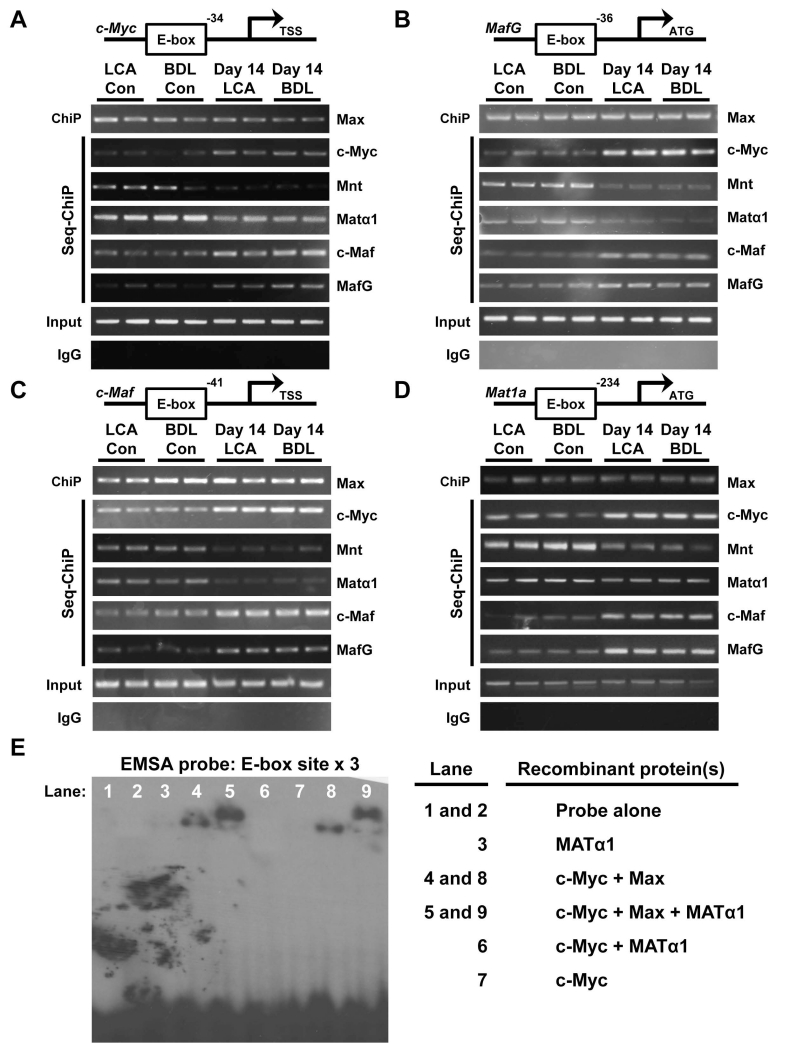
E-box sequences are present in the murine promoter regions of c-Myc (Fig. 4A), MafG (Fig. 4B), c-Maf (Fig. 4C) and Mat1a (Fig. 4D). ChIP and Seq-ChIP revealed that in normal liver, the E-box region in all four promoters is occupied by Matα1 and Mnt but in cholestatic livers this is switched to c-Myc, MafG and c-Maf (Fig. 4A-D). Max binding remained unchanged.
Figure 4. Matα1, c-Myc, c-Maf and MafG binding dynamics to the E-box region of these same gene promoters.
Whole cell extracts of 14 day LCA and BDL treated livers and their respective controls were subjected to ChIP analysis with Max followed by Seq-ChIP with c-Myc, Mnt, MafG, c-Maf or Matα1 spanning the E-box containing mouse promoter regions of (A) c-Myc, (B) MafG, (C) c-Maf, and (D) Mat1a. (E) EMSA analysis of a multimerized human MAT1A E-box element (X3) using recombinant MATα1, c-Myc and Max proteins. Results represent a total of at least 3 independent experiments done in duplicate.
E-box is also present in the human MAT1A promoter region. In non-malignant H69 cells the dominant proteins bound are Max, MATα1 and Mnt but in malignant CCA Hu28 and KMCH cells as well as liver cancer cell line HepG2, the E-box region is mostly co-occupied by c-Myc, while Mnt and MATα1 co-occupancy is decreased. MafG and c-Maf co-occupancy is higher in the two CCA lines as compared to H69 cells (Supplemental Fig. 3). MAT1A mRNA levels in H69 cells are 2-fold higher than Hu28, KMCH and HepG2 cells (n=3 independent determinations, p<0.05 between H69 and the other three cell lines).
Using recombinant Matα1, c-Myc and Max in EMSA, we found Matα1 and c-Myc cannot bind to a consensus E-box by itself or together (Fig. 4E, lanes 3, 6, 7). c-Myc can bind if it is in a complex with Max but Matα1 requires both c-Myc and Max to bind to the E-box (Fig. 4E, note “supershift”). These findings prompted us to speculate whether these proteins all interact at the E-box but modulate E-box-driven promoter activity differently.
Reciprocal regulation between MAT1A and c-Myc/MafG/c-Maf
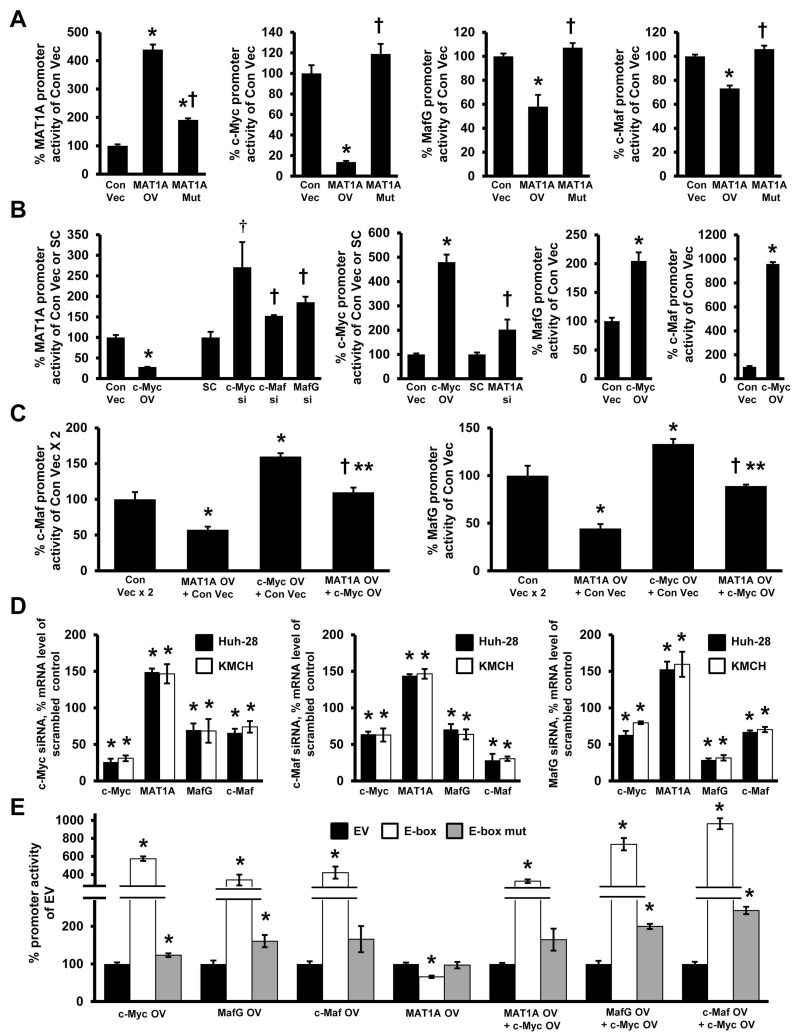
We used KMCH and Huh-28 cell lines for transient transfection analysis of MAT1A, c-Myc, MafG and c-Maf promoters as we varied the expression level of their encoded proteins. Overexpressing MATα1 increased MAT1A promoter activity by 310%, but reduced c-Myc promoter activity by 90% and MafG and c-Maf promoter activities by 30-40% (Fig. 5A). Overexpressing c-Myc, on the other hand, lowered MAT1A promoter activity by 75%, while increasing c-Myc, MafG and c-Maf promoter activities by 350%, 100%, and 800%, respectively (Fig. 5B). The inductive effect of c-Myc on MafG and c-Maf promoter activities was largely eliminated if MATα1 was co-expressed (Fig. 5C). Knockdown of c-Myc, MafG or c-Maf all raised MAT1A promoter activity (Fig. 5B, left panel), whereas knockdown of MAT1A raised c-Myc promoter activity (Fig. 5B, middle panel). We further verified that c-Myc, c-Maf and MafG positively regulate each other but negatively regulate MAT1A at the mRNA level (Fig. 5D). Finally, using a consensus E-box-driven luciferase reporter construct, overexpression of c-Myc, MafG and c-Maf all raised reporter activity whereas overexpressing MAT1A lowered the activity (Fig. 5E). Overexpressing both c-Myc and MAT1A reduced the inductive effect of c-Myc, whereas overexpressing both c-Myc and MafG or c-Myc and c-Maf further increased E-box driven reporter activity. However, overexpressing these proteins alone or together had minimal to no effects when the E-box sequence was mutated (Fig. 5E, note log scale).
Figure 5. Reciprocal regulation between MATα1 and c-Myc/MafG/c-Maf.
(A) Effect of overexpressing MATα1 and its mutant on the promoter activity of MAT1A, c-Myc, MafG, and c-Maf in the KMCH cell line. *p< 0.05 vs Con Vec. †p< 0.05 vs MAT1A overexpression (OV). (B) Effects of c-Myc overexpression or siRNA knockdown of c-Myc, Maf and MafG on MAT1A promoter activity (left panel) in KMCH cells. The effects of c-Myc overexpression or MAT1A knockdown on c-Myc promoter activity (middle panel) and c-Myc overexpression on c-Maf and MafG promoter activities (right panel). *p< 0.05 vs Con Vec. †p< 0.05 vs SC. (C) The effect of MATα1 and c-Myc overexpression alone or in combination on c-Maf (left panel) and MafG (right panel) promoters in KMCH cells. *p< 0.05 vs Con Vec. †p< 0.05 vs MAT1A OV. **p< 0.05 vs c-Myc OV. (D) Knockdown of c-Myc (left panel), c-Maf (middle panel) and MafG (right panel) on mRNA expression of MAT1A, c-Myc, c-Maf and MafG in KMCH and Huh-28 cells. *p< 0.05 vs SC (E) Promoter activity of a consensus E-box-driven luciferase reporter construct and its mutant after overexpression of c-Myc, c-Maf, MafG, or MATα1 expression alone or in combination with c-Myc in KMCH cells. *p< 0.05 vs EV. Results represent a total of at least 3 independent experiments done in duplicate.
To see whether MATα1’s positive auto-regulation is dependent on c-Myc, we examined the effect of overexpressing MAT1A in H69 cells, which express very low level of c-Myc. MAT1A overexpressed doubled the MAT1A promoter in H69 cells (Supplemental Fig. 4). We also found the same reciprocal regulation between MAT1A and c-Myc/Mafs occur in a liver cancer cell line (Supplemental Fig. 5).
Mechanism of MAT1A-mediated down-regulation of c-Myc, MafG and c-Maf expression
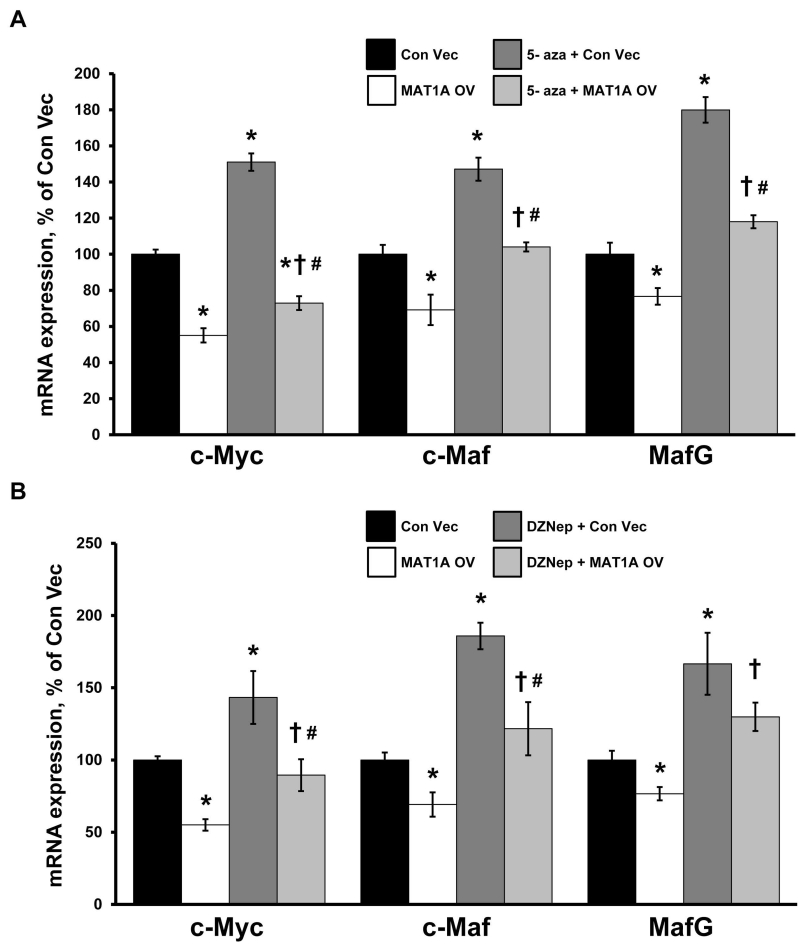
Since MAT1A encodes for the enzyme that catalyzes the biosynthesis of SAMe, which could affect gene expression by epigenetics, we compared the effect of overexpressing wild type versus a MATα1 mutant that cannot oligomerize and therefore is catalytically inactive (19). Overexpressing a MATα1 mutant had either no effect or blunted effect on these promoters (Fig. 5A). To see if the effect of MAT1A requires DNA methylation, we first treated cells with 5-aza-2’-deoxycytidine and examined the effect of MAT1A overexpression on the expression of c-Myc, MafG and c-Maf. Figure 6A shows inhibiting DNA methylation raised the expression of c-Myc, MafG, c-Maf and MAT1A (254±52% of control, p<0.05) but did not prevent MAT1A overexpression-mediated lowering of their mRNA levels. We also examined whether histone methylation may be involved by treating cells with 3-deazaneplanocin A hydrochloride, which inhibits Enhancer of Zeste Homolog 2 (EZH2), a histone-lysine N-methyltransferase that is primarily involved in methylating histone 3 lysine 27 (H3K27) leading to transcriptional repression (20). Similar to inhibiting DNA methylation, Figure 6B shows inhibiting EZH2 raised the expression of c-Myc, MafG, c-Maf and MAT1A (320±43% of control, p<0.05) but did not prevent MAT1A overexpression from lowering their mRNA levels.
Figure 6. 3-Deazaneplanocin A hydrochloride or 5-aza-2’-deoxycytidine treatment did not affect the ability of Matα1 to inhibit c-Myc, MafG and c-Maf expression.
KMCH cells were treated with either (A) 5-aza-2’-deoxycytidine (5-aza) or (B) 3-deazaneplanocin A hydrochloride (DZNep) for 48 hours, followed by transfection with MAT1A overexpression vector (OV) or empty control vector for another 24 hours in order to determine the effect on c-Myc, MafG and c-Maf expression. Results represent a total of at least 3 independent experiments done in duplicate. *p< 0.05 vs Con Vec. †p< 0.05 vs MAT1A OV. #p< 0.05 vs 5-aza or DZNep.
Effects of MATα1, MafG and c-Maf on CCA growth and in vivo tumorigenicity
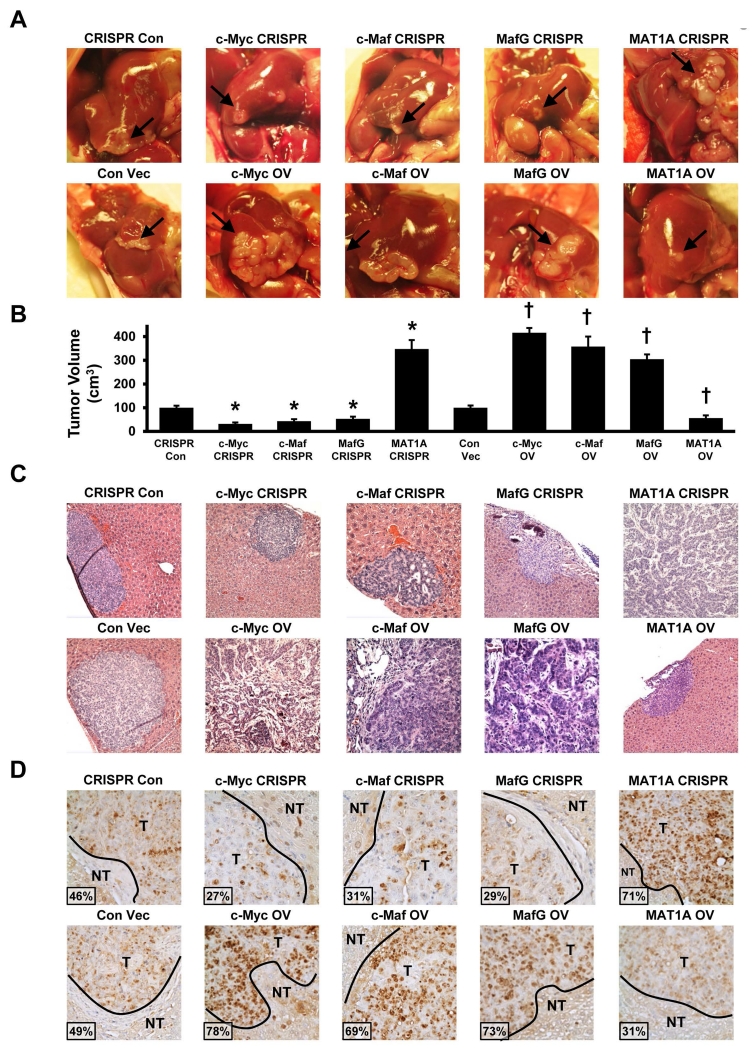
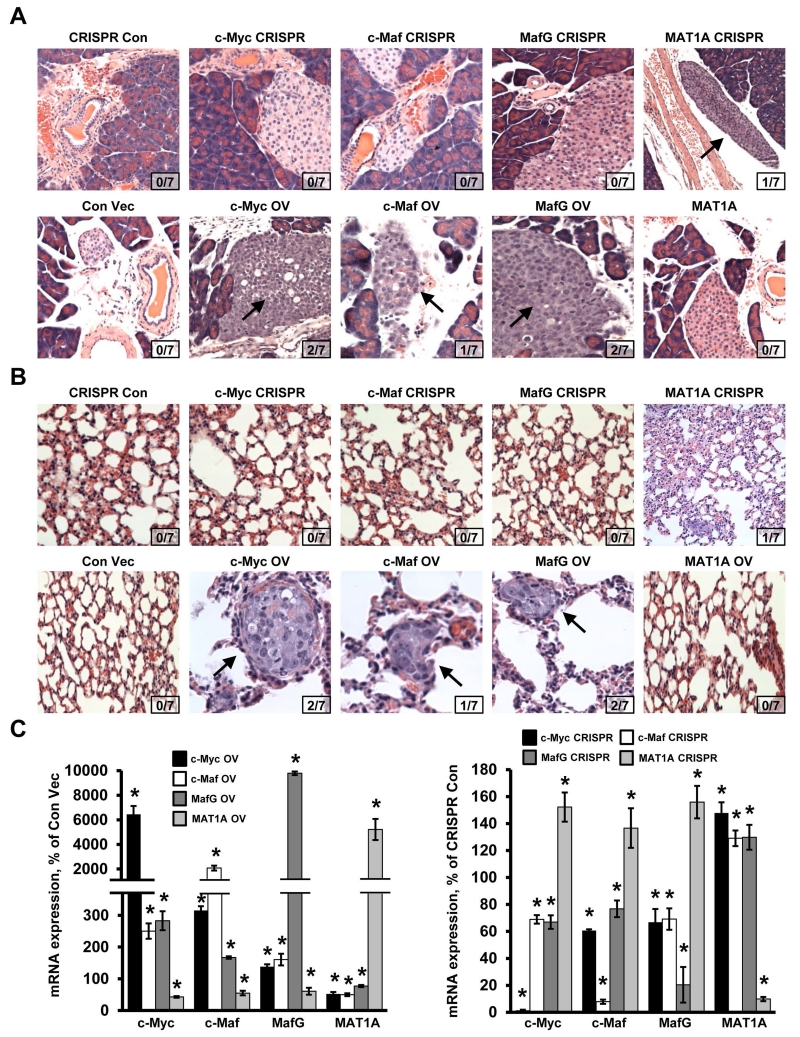
While c-Myc is a well-recognized oncogene important for the pathogenesis of CCA, the other three proteins have not been reported to be involved. We found that knocking down MafG, c-Maf, c-Myc or overexpressing MAT1A had similar inhibitory effects on cell growth in vitro (supplemental Fig. 6). To confirm their effects in vivo, we established CCA cell lines that either stably overexpress c-Myc, MafG, c-Maf or MAT1A or have reduced expression of these genes using CRISPR. These cells were implanted into the left lobe of the liver and their growth, invasion and metastasis were examined in this orthotopic model. Figure 7A shows the tumor at the site of injection after 65 days. CCA cells overexpressing c-Myc, c-Maf, MafG or CRISPR targeting MAT1A resulted in much larger tumor sizes as compared to respective controls. In contrast, CCA cells overexpressing MAT1A or CRISPR targeting c-Myc, c-Maf or MafG had much smaller tumor sizes (Fig. 7A, 7B). Fig. 7C shows the H&E of the tumors and the aggressive histologic features of the c-Myc, c-Maf and MafG overexpressing or the MAT1A knocked down CCAs. Consistently, PCNA staining is highest for tumors overexpressing c-Myc, c-Maf or MafG or tumors with MAT1A knockdown, and the opposite is true for tumors overexpressing MAT1A or with c-Myc, c-Maf or MafG knockdown (Fig. 7D). The more aggressive tumors invaded adjacent structure such as the pancreas (Fig. 8A) and metastasized to the lung (Fig. 8B). Reciprocal regulation of MAT1A with c-Myc/c-Maf/MafG was confirmed in vivo (Fig. 8C).
Figure 7. Effects of MATα1, MafG, c-Maf and c-Myc on CCA growth and in vivo tumorigenicity.
(A) Representative pictures of liver orthotopic tumors at day 65 following injection of cells containing stably transfected CRISPR knockdown (top row) and overexpression (bottom row) of either MATα1, MafG, c-Maf or c-Myc. Arrow points to the tumors on the liver (B) Tumor volume in left lobes containing either stably transfected CRISPR to c-Myc, c-Maf, MafG or MAT1A were measured at day 65 (*p < 0.05, vs. CRISPR con; n = 8) or stably transfected overexpression to c-Myc, c-Maf, MafG and MAT1A (†p < 0.05 vs. Con Vec; n = 8). (C) H&E staining and PCNA staining (D) of liver tissue with stably transfected CRISPR (top row) and overexpression (bottom row) of either MATα1, MafG, c-Maf or c-Myc. Original magnification, ×200. T = tumor, NT = non-tumor. Insets show % PCNA positive staining cells for each condition.
Figure 8. Effects of MATα1, MafG, c-Maf and c-Myc on CCA metastasis.
H&E staining of (A) pancreatic tissue and incidence of pancreatic metastasis and (B) lung tissue and incidence of lung metastasis. Arrows point to pancreatic or lung metastasis (top row, CRISPR; bottom row, overexpression of c-Myc, c-Maf, MafG, and Matα1). Insets show number of animals that had metastasis for each condition. (C) mRNA expression of c-Myc, c-Maf, MafG and MAT1A in the tumors with overexpression or CRISPR knockdown either c-Myc, c-Maf, MafG or MAT1A. Results represent a total of at least 3 independent experiments done in duplicate. *p< 0.05, vs. Con Vec or CRISPR Con.
Mat1a promoter is hypermethylated in CCA
In HCC, one of the mechanisms of MAT1A silencing is promoter methylation (9). To see if promoter methylation is altered in murine CCA, we performed Southern blotting after digesting DNA with methylation insensitive MspI or methylation sensitive HpaII. CCA samples have increased high molecular weight band and decreased low molecular weight bands after HpaII digestion, consistent with promoter hypermethylation (Supplemental Fig. 7).
DISCUSSION
CCA can arise from anywhere within the biliary tree and are classified based on their anatomic origin into intrahepatic, perihilar, and distal CCA (21). CCAs are heterogeneous and highly aggressive with a median survival of less than 24 months after diagnosis (21). Underlying risk factors share in common chronic inflammation and cholestasis. Recent advances have provided much insight on the molecular pathogenesis, which include pathways activated by chronic inflammation and high levels of bile acids (particularly conjugated bile acids), such as proinflammatory cytokine IL-6, inducible nitric oxide synthase, cyclooxygenase-2, which can work in concert to activate growth pathways and induce oxidative and nitrosative stress, resulting in DNA damage and triggering malignant transformation (21-23). More common genetic abnormalities noted in several studies include tumor protein 53 (TP53) and Kristen ras sarcoma viral oncogene homolog (KRAS) (21). Recently, increased WNT signaling in inflammatory macrophages was shown to drive CCA growth in rodent CCA models (24). In our current study we are introducing three new players, namely MATα1, MafG and c-Maf, which interact and modulate the functionality of the well-known oncoprotein c-Myc that is overexpressed in human CCA (24). Our findings illustrate changes that occur in the setting of chronic cholestasis that can set the stage to facilitate CCA oncogenesis.
c-Myc is the most well-known and studied member of the Myc oncoprotein family, which also includes N-Myc and L-Myc. L-Myc is less well understood and N-Myc expression is tissue restricted although it can substitute for c-Myc in murine development (25). The expression of c-Myc is estimated to be elevated or deregulated in up to 70% of human cancers by different mechanisms and is linked to aggressive cancer phenotype (25,26). c-Myc is a basic helix–loop– helix–leucine zipper (bHLH-LZ) transcription factor that binds to E-box sequences (5’-CACGTG-3’) as part of a heterodimeric complex with another bHLH-LZ protein, Max, to activate transcription in association with histone acetyltransferases. Max can also form heterodimeric complex with Mnt or Mga (referred to as Mad proteins) and compete with c-Myc/Max to turn off E-box in association with histone deacetylases (26). c-Myc can also repress genes by binding to transcription factors such as MIZ1 and SP1, which typically bind to core promoters, by displacing co-activators that bind to them or by recruiting co-repressors (26). c-Myc binds to thousands of E-box in promoter regions within a permissive chromatin environment and regulate many genes. c-Myc is itself regulated tightly at multiple levels including transcriptional, post-transcriptional and post-translational. It is transcriptionally activated by WNT/β-catenin, post-transcriptionally regulated by let-7, miR-34 and miR-145, and post-translationally modified by phosphorylation at Ser62 and Thr58, which facilitate its subsequent proteasomal degradation (25). In our current work we provide evidence of novel transcriptional regulation of c-Myc by MATα1 and two Maf proteins, MafG and c-Maf.
Our study included two experimental models of chronic cholestasis, BDL and LCA, one mouse model of cholestasis-associated CCA and human CCA specimens. We previously demonstrated c-Myc expression is induced early after BDL and LCA and remained elevated in the CCA stage (2,3,13). Knockdown of c-Myc protected against cholestatic liver injury (2) and progression of CCA (3). We have also shown MafG and c-Maf expression is induced early in BDL (12) and contributes to cholestatic liver injury as knockdown of these proteins protected against cholestatic liver injury (4). Our speculation was that induction of these Maf proteins formed complexes such as MafG:MafG homodimer and MafG:c-Maf heterodimer, both of which are known to repress ARE-mediated gene expression, including GSH synthetic enzymes (7). Recently we also reported c-Myc can interact with Nrf2 to repress Nrf2-mediated trans-activation of ARE (13). However, whether there is any interplay between c-Myc and Maf proteins was not examined. While overexpression of c-Maf has been reported in multiple myeloma and T-cell lymphomas (5), its role in solid tumors has not been reported to our knowledge.
MAT1A is predominantly expressed in normal hepatocytes and is a marker of differentiated hepatocyte phenotype (9). MAT1A expression and its encoded enzymatic activity fall in patients with chronic liver disease as MAT1A mRNA level is reduced in 58% and undetectable in 30% of cirrhotic patients (27). We have demonstrated mice lacking Mat1a develop HCC spontaneously and have multiple deregulated pathways implicated in HCC pathogenesis (9). However, the role of MAT1A in cholestatic liver injury or CCA development has not been reported. Lower hepatic SAMe levels have been reported in chronic cholestasis (8) and SAMe in turn has been found to protect against cholestatic liver injury (4,9). Since MATα1 is susceptible to inactivation by hydroxyl radicals and nitric oxide (9), we suspected originally that this might have been responsible for the fall in SAMe level. We also reported previously that low SAMe level due to loss of MATα1 leads to marked c-Myc induction at the mRNA level, although the mechanism was unknown (11). Collectively these findings prompted us to take a closer look at potential crosstalk between MATα1, c-Myc and Maf proteins.
We found hepatic MATα1 expression fell by 7 to 10 days after cholestatic liver injury in two murine models and more importantly, its expression fell in both hepatocytes and bile duct epithelial cells (Fig. 1). This is a novel finding as MATα1 was thought to be mainly expressed in hepatocytes (9). In contrast, c-Myc, MafG and c-Maf exhibited the opposite pattern, being low in expression in hepatocytes and bile duct epithelial cells in normal liver and markedly induced in both BDL and LCA at 14 days. Since the respective mRNA levels changed in comparable magnitude, the most plausible mechanism is at the mRNA level (due either to changes in transcription or mRNA stability). Using an unbiased proteomics approach, we found that these proteins are part of a larger complex, which also includes Max and Mnt. During cholestasis there is a switch from mainly MATα1-Mnt interaction to c-Myc-MafG-c-Maf as the protein levels of MATα1 and Mnt fell while Max expression was unchanged (Fig. 2). These changes (fall in MATα1, but higher c-Myc, MafG/c-Maf expression in bile duct epithelial cells) also occurred in both murine CCA model and human CCA specimens. We further demonstrated the interaction between MATα1, c-Myc, c-Maf, MafG and Max was direct using recombinant proteins.
Since these proteins interact with each other and are in a complex with Max, we examined whether they bind to the E-box region that is present in the promoter region of all four genes. This was confirmed using ChIP and seq-ChIP for all four genes and in each case, MATα1, Mnt and Max co-occupy E-box in the control liver but this is changed to c-Myc, c-Maf, MafG and Max at day 14 of BDL or LCA (Fig. 4). Since the liver is made up of predominantly hepatocytes, we also compared benign to malignant bile duct epithelial cells and found the same switch from MATα1 and Mnt co-occupying E-box in benign H69 cells to c-Myc, c-Maf and MafG in CCA lines (Supplemental Fig. 3). The most intriguing finding is that MATα1 can bind to the E-box only in the presence of c-Myc and Max (Fig. 4E). Since the expression of MATα1 fell while the other three increased and they all interact at E-box, we examined how they regulate each other at the promoter level. Our results show clearly that MATα1 and c-Myc/Maf proteins regulate each other in a reciprocal manner at the promoter level. MAT1A overexpression lowered the promoter activities of c-Myc dramatically (90%), and c-Maf and MafG moderately. Whereas c-Myc overexpression increased the promoter activities of MafG and c-Maf, but lowered that of MAT1A. MafG and c-Maf offer additional inductive effect at the E-box when combined with c-Myc, whereas combining MATα1 and c-Myc canceled each other out. These proteins are all acting on the E-box as mutation of the E-box largely eliminated their effects. All of these effects translated to comparable changes in their endogenous mRNA levels, further strengthening their influence on each other. Thus, the early induction in c-Myc and MafG/c-Maf after cholestatic injury can work in concert to bring about suppression of MAT1A at the transcriptional level. In addition, high nitric oxide level can inactivate MATα1 and this further allows sustained activation of c-Myc/MafG/c-Maf.
Reciprocal regulation between MAT1A and c-Myc/MafG and c-Maf occurs also in HepG2 cells, suggesting down-regulation of MAT1A in HCC can feed forward c-Myc induction. In HCC, multiple mechanisms contribute to MAT1A down-regulation (9). In CCA, in addition to c-Myc-mediated transcriptional suppression, we have evidence that Mat1a promoter is hypermethylated, which may have also contributed to the down-regulation.
While c-Myc, MafG and c-Maf are well-known transcription factors, MATα1 has not been shown to be one. Although MATα1’s nuclear presence is known (10,28), it was thought to regulate gene expression via epigenetics (28). Indeed, we showed that higher MAT1A expression in HCC cells resulted in nuclear MATα1 accumulation, hypermethylation of LIN28B promoter, leading to lower expression of LIN28B and increased let-7 expression (10). Since let-7 is known to negatively regulate c-Myc (25), this could be an indirect mechanism of how MAT1A regulates c-Myc. However, our observation that MATα1 binds to c-Myc and Max directly and negatively regulate E-box-driven reporter activity suggests the possibility that it can act as a transcription co-factor, in this case a co-repressor of E-box. In support of this is the fact that inhibiting DNA or H3K27 trimethylation had no effect on MAT1A-mediated suppression of c-Myc mRNA level (Fig. 6). However, overexpressing a MATα1 mutant that cannot oligomerize and is therefore catalytically inactive had no effect on c-Myc/MafG/c-Maf promoter activity, which would seem to support an epigenetic role. In liver MATα1 is present mostly as tetramer and dimer (9) and our current speculation is that there is a structural requirement for MATα1 to interact with c-Myc/Max and repress E-box. This remains to be investigated in future studies.
Our previous work demonstrated very clearly that c-Myc plays an important role in both cholestatic liver injury and in cholestasis-associated CCA progression (2,3) and our current work provides evidence that MafG and c-Maf are oncoproteins whereas MATα1 is a bona fide tumor suppressor for CCA. We demonstrated this in vitro and in an orthotopic metastatic CCA model. Knocking down MAT1A or overexpressing MafG and c-Maf all increased tumor growth, invasion and metastasis. However, the orthotopic CCA model we used does not recapitulate CCA in development. Confirmation using a progressive CCA model will be needed to further define the roles of MAT1A, MafG and c-Maf in the development of CCA. Since c-Myc has broad effects in a myriad of oncogenic processes, it is tempting to speculate that these proteins are exerting their influence via c-Myc. However, it remains plausible that they also have effects on oncogenesis that is c-Myc-independent, which remains to be examined.
In summary, we have shown a previously unreported crosstalk amongst MATα1, c-Myc, MafG and c-Maf. All four proteins directly interact and regulate each other at the E-box, which is present in the promoter region of all four genes. While the E-box serves as an enhancer element for c-Myc, MafG and c-Maf, it is a repressor element for MAT1A. Whereas c-Myc, MafG and c-Maf activate E-box, MATα1 inhibits E-box and positively regulates its own expression. In addition, we report for the first time high expression of MAT1A in normal bile duct epithelial cells (murine and human), which falls in CCA while the expression of MafG and c-Maf is induced. These changes serve to sustain c-Myc induction and facilitate CCA growth and progression and may be druggable targets. In support of this, restoration of MAT1A expression or inhibition of MafG or c-Maf suppressed CCA growth in vivo.
Supplementary Material
Acknowledgments
Financial Support: This work was supported by NIH grants R01DK092407 (HP Yang and SC Lu), R01DK107288 (HP Yang and SC Lu), R01DK51719 (SC Lu, HP Yang, and JM Mato), and R01DK59427 (GJ Gores), Plan Nacional of I+D SAF 2014-52097R, and Departmento de Educación del Gobierno Vasco (to JM Mato), and the National Natural Science Foundation of China (No. 81272735, to T Liu). Proteomics was performed by the Mass Spectrometry-Based Proteomics Core and pathological sections & staining were done by the Imaging Core of the USC Research Center for Liver Diseases (P30DK48522). The funders had no role in study design, data collection and analysis, decision to publish, or preparation of the manuscript.
Abbreviations used (alphabetical order)
- ARE
anti-oxidant response element
- BDL
bile duct ligation
- BrdU
5-bromo-2′-deoxyuridine
- CCA
cholangiocarcinoma
- ChIP
chromatin immunoprecipitation
- CRISPR
CRISPR/Cas9
- DZNep
3-deazaneplanocin A hydrochloride
- EZH2
Enhancer of Zeste Homolog 2
- EMSA
electrophoretic mobility shift
- EV
empty vector
- GFP
green fluorescent protein
- GSH
glutathione
- H3K27
histone 3 lysine 27
- H&E
hematoxylin and eosin
- HCC
hepatocellular carcinoma
- IHC
immunohistochemistry
- IP
immunoprecipitation
- LCA
lithocholic acid
- lenti
lentiviral
- MAT
methionine adenosyltransferase
- miRNAs
MicroRNAs
- MS
mass spectrometry
- PCNA
proliferating cell nuclear antigen
- SAMe
S-adenosylmethionine
- SC
scramble siRNA
- Seq-ChIP
sequential ChIP
REFERENCES
- 1.Blechacz BRA, Gores GJ. Cholangiocarcinoma. Clin Liver Dis. 2008;12:131–150. doi: 10.1016/j.cld.2007.11.003. [DOI] [PubMed] [Google Scholar]
- 2.Yang HP, Li TWH, Ko KS, Xia M, Lu SC. Switch from Mnt-Max to Myc-Max induces p53 and cyclin D1 expression and apoptosis during cholestasis in mice and human hepatocytes. Hepatology. 2009;49:860–870. doi: 10.1002/hep.22720. [DOI] [PMC free article] [PubMed] [Google Scholar]
- 3.Yang HP, Li TWH, Peng J, Tang X, Ko KS, Xia M, Aller MA. A mouse model of cholestasis-associated cholangiocarcinoma and transcription factors involved in progression. Gastroenterology. 2011;141:378–388. doi: 10.1053/j.gastro.2011.03.044. [DOI] [PMC free article] [PubMed] [Google Scholar]
- 4.Yang HP, Ko K, Xia M, Li TWH, Oh P, Li J, Lu SC. Induction of avian musculoaponeurotic fibrosarcoma proteins by toxic bile acid inhibits expression of GSH synthetic enzymes and contributes to cholestatic liver injury in mice. Hepatology. 2010;51:1291–1301. doi: 10.1002/hep.23471. [DOI] [PMC free article] [PubMed] [Google Scholar]
- 5.Eychène A, Rocques N, Pouponnot C. A new MAFia in cancer. Nature Rev. Cancer. 2008;8:683–693. doi: 10.1038/nrc2460. [DOI] [PubMed] [Google Scholar]
- 6.Kannan MB, Solovieva V, Blank V. The small MAF transcription factors MAFF, MAFG and MAFK: current knowledge and perspectives. Biochim Biophys Acta. 2012;1823:1841–1846. doi: 10.1016/j.bbamcr.2012.06.012. [DOI] [PubMed] [Google Scholar]
- 7.Lu SC. Glutathione synthesis. BBA-Gen. 2013;1830:3143–3153. doi: 10.1016/j.bbagen.2012.09.008. [DOI] [PMC free article] [PubMed] [Google Scholar]
- 8.Ebrahimkhani MR, Sadeghipour H, Dehghani M, Kiani S, Payabvash S, Riazi K, Honar H, et al. Homocysteine alterations in experimental cholestasis and its subsequent cirrhosis. Life Sci. 2005;76:2497–2512. doi: 10.1016/j.lfs.2004.12.009. [DOI] [PubMed] [Google Scholar]
- 9.Lu SC, Mato JM. S-Adenosylmethionine in liver health, injury and cancer. Physiol Rev. 2012;92:1515–1542. doi: 10.1152/physrev.00047.2011. [DOI] [PMC free article] [PubMed] [Google Scholar]
- 10.Yang HP, Cho ME, Li TWH, Peng H, Ko KS, Mato JM, Lu SC. MiRNAs regulate methionine adenosyltransferase 1A expression in hepatocellular carcinoma. J Clin Invest. 2013;123:285–298. doi: 10.1172/JCI63861. [DOI] [PMC free article] [PubMed] [Google Scholar]
- 11.Tomasi ML, Iglesias Ara A, Yang H, Ramani K, Feo F, Pascale MR, Martínez-Chantar ML, et al. S-adenosylmethionine regulates apurinic/apyrimidinic endonuclease 1 stability: implication in hepatocarcinogenesis. Gastroenterology. 2009;136:1025–1036. doi: 10.1053/j.gastro.2008.09.026. [DOI] [PMC free article] [PubMed] [Google Scholar]
- 12.Yang HP, Ramani K, Xia M, Ko KS, Li TW, Oh P, Li J, et al. Dysregulation of glutathione synthesis during cholestasis in mice: molecular mechanisms and therapeutic implications. Hepatology. 2009;49:1982–1991. doi: 10.1002/hep.22908. [DOI] [PMC free article] [PubMed] [Google Scholar]
- 13.Yang HP, Li TWH, Zhou Y, Peng H, Liu T, Zandi E, Martínez-Chantar ML, et al. Activation of a novel c-Myc-miR27-Prohibitin 1 circuitry in cholestatic liver injury inhibits GSH synthesis in mice. Antioxidant & Redox Signaling. 2015;22:259–274. doi: 10.1089/ars.2014.6027. [DOI] [PMC free article] [PubMed] [Google Scholar]
- 14.Murakami T, Yano H, Maruiwa M, Sugihara S, Kojiro M. Establishment and characterization of a human combined hepatocholangiocarcinoma cell line and its heterologous transplantation in nude mice. Hepatology. 1987;7:551–556. doi: 10.1002/hep.1840070322. [DOI] [PubMed] [Google Scholar]
- 15.Kusaka Y, Tokiwa T, Sato J. Establishment and characterization of a cell line from a human cholangiocellular carcinoma. Res Exp Med. 1988;188:367–75. doi: 10.1007/BF01851205. [DOI] [PubMed] [Google Scholar]
- 16.Park J, Gores GJ, Patel T. Lipopolysaccharide induces cholangiocyte proliferation via an interleukin-6-mediated activation of p44/p42 mitogen-activated protein kinase. Hepatology. 1999;29:1037–1043. doi: 10.1002/hep.510290423. [DOI] [PubMed] [Google Scholar]
- 17.Zeng Z, Huang ZZ, Chen C, Yang HP, Mao Z, Lu SC. Cloning and functional characterization of the 5′-flanking region of human methionine adenosyltransferase 1A gene. Biochem J. 2000;346:475–482. [PMC free article] [PubMed] [Google Scholar]
- 18.Zhou Y, Yi T, Park SS, Chadwick W, Shen RF, Wu WW, Martin B, et al. Rapid and enhanced proteolytic digestion using electric-field-oriented enzyme reactor. J Proteomics. 2011;74:1030–1035. doi: 10.1016/j.jprot.2011.02.007. [DOI] [PMC free article] [PubMed] [Google Scholar]
- 19.Mato IP, Sánchez del Pino MM, Chamberlin ME, Mudd SH, Mato JM, Corrales FJ. Biochemical basis for the dominant inheritance of hypermethioninemia associated with the R264H mutation of the MAT1A gene. A monomeric methionine adenosyltransferase with tripolyphosphatase activity. J Biol Chem. 2001;276:13803–13809. doi: 10.1074/jbc.M009017200. [DOI] [PubMed] [Google Scholar]
- 20.Fiskus W, Wang Y, Sreekumar A, Buckley KM, Shi H, Jillella A, Ustun C, et al. Combined epigenetic therapy with the histone methyltransferase EZH2 inhibitor 3-deazaneplanocin A and the histone deacetylase inhibitor panobinostat against human AML cells. Blood. 2009;114:2733–2743. doi: 10.1182/blood-2009-03-213496. [DOI] [PMC free article] [PubMed] [Google Scholar]
- 21.Rizvi S, Borad MJ, Patel T, Gores GJ. Cholangiocarcinoma: molecular pathways and therapeutic opportunities. Sem Liv Dis. 2014;34:456–464. doi: 10.1055/s-0034-1394144. [DOI] [PMC free article] [PubMed] [Google Scholar]
- 22.Fava G, Lorenzini I. Molecular pathogenesis of cholangiocarcinoma. Int J Hepatol. 2011:2012. doi: 10.1155/2012/630543. article ID 630543. [DOI] [PMC free article] [PubMed] [Google Scholar]
- 23.Liu R, Zhao R, Zhou X, Liang X, Campbell DJ, Zhang X, Zhang L, et al. Conjugated bile acids promote cholangiocarcinoma cell invasive growth through activation of sphingosine 1-phosphate receptor 2. Hepatology. 2014;60:908–918. doi: 10.1002/hep.27085. [DOI] [PMC free article] [PubMed] [Google Scholar]
- 24.Boulter L, Guest RV, Kendall TJ, Wilson DH, Wojtacha D, Robson AJ, Ridgway RA, et al. WNT signaling drives cholangiocarcinoma growth and can be pharmacologically inhibited. J Clin Invest. 2015;125:1269–1285. doi: 10.1172/JCI76452. [DOI] [PMC free article] [PubMed] [Google Scholar]
- 25.Dang CV. Myc on the path to cancer. Cell. 2012;149:22–35. doi: 10.1016/j.cell.2012.03.003. [DOI] [PMC free article] [PubMed] [Google Scholar]
- 26.Lüscher B, Vervoorts J. Regulation of gene transcription by the oncoprotein MYC. Gene. 2012;494:145–160. doi: 10.1016/j.gene.2011.12.027. [DOI] [PubMed] [Google Scholar]
- 27.Avila MA, Berasain C, Torres L, Martin-Duce A, Corrales FJ, Yang H, Prieto J, et al. Reduced mRNA abundance of the main enzymes involved in methionine metabolism in human liver cirrhosis and hepatocellular carcinoma. J Hepatol. 2000;33:907–914. doi: 10.1016/s0168-8278(00)80122-1. [DOI] [PubMed] [Google Scholar]
- 28.Reytor E, Pérez-Miguelsanz J, Alvarez L, Pérez-Sala D, Pajares MA. Conformational signals in the C-terminal domain of methionine adenosyltransferase I/III determine its nucleocytoplasmic distribution. FASEB J. 2009;23:3347–3360. doi: 10.1096/fj.09-130187. [DOI] [PubMed] [Google Scholar]
Associated Data
This section collects any data citations, data availability statements, or supplementary materials included in this article.


