Abstract
Acute glomerulonephritis such as those caused by anti-glomerular basement membrane disease is marked by high mortality. The primary reason for this is delayed diagnosis via blood examination, urine analysis, tissue biopsy, or ultrasound and X-ray computed tomography imaging. Blood, urine, and tissue-based diagnoses can be time consuming, while ultrasound and CT imaging have relatively low spatial resolution, with reduced sensitivity. Optical coherence tomography is a noninvasive and high-resolution imaging technique that provides superior spatial resolution (micron scale) as compared to ultrasound and CT. Changes in tissue properties can be detected based on the optical metrics analyzed from the OCT signals, such as optical attenuation and speckle variance. Furthermore, OCT does not rely on ionizing radiation as with CT imaging. In addition to structural changes, the elasticity of the kidney can significantly change due to nephritis. In this work, OCT has been utilized to quantify the difference in tissue properties between healthy and nephritic murine kidneys. Although OCT imaging could identify the diseased tissue, its classification accuracy is clinically inadequate. By combining optical metrics with elasticity, the classification accuracy improves from 76% to 95%. These results show that OCT combined with OCE can be a powerful tool for identifying and classifying nephritis. Therefore, OCT/OCE method could potentially be used as a minimally-invasive tool for longitudinal studies during the progression and therapy of glomerulonephritis as well as complement and, perhaps, substitute highly invasive tissue biopsies.
Keywords: glomerulonephritis, elasticity optical coherence elastography, Young’s modulus, elastic wave velocity, optical attenuation, speckle variance
Graphical abstract
Commonly used imaging platforms such as CT, MRI and US are not suitable for detecting glomerulonephritis. Here, we combine the use of optical coherence tomography (OCT) and optical coherence elastography (OCE) in order to co-capture structural and elastic information with micrometer spatial resolution. The results show that OCT/OCE was able to distinguish nephritic kidneys from healthy controls with 95% prediction accuracy, which suggesting a promising application of the presented technique in clinical glomerulonephritis detection using minimally-invasive procedures.
1. Introduction
Acute glomerulonephritis can arise from multiple triggers, and is associated with significant morbidity and mortality. One such trigger is anti-glomerular basement membrane immune attack. Anti-glomerular basement membrane disease (anti-GBM) is a rare disorder with a high fatality rate, which is primarily due to a delayed diagnosis compounded by rapid disease progression [1]. Thus, accurate and early diagnosis is critical for preserving renal function [2]. Although tissue biopsy, blood examination, and urine testing can provide accurate diagnosis, they can be time consuming [3]. For example, tissue biopsy can be invasive and preclude the possibility to perform longitudinal studies on the kidney due to increased risk of inflammation and other damage. A rapid and noncontact imaging technique, which can accurately detect glomerulonephritis, would overcome these limitations. Currently, X-ray computed tomography (CT), magnetic resonant imaging (MRI), and ultrasound imaging are widely used for image-guided renal diagnosis [3]. Although X-ray CT imaging and MRI are able to image soft tissues with excellent contrast, X-ray CT imaging exposes the patient to radiation and MRI equipment and operation can be cost prohibitive [4]. Ultrasound imaging is a rapid, cost-effective, and portable clinical imaging technique without the detrimental effects of ionizing radiation and the need for large imaging tubes as with CT and MRI. Because of its real-time imaging capabilities, ultrasound-guided renal biopsy has been widely utilized to reduce the risk of complications [5, 6]. Although ultrasound imaging demonstrated the ability to detect parenchymal disease, it was unable to detect abnormalities that were confined to glomeruli, such as increased mesangial matrix and thickening of the basement membrane [7, 8]. Thus, effectively detecting the pathological structure from images requires superior spatial resolution at the micrometer scale.
Optical coherence tomography (OCT) is a noninvasive and high-resolution imaging technique capable of providing micrometer-scale spatial resolution (≤ 10 μm) with an imaging depth of a few millimeters in scattering media such as tissue [9, 10]. Because of its micrometer scale resolution, OCT can clearly identify the structural details of renal corpuscles containing glomeruli and the Bowman space [11], which potentially enables OCT to reveal structural changes caused by progression of glomerulonephritis [12]. Although OCT imaging depth is limited, probe-based OCT methods [13–15] allow imaging the internal organs, including the kidney. Unlike standard renal biopsy methods, OCT allows longitudinal assessment of the pathological changes in renal tissues without damage to the kidney [16]. In application, OCT has been applied in various biomedical fields, including ophthalmology [17], oncology [18], cardiology [19], dermatology [20], and nephrology [11]. In addition to the qualitative images, quantitative biological tissue properties can be garnered from various optical metrics [21], such as optical attenuation, and speckle variance. Both of these metrics have been applied to identify the liver from the other organs in vivo, including the intestine and kidney [22]. In addition, the optical attenuation has been utilized to characterize renal tissue properties, and successfully differentiate the tumor from healthy kidney tissue in vivo [23]. The use of quantitative optical metrics has enabled automated disease detection with machine learning algorithms. Thus, quantitative OCT metrics may be useful for the early detection of nephritis.
In addition to morphological changes, the biomechanical properties can also be significantly altered by the nephritic process [24]. Elastography is a technique that can provide quantitative information on the biological properties of tissues by imaging an induced mechanical deformation. Ultrasound elastography (USE) [24, 25] and magnetic resonance elastography (MRE) [26, 27] have been used to detect the mechanical changes in renal tissue during disease. However, MRE and USE have relatively poor spatial resolution and contrast and require large displacement amplitudes to provide a detectable signal [3, 28]. OCT based elastography, which is termed optical coherence elastography (OCE), is a novel, rapidly emerging technique that can capture mechanical contrast in tissue with micrometer spatial resolution [29]. OCE can provide nanometer displacement sensitivity by analyzing the complex OCT signal [30], enabling ultra-sensitive OCE investigations [31]. OCE has been utilized to characterize the biomechanical properties of atherosclerotic vessels [32], soft tissue tumors [33], the cornea [34, 35], and crystalline lens [36]. Extrapolating from these reports, we reasoned that OCE may also have the potential to quantitatively assess biomechanical changes in kidneys due to nephritis.
For developing a clinical OCE technique, selecting an appropriate excitation method is critical. Generally, loading techniques fall into two categories: static/quasi-static and dynamic. For static loading, compression OCE can obtain the Young’s modulus of tissues in 2D with high spatial resolution [37, 38]. Although compression OCE can be useful for quantifying skin mechanical properties in vivo, there are challenges that must be overcome before using the stress sensor inside the body. Dynamic OCE techniques primarily rely on analyzing the propagation of an externally induced elastic wave and tissue deformation caused by external vibration [39]. Nguyen et al. have successfully captured a two dimensional shear wave elastogram with the use of vibrational loading [40], demonstrating direct measurement of absolute elasticity using a contact-based method. Qi et al. have recently developed a noncontact confocal acoustic radiation force OCE system for point-by-point elastic imaging of human arteries, but this technique has not yet been demonstrated in vivo [41] and lacks the ability to provide Young’s modulus. Recently, Song et al. have utilized noninvasive acoustic radiation force loading to provide depth-resolved elasticity of the retina [42]. Dynamic OCE techniques have the ability to quantify Young’s modulus without the requirement of an additional sensor. Therefore, the use of a needle-based OCE combined with acoustic radiation force loading might be a viable option for characterizing biomechanical properties of tissues within the body. In this pilot study, we utilized noncontact air-pulse excitation [28, 43] for loading the kidney tissue to quantify Young’s modulus without the need for tissue contact or a requirements for a transmission medium.
In this work, we demonstrate the first use of OCT structural image analysis combined with OCE to classify nephritis caused by anti-GBM disease in murine kidneys. A phase-stabilized swept source optical coherence tomography (PhS-SSOCT) system was used to image the whole kidneys ex vivo. Two optical metrics, optical attenuation and speckle variance, were used to quantify structural changes in the tissue due to nephritis. Although the OCT structural metrics were able to detect the diseased tissue, the classification accuracy was relatively low. To enhance the classification performance, the elasticity of the kidneys was incorporated as an additional metric. A focused air-pulse induced a low amplitude (micrometer scale) elastic wave, which was then imaged using a phase-stabilized swept source optical coherence elastography (PhS-SSOCE) system. The Young’s modulus as estimated by OCE significantly increased the classification accuracy from 76% (using optical metrics only) to 95% (using optical metrics and elasticity). These results demonstrate that utilizing both the structural and biomechanical metrics provided by the two complementary technologies, OCT and OCE may be useful for the early detection of glomerulonephritis during clinical examination.
2. Materials and Methods
2.1. Sample preparation and experimental procedure
GBM-reactive antibody was used to induce anti-GBM glomerulonephritis in mice. Kidneys from 21 mice of strain 129/svJ (11 healthy, 10 nephritic) were utilized for ex vivo assessment. All samples were harvested from female mice due to their greater sensitivity to nephritis. Prior to the experiments, all samples were hydrated in 1X PBS and all experiments were completed within 12 hours of harvesting the kidneys. All animal manipulation procedures were approved by the Institutional Animal Care and Use Committee (IACUC) of the University of Houston.
2.2. 24hrs proteinuria and renal histology
Twenty-four hour urine samples were collected from all mice on day 0 and day14 after anti-GBM challenge, using metabolic cages, with free access to drinking water. Urinary protein concentration was determined using the Coomassie Plus protein assay kit (Rockford, IL, USA). All animals were sacrificed on day14, and one kidney form each mouse was send for OCT/OCE analysis and another was processed for pathology evaluation. During pathology, four-micrometer sections of formalin-fixed, paraffin-embedded kidney tissues were sectioned, and stained with hematoxylin and eosin and Periodic Acid Schiff. These sections were examined for any evidence of pathology in the glomerular, tubulointerstitial compartments, as described previously [44, 45].The severity of GN was graded on a scale of 0–4 based on the evidence of hypertrophy, proliferative changes, crescent formation, hyaline deposits, fibrosis/sclerosis and basement membrane thickening.
2.3. PhS-SSOCE system
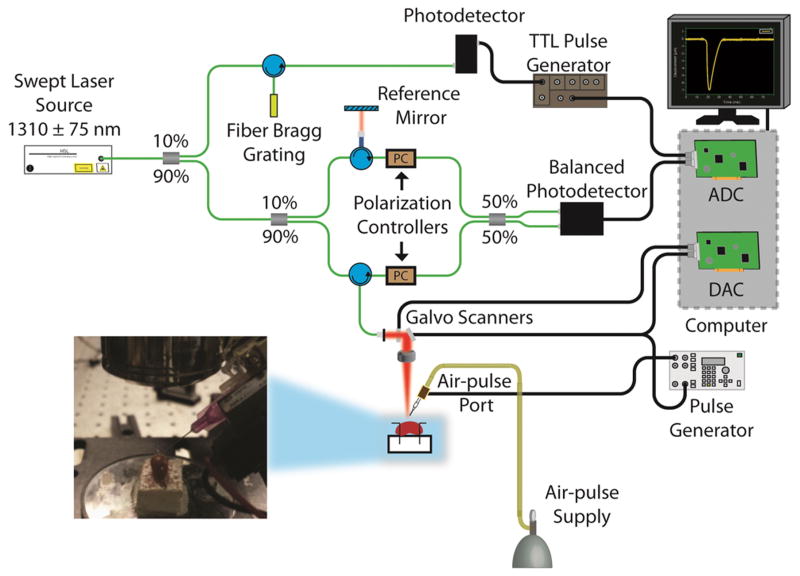
A home-built PhS-SSOCT system was combined with an air-pulse delivery system to obtain the OCT and OCE measurements as shown in Figure 1. In brief, the PhS-SSOCT system utilized a broadband swept laser source (HSL2000, Santec, Inc., USA) with a central wavelength of 1310 nm, scan range of 150nm, A-scan rate of 30 kHz and the output power of ~36 mW. The interference pattern was recorded by a balanced photodetector and digitized by a high speed analog to digital convertor (ATS9462, Alazar Tech Inc., Quebec, Canada). An FFT was performed on the fringe, which was resampled into linear k-space, to obtain each OCT A-line and corresponding structural image and phase information. The axial and transversal resolutions were ~11 μm and ~15 μm, respectively, and the phase stability of the system was experimentally measured as ~16 mrad in air. Further details of the PhS-SSOCT system can be found in our previous publications [46]. The air force applied on the kidney was at most 11 Pa, successive M-mode images (n=501) were acquired (M-B mode) in a ~6 mm line along the elastic wave propagation path. Because each M-mode image was synchronized with an air-pulse excitation, the PhS-SSOCT system effectively imaged the elastic wave propagation.
Figure 1.
Schematic of OCE system setup.
2.4. OCT image analysis
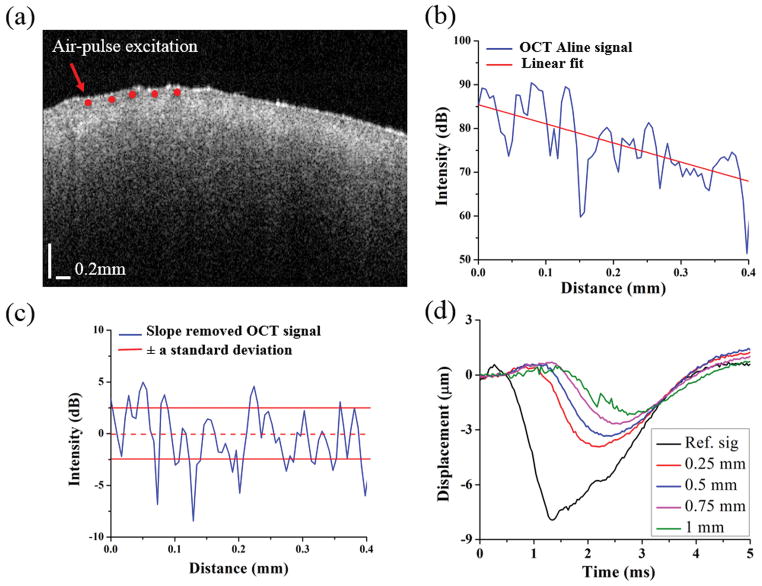
Figure 2 shows the steps followed for obtaining the OCT structural parameters. To quantify the structural changes, the OCT signal slope (OCTSS) was calculated [47]. The OCTSS is reflective of the optical attenuation and scattering properties of the sample. A typical OCT structural image is shown in Figure 2(a). During the OCTSS computation, the intensity A-lines from five neighboring positions were averaged into one intensity A-lines in order to reduce the effect of speckle variance to the linear fit. The averaging procedure was applied at each lateral position. A typical averaged OCT A-line from the OCT image is plotted in Figure 2(b).To eliminate the influence of surface reflections, the computation window for each A-line was selected 40 μm beneath the surface. To provide a more robust measurement of OCTSS with a minimal influence of defocusing and sensitivity drop-off artifacts, 200 A-lines in the central region (corresponding to ~2.5 mm) were utilized in the optical metric calculations. The OCTSS was calculated for ~0.4 mm of tissue by a least squares linear fit of the OCT A-line. For speckle variance (SV) analysis, the linearly fitted slope was computed based on the raw intensity A-line without averaging in order to retain the original light scattering property along the optical axis. The fitted slope was subtracted from its corresponding OCT A-line to obtain a slope-removed intensity signal as plotted in Figure 2(c). The speckle variance (SV) was quantified by the standard deviation of the slope-moved intensity signal as a function of depth. To put it simply, this metric is a representation of the depth-wise tissue refractive index mismatches [9] and was used as the second optical metric.
Figure 2.
OCT and OCE analysis procedures. (a) OCT structural image of a typical healthy murine kidney. (b) Single OCT image A-line signal selected from (a). (c) Slope-removed OCT A-line and standard deviation bounds used for SV calculation. (d) The temporal vertical displacement profiles corresponding to the red points in a single depth layer as plotted in (a), showing the elastic wave propagation.
2.5. Elasticity assessment
Figure 2(d) shows the elastic wave vertical displacement profiles corresponding to the red marks in Figure 2(a). The unwrapped typical vertical displacement profile of elastic wave dsurface(t) at the surface was calculated by:
| (1) |
where φsurface(t) was the unwrapped vertical temporal phase at the surface, λ0 was the central wavelength of the laser source, and nkidney =1.4 [16] was the refractive index for kidney tissues. The true displacement profile within the kidney dinside(t) was corrected because of the surface motion and refractive index mismatch between air and the tissue by [48].
| (2) |
The time delay, t, of the elastic wave to propagate from a reference position near the excitation to each of the OCE measurement positions was determined by cross-correlation analysis of the normalized displacement profiles. The computed time delays in a given imaged in-depth layer were linear fitted to the corresponding OCE measurement positions, and the slope of the fit was the elastic wave velocity for that given in-depth layer. For all samples, the computation window was selected over ~0.16 mm in depth and ~1 mm long along the kidney surface to minimize phase aberration, which was dominated by insufficient scattering and speckle decorrelation [49, 50]. The depth-wise median velocity was then used as the elastic wave velocity, cg, to calculate Young’s modulus by the surface wave equation [51], where ρ=1100 kg/m3 [52] was the density of the tissue, and ν=0.49 [53] was the
| (3) |
2.6. Classification
Support vector machine (SVM) is a supervised mathematical method for classifying unknown samples based on training data sets [54]. Classification was performed with the LIBSVM library and Matlab interface [55]. To construct a robust classifier from the training data, the cost and gamma values used in the radial basis function (RBF) are critical [56]. The cost and gamma values [57, 58] were optimized by an automatic grid search in the range from 2−3:22:215 and 215:22:23, respectively. During the grid search, 3-fold cross validation was used to obtain the best classification accuracy. The searching increment power constant was reduced by a factor of 50% in each loop, i.e. 22, 21, 20.5, 20.25…etc., until the improved accuracy of the next iteration was less than 0.5%. Leave-one-out cross-validation (LOOCV) [59] was utilized to compute the classification accuracy. Briefly, LOOCV is an iterative process that removes one sample from the data set, constructs the classifier, and then classifies the removed sample. This process is then repeated for each sample. The RBF kernel with the optimized cost and gamma parameters was used for the data prediction. The resulting confusion table (Table 1) was used to calculate the classification accuracy, sensitivity, and specificity. The 95% confidence intervals (CI) was computed based on the Wilson interval score with continuity correction [60]. In addition, an unpaired two sample two-tailed t-test with unequal-variance was utilized to determine the statistical significance, where a P-value less than 0.05 was considered significant.
Table 1.
Confusion matrix computed by SVM using LOOCV. CI: 95% confidence interval computed from the Wilson score interval with continuity correction.
| Nephritic kidney classification | OCT (OCTSS and SV) | OCE (Elasticity) | |||
|---|---|---|---|---|---|
|
| |||||
| Predicted classes
| |||||
| Healthy | Diseased | Healthy | Diseased | ||
|
|
|||||
| True classes | Healthy Diseased | 8 | 3 | 9 | 2 |
| 2 | 8 | 2 | 8 | ||
|
| |||||
| Accuracy | 76% | 81% | |||
| Sensitivity | 80% | 80% | |||
| (CI: 44 – 97%) | (CI: 44 – 97%) | ||||
| Specificity | 73% | 82% | |||
| (CI: 40 – 93%) | (CI: 48– 97%) | ||||
| (c) Cost and (g) Gamma | (c=11.3, g=0.125) | (c=8, g=0.5) | |||
| Nephritic kidney classification | OCT+OCE (OCTSS, SV, and elasticity)
|
|||
|---|---|---|---|---|
| Predicted classes
| ||||
| Healthy | Diseased | |||
|
|
||||
| True classes | Healthy Diseased | 10 | 1 | |
| 0 | 10 | |||
|
| ||||
| Accuracy | 95% | |||
| Sensitivity | 100% | |||
| (CI: 66 – 100%) | ||||
| Specificity | 91% | |||
| (CI: 57 – 100%) | ||||
| (c) Cost and (g) Gamma | (c=4, g=0.25) | |||
3. Result
3.1. Renal Histology following anti-GBM challenge
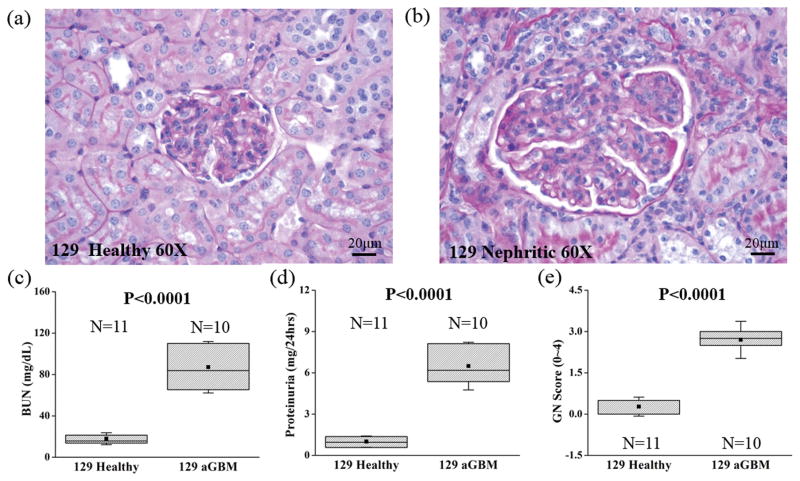
During the progression of glomerulonephritis, the formation of glomerular crescents and excessive proliferation of epithelial and mesangial cells have been determined to be pathological indicators of nephritis severity [44, 61, 62]. Light microscope images of kidney sections from control and nephritic mice at 60X magnification are shown in **********Figure 3. As expected, the anti-GBM challenged murine kidney (Figure 3b) demonstrated a greater degree of crescent formation and showed considerable local epithelial proliferation, which compressed the glomerular capillary and decreased the Bowman space. Nephritis results in a greater degree of blood urea nitrogen (BUN), a higher proteinuria and glomerulonephritis scores (GN scores) as illustrated in Figure 3(c–e).
Figure 3.
Renal histology and GN scores in the healthy (N=11) and nephritic kidneys 14 days following anti-GBM antibody challenge (N=10). The light microscopy view (60X) of the healthy (129/sv mice, unchallenged) and the nephritic glomerulus (129/sv mice, anti-GBM challenged) are shown in (a) and (b), respectively. Plots of (c) blood urea nitrogen (BUN), (d) proteinuria and (e) GN scores with (P<0.0001) were assessed by an unpaired two-sample unequal-variance t-test. The square dots and whiskers in (c)–(e) represent the mean and a standard deviation values, respectively.
3.2. Structural OCT images of nephritic kidneys
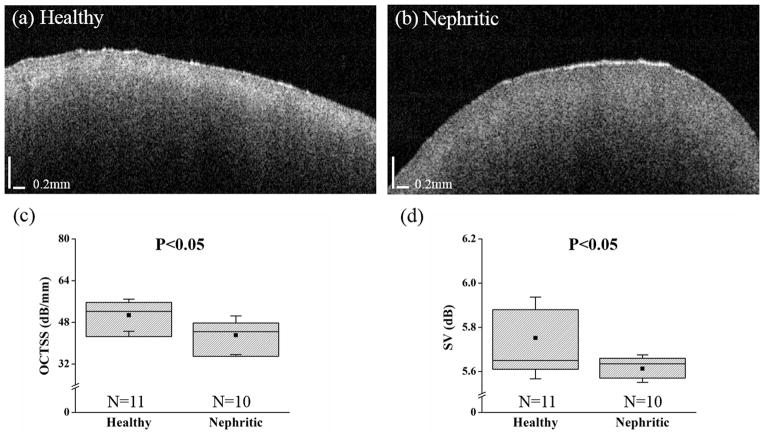
Figure 4 shows typical OCT images of (a) healthy and (b) nephritic kidneys. From the structural images, it is difficult to identify the morphological changes in the nephritic kidney. Comparing the intensities from both images in Figure 4 (a)–(b), the diseased kidney has a lower intensity in the cortical region, which implies a lesser degree of light attenuation and scattering in the diseased kidney.
Figure 4.
Typical OCT images and optical metrics computed from the healthy (N=11) and nephritic kidneys 14 days following anti-GBM challenge (N=10). Plotted are the structural images of (a) healthy and (b) nephritic kidneys and the analyzed results of (c) OCTSS and (d) SV. The square dots and whiskers in (c)–(d) represent the mean and a standard deviation values, respectively.
The quantitative assessment of the optical properties is presented in Figure 4(c)–(d). The OCTSS for the healthy and nephritic kidneys were 50.1 ± 6.1 dB/mm and 42.9 ± 7.4 dB/mm (P=0.02), respectively, which demonstrates that light attenuated more in the healthy tissue within the same distance. From Figure 4(d), the SV was 5.75 ± 0.19 dB for the healthy kidneys and 5.61 ± 0.07 dB for the nephritic kidneys (P=0.036), which indicates a greater degree of depth-wise refractive index mismatch in the healthy kidneys. As a result, SVM classification using only the optical metrics resulted in 76 % prediction accuracy, 80% sensitivity, and 73% specificity for distinguishing the nephritic kidneys from the healthy controls, as listed in Tabel 1. To improve the classification performance, elasticity was tested as an additional classification metric.
3.3. Combined OCE and OCT analysis of nephritic kidneys
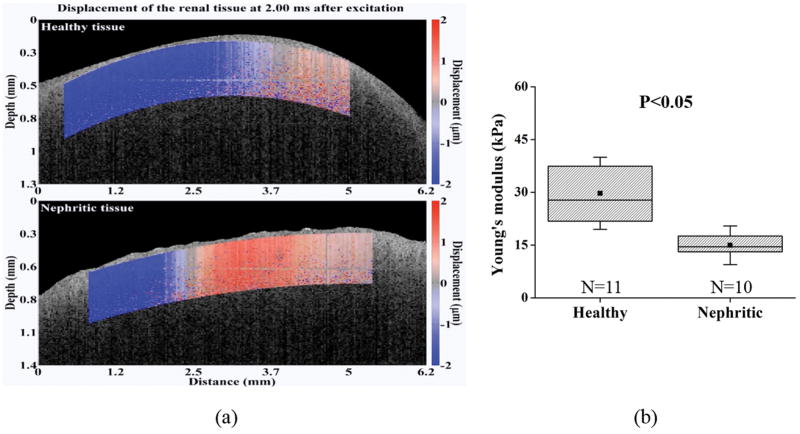
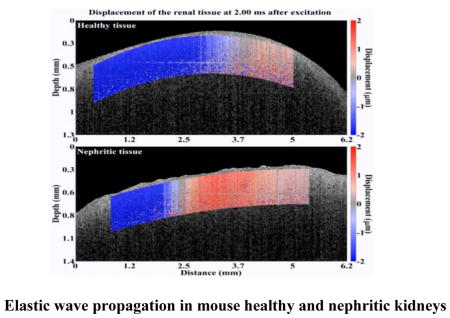
Next, the nephritic kidneys and healthy kidneys were assessed using OCE. Visualization of the elastic wave propagation in healthy and nephritic kidneys is illustrated in Figure 5 (Movie S1). The elastic wave propagated further in the healthy kidney as compared to the diseased kidney at comparable times after excitation, which means that the elastic wave travelled faster in the healthy kidney.
Figure 5.
OCE assessment and the computed Young’s modulus in the healthy (N=11) and nephritic kidneys (N=10). (a) Elastic wave propagation in the typical healthy (upper) and nephritic kidneys (lower) at 2 ms after excitation (Movie S1). (b) Shown plots are the quantified Young’s modulus based on elastic wave group velocity by Equation 3. The square dots and whiskers in (b) represent the mean and standard deviation values, respectively.
The Young’s modulus estimated from the elastic group wave velocity is plotted in Figure 5(b). The elasticity metric was 29.4 ± 10.1 kPa for the healthy kidneys, and 15.5 ± 6.1 kPa for the nephritic kidneys. Classification of nephritis using only the elasticity metric (i.e., stiffness) resulted in an accuracy of 81%, sensitivity of 80%, and specificity of 82%, which was better than the optical metric classification performance derived using OCT.
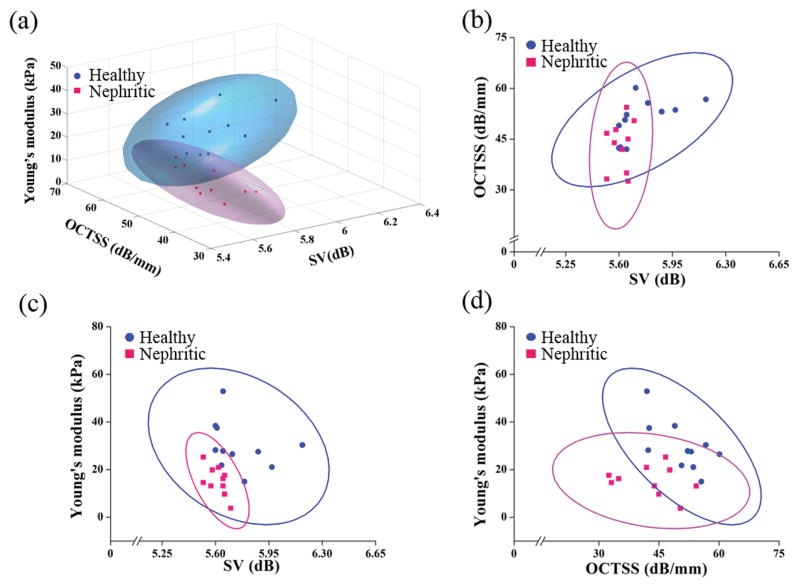
To further increase the classification performance, the OCT-derived optical metrics and OCE-derived elasticity metrics were combined. Figure 6 is a three-dimensional plot with the 95% confidence regions of the combined OCT and OCE parameters for the healthy and diseased renal samples. Compared to classification by optical metrics only, the prediction accuracy, sensitivity, and specificity of the combined OCT and OCE measurements increased from 76% to 95%, 80% to 100%, and 73% to 91%, respectively. Table 1 is the resulting confusion table showing the results of OCT, OCE, and OCT+OCE classification. The results show that the information obtained from the OCT and OCE measurements complement each other, and demonstrate that OCT+OCE is a promising method to detect nephritis based on the optical and biomechanical properties of the kidney.
Figure 6.
3-D and 2-D computational plots comparing the healthy (N=11) and the nephritic (N=10) kidneys based on the OCT-derived structural and OCE-derived elasticity metrics. (a) Three-dimensional (3D) plot of the sample points with 95% confidence region. Two-dimensional (2D) plots with 95% confidence region illustrating (b) OCTSS versus SV and (c) Young’s modulus versus SV, and (d) Young’s modulus versus OCTSS, comparing the nephritic kidneys to the healthy controls.
4. Discussion
In this study, we demonstrate the first use of OCT combined with OCE for the accurate detection of nephritis in murine kidneys by assessing the structural and elasticity changes caused by acute nephritis. The results show that OCT and OCE together can be useful for detecting the changes in tissue properties, which could be a consequence of increased inflammation, including increased crescent formation and cellular proliferation in the nephritic kidney. Furthermore, the results show that the combination of OCT and OCE can achieve a classification accuracy of 95%, sensitivity of 100%, and specificity of 91%, which suggests that tissue analysis using OCT combined with OCE was accurate and could potentially be useful for the in vivo detection of glomerulonephritis.
From the structural results shown in Figure 4, a greater degree of light attenuation was observed in the healthy as compared to the diseased kidney. Smaller values of OCTSS and SV in the nephritic kidneys may potentially be the consequence of increased inflammatory and formation of crescents with glomerulonephritis [24], though these fine structural associations warrant experimental confirmation. However, insufficient axial resolution can cause image artifacts and introduce bias in SV quantification [63]. To effectively image the renal corpuscles with OCT, even better system resolutions of at least 8 μm in the axial and 5 μm in the lateral directions are required [11]. Consequently, further enhancement of the axial resolution would improve the detection of fine structural changes within the renal corpuscle and reduce the computational bias of SV. Additionally, the limited penetration depth of OCT would restrict renal assessment in a clinical setting to a few millimeters beneath the surface. To overcome this limitation, the presented method can be incorporated with a side-viewing [15] or forward-viewing [64] needle based OCT system for assessing tissue properties of the kidney in vivo. Although needle-based OCT would introduces a small incision, it would maintain the integrity of the kidney and minimize additional renal inflammation because there would be no renal tissue extraction. Furthermore, the minimally invasive nature of needle-based OCT would enable longitudinal investigations of the renal pathology. Nevertheless, the optical measurements obtained from the OCT structural images, resulted in a classification accuracy of 76% and demonstrated the feasibility of using structural metrics for disease detection.
In order to improve the classification accuracy, elasticity was incorporated into the computational analysis. From our results, the healthy kidneys were significantly stiffer than the nephritic kidneys. Previous investigation using a related approach, USE, showed that the increased renal cortical wet/dry ratios caused by the reduced glomerular filtration rate in the diseased kidney correlated with reduced stiffness, hence corroborating our results [24]. However, the Young’s modulus of the nephritic kidney has not yet been investigated. To provide an accurate quantification of the elasticity by M-B mode imaging, the temporal resolution of the OCT system is critical. The range of the detectable elastic wave velocity was 0.01 m/s to 30 m/s based on the temporal resolution of the PhS-SSOCT system, M-mode image duration, and elastic wave propagation distance. Thus, the range of the Young’s modulus was from 0.3 kPa to ~3 MPa, which ensured that our detected elasticity of 10 kPa to 40 kPa were reliable. As a result, the combination of OCT and OCE improved the classification accuracy from 76% to 95%.
It should be noted that the curved surface of the kidney could have introduced some artifacts in the OCE results. Firstly, the biological properties of the kidney can have less wave propagation distance and affect the computation accuracy of the time delay. A previous study has reported that the kidney is a viscous tissue [65]. From OCE elastic wave measurements, a greater viscosity has been associated with a rapid elastic wave amplitude attenuation and reduced wave propagation distance in tissues [66]. Secondly, the varied curved surfaces and thicknesses can potentially affect the measured elastic wave group velocity [67]. In future studies, the structural OCT images of the tissue surface could potentially be utilized to correct the OCE quantification of elastic properties using known geometry. While the thickness can also affect the measured elastic wave group velocity [67], the murine kidneys studied were of similar dimensions, and the OCE measurements were taken in the same central region, which minimized the influence of variations in the thickness on the elasticity assessments.
To evaluate the performance of disease identification using the proposed method, a robust classifier with optimized cost and gamma parameters using a grid-search algorithm was constructed. However, with a larger sample size and more features, the computational cost of the grid search might be a concern. To resolve this problem, other classification techniques such as principal component analysis combined with SVM could be considered [68].
Currently, ultrasound-based dynamic elastography has been widely applied to the investigation of kidney disease, but manual compression from the US probe can affect the assessment of the elastic wave velocity [69]. In contrast, the presented OCE measurement technique is noncontact-dependent. In addition, the proposed method can also provide qualitative and quantitative information from structural images to aid in disease classification. In order for this technique to be effective in the clinic, the acquisition time must be reduced. In this study, each M-mode image was acquired over 100 ms, and 501 M-mode were acquired for each kidney sample, resulting in impractical total imaging time for clinical purposes. Recently, we have demonstrated an OCE technique that can be executed at ~1.5 million Aline per second [70]. Here, the elastic wave was imaged directly and the phase data from consecutive B-scans was utilized, resulting in a total acquisition time of ~30 ms. Moreover, a single air-pulse was required for a line scan measurement, while the technique in the presented work requires an air-pulse to be synchronized with each OCE measurement position. Thus, this newer ultra-fast technique may enable the effective use of OCE for clinical nephritis assessment.
The primary contribution of this work in the first demonstration of OCT combined OCE to characterize the tissue properties of the healthy and glomerulonephritis kidneys. The proposed method can be summarized as a three-dimensional sample-based quantitative detection technique as illustrated in Figure 6(a), which was able to differentiate the healthy and diseased kidneys. Figure 6(b–d) show the corresponding two-dimensional plots between the healthy and diseased tissues. From Figure 6(a), the nephritic kidneys have less optical attenuation, light scattering, refractive index mismatches, and stiffness as compared to the healthy kidneys. From the 3-D plot, the 95% confidence regions of the healthy and diseased kidneys fall into separate regions, which provide more objective and discriminatory information as compared to the OCT structural images alone.
The results of this study suggest the potential of further developing the presented computational method into an automated detection technique to aid in diagnosis. With respect to clinical utility, several disease-related questions remain to be addressed. Whether this novel approach has the potential to discern incremental grades of glomerulonephritis corresponding to the pathology grades and whether tubulo-interstitial disease can also be detected remains to be explored. Besides acute glomerulonephritis, it would also be important to test the utility of this approach in chronic glomerulonephritis. With the later scenario, the novel approach described here can replace the routine renal biopsy, this could have a dramatic impact on the management of chronic kidney disease.
5. Conclusion
Here, we combined the use of two related technologies, OCT and OCE, in order to co-capture structural and elastic information with micrometer spatial resolution. The three effective metrics of the presented method including OCTSS, SD and Young’s modulus were presented and the performances of which were assessed by LIBSVM computation. The classification performance of the Young’s modulus shows higher accuracy (81%) than the OCT structural metrics alone (76%). By combing OCE with OCT metrics, the presented metrics were able to distinguish nephritic kidneys from healthy controls with 95% prediction accuracy, 100% sensitivity, and 91% specificity, suggesting a promising application of the presented technique in clinical glomerulonephritis detection using minimally-invasive procedures.
Supplementary Material
Elastic wave propagation in the typical healthy (upper) and nephritic kidneys (lower) at 2 ms after excitation.
Acknowledgments
We acknowledge the experimental assistance from Mr. Qais Zai and Ms. Raksha Raghunathan. Special thanks goes to Dr. Gifford (BME, University of Houston) for discussion and help with statistical analysis of the data. This research was supported in part by NIH R01DK81872, 1R01EY022362, 1R01HL120140, and U54HG006348 from the NIH and PRJ71TN from DOD/NAVSEA.
References
- 1.Kluth DC, Rees AJ. J Am Soc Nephrol. 1999;10:2446–2453. doi: 10.1681/ASN.V10112446. [DOI] [PubMed] [Google Scholar]
- 2.Jennette JC. Kidney Int. 2003;63:1164–1177. doi: 10.1046/j.1523-1755.2003.00843.x. [DOI] [PubMed] [Google Scholar]
- 3.Sharma KV, Venkatesan AM, Swerdlow D, DaSilva D, Beck A, Jain N, Wood BJ. Tech Vasc Interv Radiol. 2010;13:100–109. doi: 10.1053/j.tvir.2010.02.005. [DOI] [PMC free article] [PubMed] [Google Scholar]
- 4.Andrews PM, Chen Y. J Nephrol Ther. 2014;4:1–5. [Google Scholar]
- 5.Mishra A, Tarsin R, ElHabbash B, Zagan N, Markus R, Drebeka S, AbdElmola K, Shawish T, Shebani A, AbdElmola T, ElUsta A, Ehtuish EF. Indian Journal of Nephrology. 2010;20:76–79. doi: 10.4103/0971-4065.65299. [DOI] [PMC free article] [PubMed] [Google Scholar]
- 6.Yesudas SS, Georgy NK, Manickam S, Raheena A, Monai RC, Noble BA, Pillai A. Indian Journal of Nephrology. 2010;20:137–141. doi: 10.4103/0971-4065.70844. [DOI] [PMC free article] [PubMed] [Google Scholar]
- 7.Patel PJ. Urol Int. 1986;41:289–291. doi: 10.1159/000281220. [DOI] [PubMed] [Google Scholar]
- 8.Page JE, Morgan SH, Eastwood JB, Smith SA, Webb DJ, Dilly SA, Chow J, Pottier A, Joseph AE. Clin Radiol. 1994;49:867–870. doi: 10.1016/s0009-9260(05)82877-6. [DOI] [PubMed] [Google Scholar]
- 9.Huang D, Swanson EA, Lin CP, Schuman JS, Stinson WG, Chang W, Hee MR, Flotte T, Gregory K, Puliafito CA. Science. 1991;254:1178–1181. doi: 10.1126/science.1957169. [DOI] [PMC free article] [PubMed] [Google Scholar]
- 10.Zysk AM, Nguyen FT, Oldenburg AL, Marks DL, Boppart SA. J Biomed Opt. 2007;12:051403. doi: 10.1117/1.2793736. [DOI] [PubMed] [Google Scholar]
- 11.Andrews PM, Chen Y, Onozato ML, Huang SW, Adler DC, Huber RA, Jiang J, Barry SE, Cable AE, Fujimoto JG. Lab Invest. 2008;88:441–449. doi: 10.1038/labinvest.2008.4. [DOI] [PubMed] [Google Scholar]
- 12.Morita T, Suzuki Y, Churg J. Am J Pathol. 1973;72:349–368. [PMC free article] [PubMed] [Google Scholar]
- 13.Fujimoto JG, Pitris C, Boppart SA, Brezinski ME. Neoplasia (New York, NY) 2000;2:9–25. doi: 10.1038/sj.neo.7900071. [DOI] [PMC free article] [PubMed] [Google Scholar]
- 14.McLaughlin RA, Quirk BC, Curatolo A, Kirk RW, Scolaro L, Lorenser D, Robbins PD, Wood BA, Saunders CM, Sampson DD. IEEE J Sel Top Quantum Electron. 2012;18:1184–1191. [Google Scholar]
- 15.Lorenser D, Yang X, Kirk RW, Quirk BC, McLaughlin RA, Sampson DD. Opt Lett. 2011;36:3894–3896. doi: 10.1364/OL.36.003894. [DOI] [PubMed] [Google Scholar]
- 16.Chen Y, Andrews PM, Aguirre AD, Schmitt JM, Fujimoto JG. J Biomed Opt. 2007;12:034008. doi: 10.1117/1.2736421. [DOI] [PubMed] [Google Scholar]
- 17.Ramos JL, Li Y, Huang D. Clin Experiment Ophthalmol. 2009;37:81–89. doi: 10.1111/j.1442-9071.2008.01823.x. [DOI] [PMC free article] [PubMed] [Google Scholar]
- 18.Betz CS, Volgger V, Silverman SM, Rubinstein M, Kraft M, Arens C, Wong BJF. Head Neck Oncol. 2013;5:35. [Google Scholar]
- 19.Bezerra HG, Costa MA, Guagliumi G, Rollins AM, Simon DI. JACC Cardiovasc Interv. 2009;2:1035–1046. doi: 10.1016/j.jcin.2009.06.019. [DOI] [PMC free article] [PubMed] [Google Scholar]
- 20.Steiner R, Kunzi-Rapp K, Scharffetter-Kochanek K. Med Laser Appl. 2003;18:249–259. [Google Scholar]
- 21.Wang S, Liu CH, Zakharov VP, Lazar AJ, Pollock RE, Larin KV. J Biomed Opt. 2014;19:21102. doi: 10.1117/1.JBO.19.2.021102. [DOI] [PubMed] [Google Scholar]
- 22.Liu C-H, Qi J, Lu J, Wang S, Wu C, Shih W-C, Larin KV. Journal of Innovative Optical Health Sciences. 2014:1550006. [Google Scholar]
- 23.Barwari K, de Bruin DM, Faber DJ, van Leeuwen TG, de la Rosette JJ, Laguna MP. BJU International. 2012;110:E415–E420. doi: 10.1111/j.1464-410X.2012.11197.x. [DOI] [PubMed] [Google Scholar]
- 24.Emelianov SY, Lubinski MA, Weitzel WF, Wiggins RC, Skovoroda AR, O'Donnell M. Ultrasound Med Biol. 1995;21:871–883. doi: 10.1016/0301-5629(94)00146-5. [DOI] [PubMed] [Google Scholar]
- 25.Wang L, Xia P, Lv K, Han J, Dai Q, Li XM, Chen LM, Jiang YX. Eur J Radiol. 2014;24:1694–1699. doi: 10.1007/s00330-014-3162-5. [DOI] [PubMed] [Google Scholar]
- 26.Mariappan YK, Glaser KJ, Ehman RL. Clin Anat. 2010;23:497–511. doi: 10.1002/ca.21006. [DOI] [PMC free article] [PubMed] [Google Scholar]
- 27.Korsmo MJ, Ebrahimi B, Eirin A, Woollard JR, Krier JD, Crane JA, Warner L, Glaser K, Grimm R, Ehman RL, Lerman LO. Invest Radiol. 2013;48:61–68. doi: 10.1097/RLI.0b013e31827a4990. [DOI] [PMC free article] [PubMed] [Google Scholar]
- 28.Wang S, Larin KV. Opt Lett. 2014;39:41–44. doi: 10.1364/OL.39.000041. [DOI] [PMC free article] [PubMed] [Google Scholar]
- 29.Schmitt J. Opt Express. 1998;3:199. doi: 10.1364/oe.3.000199. [DOI] [PubMed] [Google Scholar]
- 30.Sticker M, Hitzenberger CK, Leitgeb R, Fercher AF. Opt Lett. 2001;26:518–520. doi: 10.1364/ol.26.000518. [DOI] [PubMed] [Google Scholar]
- 31.Wang RK, Kirkpatrick S, Hinds M. Appl Phys Lett. 2007;90:164105. [Google Scholar]
- 32.Rogowska J, Patel NA, Fujimoto JG, Brezinski ME. Heart. 2004;90:556–562. doi: 10.1136/hrt.2003.016956. [DOI] [PMC free article] [PubMed] [Google Scholar]
- 33.Wang S, Li JS, Manapuram RK, Menodiado FM, Ingram DR, Twa MD, Lazar AJ, Lev DC, Pollock RE, Larin KV. Opt Lett. 2012;37:5184–5186. doi: 10.1364/OL.37.005184. [DOI] [PMC free article] [PubMed] [Google Scholar]
- 34.Li J, Wang S, Singh M, Aglyamov S, Emelianov S, Twa MD, Larin KV. Laser Phys Lett. 2014;11:065601. doi: 10.1088/1612-2011/10/7/075605. [DOI] [PMC free article] [PubMed] [Google Scholar]
- 35.Wang S, Larin KV. Biomed Opt Express. 2014;5:3807–3821. doi: 10.1364/BOE.5.003807. [DOI] [PMC free article] [PubMed] [Google Scholar]
- 36.Wu C, Han Z, Wang S, Li J, Singh M, Liu CH, Aglyamov S, Emelianov S, Manns F, Larin KV. Invest Ophthalmol Vis Sci. 2015;56:1292–1300. doi: 10.1167/iovs.14-15654. [DOI] [PMC free article] [PubMed] [Google Scholar]
- 37.Es'haghian S, Kennedy KM, Gong P, Sampson DD, McLaughlin RA, Kennedy BF. J Biomed Opt. 2015;20:16013. doi: 10.1117/1.JBO.20.1.016013. [DOI] [PubMed] [Google Scholar]
- 38.Kennedy KM, Es'haghian S, Chin L, McLaughlin RA, Sampson DD, Kennedy BF. Opt Lett. 2014;39:3014–3017. doi: 10.1364/OL.39.003014. [DOI] [PubMed] [Google Scholar]
- 39.Wang S, Larin KV. J Biophotonics. 2015;8:279–302. doi: 10.1002/jbio.201400108. [DOI] [PMC free article] [PubMed] [Google Scholar]
- 40.Nguyen TM, Song S, Arnal B, Wong EY, Huang Z, Wang RK, O'Donnell M. J Biomed Opt. 2014;19:16013. doi: 10.1117/1.JBO.19.1.016013. [DOI] [PMC free article] [PubMed] [Google Scholar]
- 41.Qi W, Li R, Ma T, Kirk Shung K, Zhou Q, Chen Z. Applied Physics Letters. 2014;104:123702. doi: 10.1063/1.4869562. [DOI] [PMC free article] [PubMed] [Google Scholar]
- 42.Song S, Le NM, Huang Z, Shen T, Wang RK. Opt Lett. 2015;40:5007–5010. doi: 10.1364/OL.40.005007. [DOI] [PubMed] [Google Scholar]
- 43.Wang S, Larin KV, Li JS, Vantipalli S, Manapuram RK, Aglyamov S, Emelianov S, Twa MD. Laser Phys Lett. 2013;10 doi: 10.1088/1612-2011/10/7/075605. [DOI] [PMC free article] [PubMed] [Google Scholar]
- 44.Xie C, Sharma R, Wang H, Zhou XJ, Mohan C. J Immunol. 2004;172:5047–5055. doi: 10.4049/jimmunol.172.8.5047. [DOI] [PubMed] [Google Scholar]
- 45.Xie C, Rahman ZS, Xie S, Zhu J, Du Y, Qin X, Zhou H, Zhou XJ, Mohan C. Int Immunol. 2008;20:719–728. doi: 10.1093/intimm/dxn030. [DOI] [PubMed] [Google Scholar]
- 46.Manapuram RK, Manne VGR, Larin KV. Laser Phys. 2008;18:1080–1086. [Google Scholar]
- 47.Larin KV, Motamedi M, Ashitkov TV, Esenaliev RO. Phys Med Biol. 2003;48:1371–1390. doi: 10.1088/0031-9155/48/10/310. [DOI] [PubMed] [Google Scholar]
- 48.Song S, Huang Z, Wang RK. J Biomed Opt. 2013;18:121505. doi: 10.1117/1.JBO.18.12.121505. [DOI] [PubMed] [Google Scholar]
- 49.Meneses J, Gharbi T, Humbert P. Appl Opt. 2005;44:1207–1215. doi: 10.1364/ao.44.001207. [DOI] [PubMed] [Google Scholar]
- 50.Capanni A, Pezzati L, Bertani D, Cetica M, Francini F. Optical Engineering. 1997;36:2466–2472. [Google Scholar]
- 51.Han Z, Li J, Singh M, Wu C, Liu CH, Wang S, Idugboe R, Raghunathan R, Sudheendran N, Aglyamov SR, Twa MD, Larin KV. Phys Med Biol. 2015;60:3531–3547. doi: 10.1088/0031-9155/60/9/3531. [DOI] [PMC free article] [PubMed] [Google Scholar]
- 52.Lai KW, Hum YC, Salim MIM, Ong S-B, Utama NP, Myint YM, Noor NM, Supriyanto E. Advances in Medical Diagnostic Technology. Springer; Singapore: 2014. [Google Scholar]
- 53.Afshari E, Najarian S. Proceeding of World Academy of Science, Tokyo, Japan: Engineering and Technology (ICMS) 2009;41:378–381. [Google Scholar]
- 54.Cortes C, Vapnik V. Machine Learning. 1995;20:273–297. [Google Scholar]
- 55.Chang CC, Lin CJ. ACM Trans Intell Syst Technol. 2011;2:27. [Google Scholar]
- 56.Keerthi SS, Lin CJ. Neural Comput. 2003;15:1667–1689. doi: 10.1162/089976603321891855. [DOI] [PubMed] [Google Scholar]
- 57.Camps-Valls G, Gomez-Chova L, Calpe-Maravilla J, Martin-Guerrero JD, Soria-Olivas E, Alonso-Chorda L, Moreno J. Geoscience and Remote Sensing, IEEE Transactions on. 2004;42:1530–1542. [Google Scholar]
- 58.Min JH, Lee YC. Expert Systems with Applications. 2005;28:603–614. [Google Scholar]
- 59.Youtz C, Fienberg SE, Hoaglin DC, Kruskal WH, Tanur JM. A Statistical Model: Frederick Mosteller’s Contributions to Statistics, Science, and Public Policy. Springer Science & Business Media; 2012. [Google Scholar]
- 60.Newcombe RG. Stat Med. 1998;17:857–872. doi: 10.1002/(sici)1097-0258(19980430)17:8<857::aid-sim777>3.0.co;2-e. [DOI] [PubMed] [Google Scholar]
- 61.Ng YY, Fan JM, Mu W, Nikolic-Paterson DJ, Yang WC, Huang TP, Atkins RC, Lan HY. Nephrol Dial Transplant. 1999;14:2860–2872. doi: 10.1093/ndt/14.12.2860. [DOI] [PubMed] [Google Scholar]
- 62.Cattell V, Jamieson SW. Lab Invest. 1978;39:584–590. [PubMed] [Google Scholar]
- 63.Li Q, Onozato ML, Andrews PM, Chen CW, Paek A, Naphas R, Yuan S, Jiang J, Cable A, Chen Y. Opt Express. 2009;17:16000–16016. doi: 10.1364/OE.17.016000. [DOI] [PubMed] [Google Scholar]
- 64.Liang CP, Wierwille J, Moreira T, Schwartzbauer G, Jafri MS, Tang CM, Chen Y. Opt Express. 2011;19:26283–26294. doi: 10.1364/OE.19.026283. [DOI] [PMC free article] [PubMed] [Google Scholar]
- 65.Amador C, Urban MW, Chen S, Greenleaf JF. IEEE Trans Ultrason Ferroelectr Freq Control. 2011;58:2608–2619. doi: 10.1109/TUFFC.2011.2124. [DOI] [PMC free article] [PubMed] [Google Scholar]
- 66.Li J, Han Z, Singh M, Twa MD, Larin KV. J Biomed Opt. 2014;19:110502. doi: 10.1117/1.JBO.19.11.110502. [DOI] [PMC free article] [PubMed] [Google Scholar]
- 67.Han Z, Li J, Singh M, Aglyamov SR, Wu C, Liu CH, Larin KV. Appl Phys Lett. 2015;106:233702. doi: 10.1063/1.4922728. [DOI] [PMC free article] [PubMed] [Google Scholar]
- 68.Zhang Y, Wu L. Sensors (Basel) 2012;12:12489–12505. doi: 10.3390/s120912489. [DOI] [PMC free article] [PubMed] [Google Scholar]
- 69.Grenier N, Gennisson JL, Cornelis F, Le Bras Y, Couzi L. Ultrasound Clin. 2013;8:551–564. doi: 10.1016/j.diii.2013.02.003. [DOI] [PubMed] [Google Scholar]
- 70.Singh M, Wu C, Liu CH, Li J, Schill A, Nair A, Larin KV. Opt Lett. 2015;40:2588–2591. doi: 10.1364/OL.40.002588. [DOI] [PMC free article] [PubMed] [Google Scholar]
Associated Data
This section collects any data citations, data availability statements, or supplementary materials included in this article.
Supplementary Materials
Elastic wave propagation in the typical healthy (upper) and nephritic kidneys (lower) at 2 ms after excitation.


