Abstract
Individualized modeling and simulation of blood flow mechanics find applications in both animal research and patient care. Individual animal or patient models for blood vessel mechanics are based on combining measured vascular geometry with a fluid structure model coupling formulations describing dynamics of the fluid and mechanics of the wall. For example, one-dimensional fluid flow modeling requires a constitutive law relating vessel cross-sectional deformation to pressure in the lumen. To investigate means of identifying appropriate constitutive relationships, an automated segmentation algorithm was applied to micro-computerized tomography (CT) images from a mouse lung obtained at four different static pressures to identify the static pressure-radius relationship for 4 generations of vessels in the pulmonary arterial network. A shape-fitting function was parameterized for each vessel in the network to characterize the nonlinear and heterogeneous nature of vessel distensibility in the pulmonary arteries. These data on morphometric and mechanical properties were used to simulate pressure and flow velocity propagation in the network using one-dimensional representations of fluid and vessel wall mechanics. Moreover, wave intensity analysis was used to study effects of wall mechanics on generation and propagation of pressure wave reflections. Simulations were conducted to investigate the role of linear versus nonlinear formulations of wall elasticity and homogeneous versus heterogeneous treatments of vessel wall properties. Accounting for heterogeneity, by parameterizing the pressure/distention equation of state individually for each vessel segment, was found to have little effect on the predicted pressure profiles and wave propagation compared to a homogeneous parameterization based on average behavior. However, substantially different results were obtained using a linear elastic thin shell model than were obtained using a nonlinear model that has a more physiologically realistic pressure versus radius relationship.
Keywords: arterial blood flow, vessel mechanics, heterogeneity, pulmonary arterial network, pressure-radius relationship, wave intensity analysis
Introduction
Cardiovascular modeling and simulation applications are increasingly using image-based fluid-structure interaction modeling to simulate blood flow and blood vessel mechanics ((Taylor and Figueroa 2009), (Kim et al. 2009), (Kim et al. 2010), (van de Vosse and Stergiopulos 2011), (Tang et al. 2011), (Reymond et al. 2012), (Xiao et al. 2013), (Cuomo et al. 2015), (Samyn et al. 2015), (Schiavazzi et al. 2015), (Trachet et al. 2015)). Compared to lumped-parameter models, one- and three-dimensional models that simulate spatially distributed mechanics in vascular networks have the advantage that they more accurately represent the detailed fluid and wall mechanics as well as wave propagation and reflection in arterial networks ((Xiao et al. 2013), (Qureshi et al. 2014)). In particular, the one-dimensional fluid dynamical network framework is robust and computationally efficient if the focus of analysis is to simulate the effects of global network hemodynamics instead of detailed local analysis of fluid-structure interaction.
Combining current imaging technology with image segmentation and geometric meshing tools, patient-specific models of systemic arterial mechanics have been used to investigate the effects of individualized geometry in cases on aortic stenosis ((LaDisa et al. 2011), (Coogan et al. 2013)), coronary artherosclerosis ((Huo et al. 2007), (Kim et al. 2010), (Waters et al. 2011), (Sommer et al. 2014)), and congenital heart disease ((Migliavacca et al. 2006), (Spilker et al. 2007)).
Applications in this area require definition of the model geometry, imposition of inlet and outlet boundary conditions and constitutive laws defining the mechanical properties of vessel walls ((Olufsen 1999), (Spilker et al. 2007), (Lammers et al. 2008), (Olufsen et al. 2012)). These inputs not only predict hemodynamical states but also determine the shape of the pulse waveforms, which is influenced by arterial compliance and the coefficient of wave reflection (Caro 2012). On account of wall mechanics, many three-dimensional models employ two-dimensional wall models accounting for perpendicular (axial and circumferential) stresses arising from vessel wall deformation ((Gleason et al. 2004), (Morrison et al. 2009), (Liu et al. 2011)). In both one- and three-dimensional models the ability to effectively predict arterial pressure based on measured inlet flow depends critically on the validity of the pressure/deformation model used for the vessel wall. While vessel wall mechanics have been investigated in detail in the context of three-dimensional models ((Liu et al. 2011), (Xiao et al. 2013)), substantially less attention has been paid to the formulation of the vessel constitutive relations used for one-dimensional models.
Commonly used one-dimensional models use a constitutive relationship to define the relationship between lumen pressure and radius that assumes that the vascular tissues are incompressible, isotropic, and Hookean (or linearly elastic) within the physiological pressure range. Moreover, the vessel wall is assumed to be thin and, due to in vivo tethering, longitudinal and radial stresses are considered negligible compared to the circumferential stress ((Olufsen 1999), (Sherwin et al. 2003)). The 1D equation of state instantaneously relates transmural pressure with vessel distension. One problem with these models is that they predict either arterial burst at a finite but abnormally high transmural pressure ((Pedley 1980), (Olufsen 1999)) or arterial buckle at a negative transmural pressure ((Sherwin et al. 2003), (Nichols 1998)). In reality, the arterial wall behavior is non-linear and viscoelastic (Valdez-Jasso et al. 2011) and it changes as the arterial tree diverges progressively downstream (Yen et al. 1980). Valdez-Jasso et al. used data from Ovine systemic arteries showing that nonlinear stiffening is important in the large vessels (the aorta) but not in the smaller arteries (e.g. carotid) (Valdez-Jasso et al. 2011). This conclusion is similar to the one made by Reymond et al. (Reymond et al. 2011) who used Langewouters’ model (Langewouters et al. 1985) to predict compliance as a function of pressure in the aorta and abdominal arteries whereas the empirical estimate of compliance were obtained using published values of local pulse wave velocity (PWV) and the Bramwell and Hill equation (J.C. Bramwell 1922). Olufsen et al. used literature data to determine vessel stiffness in the systemic arteries as a function of vessel radius to account for the spatially varying arterial elasticity (Olufsen 1999) and used this function in the linear elastic wall model. This, however, assumed that the arteries of similar radius have the same elastic behavior and thus neglected the arterial wall heterogeneity observed in this study. As for the non-linear elastic behavior, in the past many investigators suggested to account for the non-linear wall mechanics by using ad-hoc models (or empirical functions) obtained by fitting experimental data to non-linear pressure area relations (e.g. (Vander Werff 1974), (Raines et al. 1974), (Langewouters et al. 1984)). More recently, in addition to the nonlinear elasticity, vessel mechanics studies also focused on adding viscoelasticity to the arterial wall models ((Steele et al. 2011), (Reymond et al. 2011), (Valdez-Jasso et al. 2011)). A fundamental restrain in adopting a viscoelastic approach is the scarcity of dynamic pressure area data in multiple arteries and therefore little work has been done to analyze heterogeneity in vessel viscoelasticity within the network.
The potential effects of non-linear heterogeneous wall mechanics in one-dimensional network framework extend to the prediction of wave propagation. This includes the types of wave reflections and their propagating velocity, which in turn determine the shape and amplitude of the pressure pulse. Since the PWV directly depends on the pressure area relation, significant changes in the wave shape due to wave transit times may be characterized while switching from one wall model to another one in a network setting. Moreover, the coefficient of wave reflection (R) at a junction is determined by impedance relation between parent and daughter vessels, which depends on the wall model of individual vessel (Caro 2012). For insight into one-dimensional wave propagation in network models, many investigators (e.g. (Alastruey et al. 2009), (Qureshi et al. 2014), (Mynard and Smolich 2015)) have used the time domain method of wave intensity analysis (WIA) (Parker and Jones 1990). Provided that the PWV is known the WIA facilitates the decomposition of pulse wave into its incident and reflected components in the time domain. However, these studies use linear thin-wall models to predict the wave propagation and do not discuss the effects of wall mechanics on the simulations.
Some of the above questions have been discussed at length for the systemic arteries but only a few studies ((Li and Cheng 1993), (Qureshi et al. 2014)) have highlighted the issue in reference to pulmonary arteries. The pulmonary arterial network is a low-pressure and rapidly branching system. Due to the anatomical and functional differences the behavior and the distribution of compliance among the pulmonary arteries is significantly different than their systemic counterparts. Unlike aorta, where 80% of the total compliance of the systemic arterial tree is located ((Huo et al. 2007), (Saouti et al. 2010)), there is no dominant flow path in the pulmonary arterial tree and hence the spatial compliance distribution and arterial wall heterogeneity is expected to be different than the systemic arteries.
The goals of the current study are to compare linear and nonlinear elastic constitutive models in one-dimensional pulmonary arterial network models; investigate the sensitivity of simulated pressure pulse to the number of generations included in the arterial tree; and to investigate the impact of heterogeneity of vessel properties on pulsatile mechanics and the wave propagation in the network. To do so, this study sets up a one-dimensional fluid dynamics model with geometry obtained from micro-computed tomography data from a mouse lung (Vanderpool et al. 2011). The one-dimensional fluid dynamics model calibrated using static pressure measurements is solved in geometries extracted from mice arterial networks. Incident and reflected wave components are separately simulated using the WIA to characterize the effects of heterogeneous wall mechanics on aspects of wave propagation.
Vanderpool et al. imaged the pulmonary vasculature in a healthy normal mouse at four different static filling pressures. From the raw image data it is possible to identify the pressure-radius relationship in 13 vessels spanning up to 3 branching orders with vessel lengths from 0.44 mm to 5.3 mm and radii from 0.25 to 0.6 mm. A vessel is defined as a continuous unbranched length of artery connecting two neighboring branch points. This representation allows us to characterize the heterogeneity in distensibility in all vessels within the first four generations of the pulmonary arterial network, and to determine a relationship between distensibility and vessel size and position within the network. We employ two different constitutive laws to represent the data on pressure versus area in the pulmonary vessels based on a linear and nonlinear thin-wall approximation. Furthermore, we compare the behavior of a homogenous version of the model where each vessel is represented by the mean properties from the whole network with a heterogeneous model where the constitutive law for each vessel is parameterized based on data from that individual vessel. To compare the behaviors of the different network representations we simulate open-loop systems driven by an a priori prescribed cardiac output with fixed network outlet boundary conditions represented by the two-element Windkessel model.
These comparisons are designed to provide insight into if and how the fluid-structure interactions in pulmonary arterial network may be approximated using a homogenous linear representation of the one-dimensional constitutive law. These comparisons reveal that the homogeneous simplification effectively captures the pulsatile pressure profile and wave propagation obtained for the heterogeneous parameterization of the system. However, flow and pressure predicted using the nonlinear pressure-radius relationship diverges substantially from the ones predicted with the linear wall model.
Materials and Methods
Segmentation of micro computerized tomography (CT) images
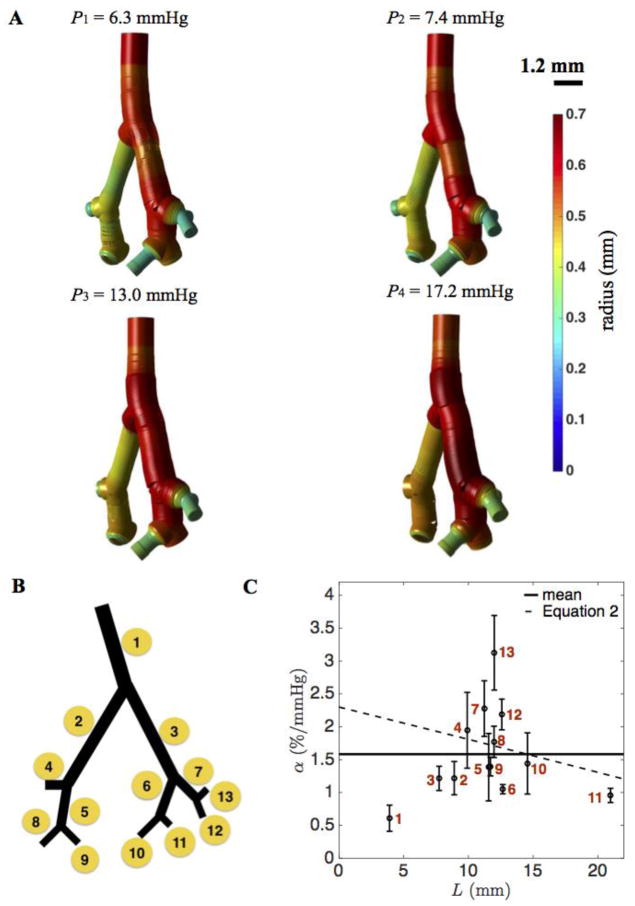
Stacked planar X-ray micro CT images from a normal mouse lung were analyzed and segmented to quantitatively represent vessel dimensions and connectivities in the pulmonary vasculature. The image data were obtained as described in Vanderpool et al. (Vanderpool et al. 2011). In brief, arterial trees were imaged at four different static filling pressures, P1 = 6.3, P2 = 7.4, P3 = 13.0, and P4 = 17.2 mmHg to assess vascular structure and function, including distensibility, throughout the network. The images were obtained in perfused, ventilated lungs after treatment with a Rho kinase inhibitor to abolish smooth muscle tone, which modulates arterial diameter and distensibility ((Tabima and Chesler 2010), (Vanderpool et al. 2011)). Here data from one normal control mouse were analyzed to characterize the heterogeneity in vessel mechanics in an individual. Image segmentations at the four filling pressures are visualized in Figure 1.
Figure 1. Heterogeneous mechanical properties of the pulmonary arterial network.
A. Segmented images of the pulmonary arterial network of four generations obtained by Vanderpool et al. (2011) at four different static pressures. B. Vessel indexing (1 – 13) of the pulmonary arterial network from one to four generations. C. The distribution of distensibility α plotted as a function of path length L from main pulmonary artery. For the largest three vessel segments (lowest values of L) α is estimated to be 0.84 and 1.2 % per mmHg, as described in text. Error bar plots indicate the mean and standard deviation from the variation of distensibility in each vessel. The mean value of distributed distensibility is shown as solid line. The monotonically decreasing distensibility in terms of L (dotted curve) is from Equation (2).
Estimation of pulmonary arterial distensibility
Distensibility, a measure of the percent change in vessel diameter per change in pressure, is defined a number of different ways in the literature. From Vanderpool et al., direct measurements of the distensibility of the extralobar right pulmonary artery (RPA) measured over the pressure range 6.3 to 17.2 mmHg yielded an average distensibility αRPA = 2.5 ± 1.1 %/mmHg (n=8), based on the formula
| (1) |
where D(x,P) is the arterial diameter along the principal pathway at a distance x from the main pulmonary artery inlet and transmural pressure P. Indirect measurements of the distensibility of the whole lung were also obtained using a morphometric model of arterial diameters along the principal pathway (Molthen et al. 2004) as
| (2) |
where D(0,0) is the diameter of the main pulmonary artery (x = 0) at zero-pressure, Ltot is the total length of the principal pathway, and c is a measure of the taper of the principal pathway. These calculations yielded an average of αlung = 2.3 ± 0.8 %/mmHg (n=8).
Here, based on a linear regression of radius versus pressure, we compute an estimate of distensibility as the slope of radius versus pressure divided by radius at the zero-pressure intercept.
Pressure-radius relationship in pulmonary arterial tree
The observed radius for an individual vessel and at a given pressure level was taken as the average estimated radius along the length of the vessel. The nonlinear empirical function used to fit the observed relationship between luminal pressure and radius is given by
| (3) |
where r0, r1, Pa, and Pb are fitting parameters, similar to Langewouters et al. (Langewouters et al. 1984). It was determined that effective fits to the data could be obtained by assuming that the parameters r0 and r1 can be calculated from the observed radii at pressures P1 and P4 via simple proportionalities
| (4) |
where a and b are global parameters that take the same values for the every vessel in the vascular tree. Therefore obtaining the best fits for Equation (3) to the data for each individual vessel involves simultaneously estimating the global parameters (a, b) and the individual parameters {Pa}i and {Pb}i for each vessel in the network. Parameters are estimated by numerical minimization of the sum of squared differences between the model of Equation (3) and the data.
We compare the nonlinear model with a linear elastic thin-shell model (Olufsen 1999)
| (5) |
where the wall stiffness and thickness are E and h. In this model P0 is the extraluminal pressure, A is the cross-sectional area, A0 is the cross-sectional area at P = P0, and r0 is the radius at P = P0. For each vessel, the parameters P0, r0, and Eh/r0 are estimated from the data on radius versus pressure. The stiffness parameter Eh/r0 is inversely proportional to the distensibility α: Eh/r0 = 3/(4α) (Olufsen et al. 2012), which varies with the radius r0.
1D Navier-Stokes equations for elastic pulmonary arteries
Blood flow in the network is simulated using the one-dimensional Navier-Stokes equations for a Newtonian fluid ((Formaggia et al. 2001), (Smith et al. 2002), (Sherwin et al. 2003)) of the form
| (6) |
where the variable q(s,t) is the volume flow rate (volume per unit time passing through a vessel lumen at axial position s at time t), the variable A(s,t) is the lumen cross-sectional area, and the variable p(s,t) is the pressure. This equation is obtained assuming a Stokes-layer velocity profile in a cylinder (Olufsen 1999). The parameters ρ, υ, and δ are blood density, kinematic viscosity, and boundary layer thickness, and are set to ρ = 1 g/mL, υ = 0.0528 cm2/s, and δ = 40 μm (Olufsen 1999). Mass conservation is enforced by the continuity equation
| (7) |
The third equation needed to specify the system of three variables is the constitutive law relating cross-sectional area and pressure, which is imposed via Equation (3) or (5).
The constitutive equation used represents one of the major simplifying assumptions of the one-dimensional modeling framework. Furthermore, in comparison to 3D models, important features such as significant flow disturbances at bifurcations, sudden changes in cross-sectional areas and circumferentially varying wall properties are not fully resolved by 1D models (Formaggia et al. 2003; Grinberg et al. 2011; Morris et al. 2015; Shi et al. 2011; Taelman et al. 2013; Xiao et al. 2014).
Boundary conditions
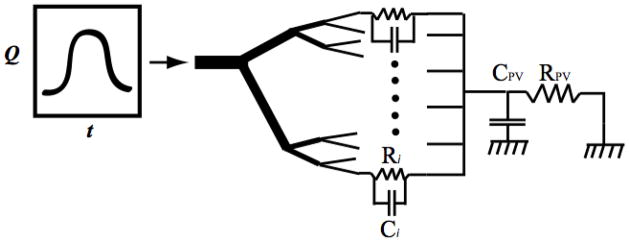
Within the network mass conservation is imposed so that the sum of flows into a branch point is equal to the sum of outgoing flows. In addition, pressure is continuous at all branch points. Pulsatile simulations are conducted by imposing an inflow boundary condition on the main trunk inlet and the pressure on terminal outlets via Windkessel models, as illustrated in Figure 2. The outflow pressure in each terminal arteriole is obtained using a two-element Windkessel model relating the flow and pressure in the distal small arteries and the capillary bed:
| (8) |
where PPA,out,i and qPA,out,i correspond to the i’th terminal vessel. We assume the capillary resistance Ri is inversely proportional to the observed cross sectional area of terminal vessels at P = 6.3 mmHg, and the capacitance of the capillary bed, Ci is proportional to the cross sectional area of terminal vessels at P = 6.3 mmHg:
| (9) |
where Ai is the observed cross-sectional area of outlet vessel i.
Figure 2. Schematic description of the 1D model with 4 generations of vasculature.
The terminal arteries/capillary and venous Windkessel outer boundary parameters are (Ri, Ci) and (RPV, CPV).
Flow into the venous capacitance is computed as
| (10) |
where the venous pressure is deteremined by the venous volume and the capacitance as follows:
| (11) |
The RC parameters (RPV,CPV) are constant in each generation model. Resistance RPV is set to 92 mmHg s/mL to give a mean pressure of 10 mmHg in the venous capacitor (CPV) for the input flow that is used here. The value of CPV is set to 5.0 × 10⁻⁴ mL/mmHg.
Pulsatile blood flow is simulated using a periodic pulse inflow boundary condition on the main pulmonary artery and prescribing the outflow pressures by RC Windkessel boundary models. The input pulse is specified as a square pulse train with smoothed edges to avoid infinitely fast transitions:
| (12) |
The variable θ ∈ (0,1) is the fraction of the cardiac cycle elapsed at time t. For period T, θ(t) is calculated as θ = modulus (t,T)/T, where the “modulus” is the remainder of the divisions of t by T. The parameters in Equation (12) are set to the following values: θ1 = 0.14, θ2 = 0.39, θ3 = 0.02, Q0 = 0.38 mL/sec, and T = 0.1 sec for the pulsatile simulations described below.
Note that the intent here is not to simulate an in vivo pressure or flow wave, but rather to drive the model over a dynamic range similar to that found in vivo in order to compare and contrast different ways of treating the heterogeneity in the mechanics.
Blood flow simulations
The system of equations is solved using a finite difference method described in detail in the Appendix. A consensus network is used with 13 vessels and vessel lengths ranging from 0.44 to 5.3 mm and radii ranging from 0.25 to 0.6 mm (at the minimum pressure). Each vessel is discretized with the space step determined by the segmentation algorithm, yielding a total of 501 grid points for all vessels in the network. The numerical method is validated by determining that the results converge as space and time step sizes are reduced. When the grid is refined from N to 2N, the time step dt is refined as dt/4. The overall convergence rate is of second order as shown in Table 3. Here, and are the average errors of pressure and volume flow rate between grid N and grid 2N in L2 norm through one cardiac cycle. The convergence ratio is the ratio of .
Table 3.
Numerical validation: overall convergence
| Grid number N | Error, | Error, | Convergence ratio, | Convergence ratio, |
|---|---|---|---|---|
| 32 | 0.1294 | 1.656e-4 | 3.4771 | 3.1449 |
| 64 | 0.0390 | 5.268e-5 | 3.8235 | 3.7918 |
| 128 | 0.0102 | 1.389e-5 |
To address the impact of the linear versus nonlinear, homogeneous versus heterogeneous wall model comparisons are done in the large 13 vessel network. These simulations compare pressure and velocity profiles as well as the wave propagation. The latter is assessed using wave intensity analysis.
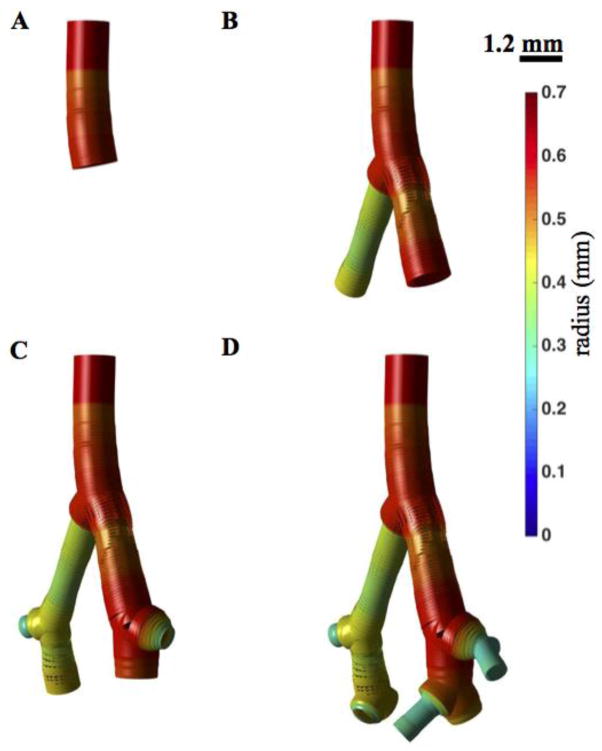
To determine the impact of network size, blood flow simulations are made in four network geometries with 1, 2, 3, and 4 generations (see Figure 5). These simulations are done using the heterogeneous nonlinear wall model.
Figure 5. Pulmonary arterial network from one to four generations.
A–D. Four network models are illustrated, including 1 (A), 2 (B), 3 (C), and 4 (D) vessel orders. The radius distribution (at static pressure 6.3 mmHg) is shown with a color map.
Wave Intensity Analysis
The simulated pressure and velocity waveforms are decomposed into their incident and reflected components using the wave intensity analysis (WIA) (Parker and Jones 1990). Briefly, setting q = AU, where U is the average blood flow velocity in the cross-sectional area, and assuming that the blood vessels are elastic, frictional losses are negligible and vessel wall properties remain constant along the vessel, one may decompose the pressure and velocity waveforms via method of characteristics solution of governing hyperbolic system, which yields
| (13) |
where
| (14) |
Here, dP and dU are the infinitesimal wave elements, occasionally referred as ‘wavefronts’, which are computed by fragmenting the pressure and velocity waveforms by finite differencing the digitized data (Parker 2009). Also c is the pressure dependent PWV computed by Bramwell-Hill equation (J.C. Bramwell 1922), as
| (15) |
Here C is the vessel compliance, which is inversely proportional to the square of PWV. The PWV for linear and non-linear elastic wall models from Equations (3) and (5) are respectively given by
| (16) |
The wave intensities corresponding to separated wave components are defined as
| (17) |
which has units of W/mm2s2. WI+ with dP+ > 0 or dP+< 0 indicates the existence of incident compression or decompression waves. Similarly WI− with dP− > 0 or dP− < 0 indicate the existence of reflected compression or decompression waves, respectively. Incident compression and reflected decompression waves are of accelerating nature and vice versa.
Results
Distensibility from pressurized vasculature
Figure 1A shows a visualization of the segmented networks obtained at the four different pressure conditions used to characterize vessel stiffness/distensibility throughout the pulmonary arterial network from Vanderpool et al. (Vanderpool et al. 2011). Each of the 13 vessels in the network is assigned an index, with the main pulmonary artery labeled as vessel 1 and terminal vessels labeled 4, 8, 9, 10, 11, 12, and 13, as illustrated in Figure 1B. The estimated radii and length of each vessel at the four static pressures are listed in Table 1. These data on lengths and radii, along with the vessel connectivities in Figure 1, represent all of the information used to simulate one-dimensional blood flow and fluid-structure interactions in the network.
Table 1.
The geometry of pressurized pulmonary arterial vessels.
| Vessel ID | Vessel Length (mm) | r0 (mm) | r1 (P1 = 6.3 mmHg) | r2 (P2 = 7.4 mmHg) | r3 (P3 = 13.0 mmHg) | r4 (P4 = 17.2mmHg) |
|---|---|---|---|---|---|---|
| 1 | 1.843 | 0.546 | 0.573 | 0.586 | 0.606 | 0.630 |
| 2 | 2.242 | 0.411 | 0.436 | 0.465 | 0.488 | 0.508 |
| 3 | 1.601 | 0.519 | 0.562 | 0.584 | 0.614 | 0.653 |
| 4 | 0.424 | 0.331 | 0.405 | 0.389 | 0.434 | 0.502 |
| 5 | 0.969 | 0.386 | 0.427 | 0.439 | 0.467 | 0.503 |
| 6 | 0.672 | 0.553 | 0.591 | 0.605 | 0.628 | 0.664 |
| 7 | 0.210 | 0.466 | 0.536 | 0.522 | 0.590 | 0.627 |
| 8 | 0.301 | 0.395 | 0.454 | 0.423 | 0.490 | 0.508 |
| 9 | 0.198 | 0.425 | 0.454 | 0.463 | 0.490 | 0.508 |
| 10 | 0.430 | 0.370 | 0.392 | 0.432 | 0.428 | 0.473 |
| 11 | 0.841 | 0.507 | 0.522 | 0.547 | 0.571 | 0.573 |
| 12 | 0.410 | 0.244 | 0.289 | 0.297 | 0.320 | 0.368 |
| 13 | 0.075 | 0.201 | 0.284 | 0.276 | 0.316 | 0.403 |
The estimated distensibility at each generation is reported in Table 2, showing that the main pulmonary artery displays the apparent highest stiffness (least distensibility). The relatively low distensibility estimated for this this specific vessel (α = 0.84 %/mmHg) is believe to arise least in part due to an experimental artefact. In the initial data sets approximately the first third of the main pulmonary artery was taken up by the cannula used to perfuse the network. Here we have replaced the radii observed for the cannulated portion of the vessel with the radii measured 0.1 mm downstream from the end of the cannula. To assess vessel distensibility as a function of position in the network, both the distensibility and the cumulative distance from the main branch inlet was calculated for each vessel.
Table 2.
Distensibility in each generation.
| Generation | Distensibility (%/mmHg) |
|---|---|
| 1 | 0.84 |
| 2 | 1.21, 1.22 |
| 3 | 1.67 ± 0.55 |
| 4 | 1.81± 0.76 |
Figure 1C plots the estimated distensibility as a function of cumulative distance from the inlet L in comparison to the indirect measurement in Vanderpool et al. (Vanderpool et al. 2011). The value of L associated with each data point is the distance of the axial center point of each vessel from the inlet. Error bars on the 13 data points in Figure 1C are obtained based on the finite segmentation along each vessel segment. The data display a substantial level of variability within the four-generation network. The distensibility ranges from 0.8 to 3.2 % per mmHg in individual vessel segments. The main pulmonary artery (vessel 1) is found to be the most stiff of the 13 vessels, with α = 0.84% per mmHg. This high stiffness is likely to be at least partially due to the effect of the cannula in the main pulmonary artery. Branching arteries 2 and 3 are less stiff with distensibility of approximately 1.2 % per mmHg. For cumulative distances between 10 and 11 mm, i.e. for the second and third generations, the mean value of α is 2.1 % per mmHg. Properties of the arteries in the fourth generation are varied with distensibility from approximately 1 to 3% per mmHg. Overall, there is no clear relationship between position in the network and observed stiffness.
Parameterization of constitutive pressure-radius relationships
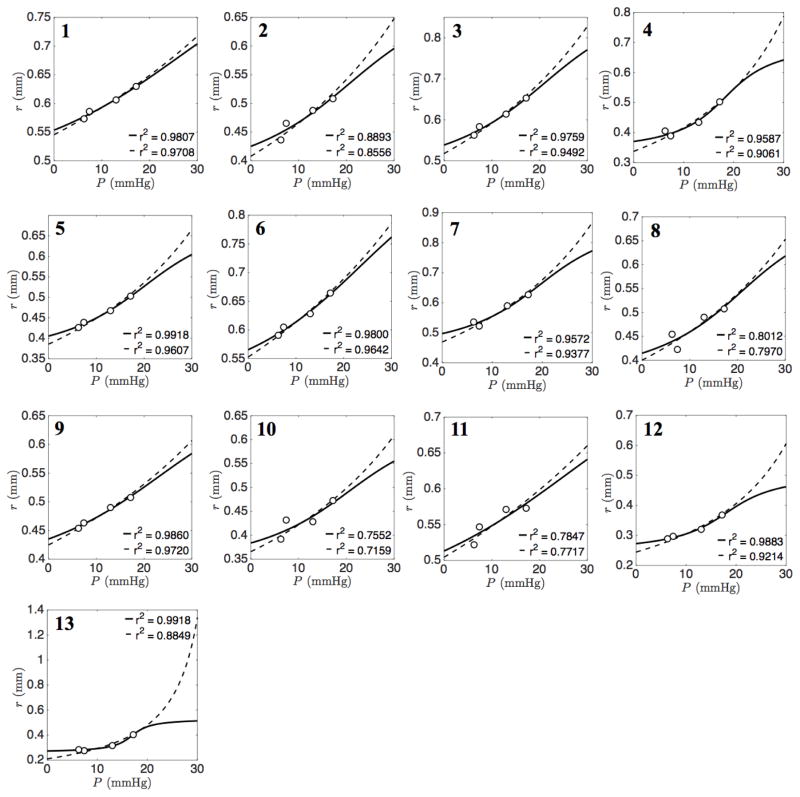
The heterogeneity is explored in Figure 3 by plotting the observed pressure-radius data for each individual vessel in the network. Best fits to Equation (3) are shown by solid lines. The values of the global parameters associated with these fits are a = 0.6413 and b = 0.9626. Best fits to Equation (5) are shown by dashed lines. It is apparent that both Equation (3) and (5) adequately capture the data over a range of different vessel distensibilities.
Figure 3. Pressure-radius relationship for individual vessels.
In each panel (1–13) experimentally estimated radii are plotted against pressure for individual vessels. Solid lines indicate best fits of nonlinear arctangent model (Eq. 3) to the data. Global parameters a = 0.64 and b = 0.96 are incorporated in each individual vessel. Dotted lines represent the curve fitting of linear elastic thin shell model (Eq. 5).
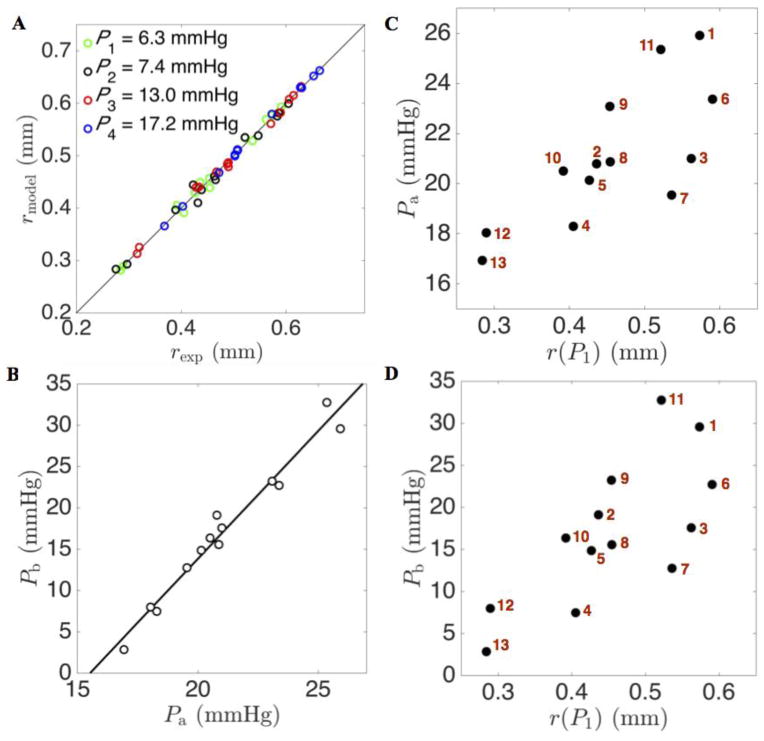
Fitting the model of Equation (3) to the pressure-radius relationship for each individual vessel captures the heterogeneity in vessel distensibility throughout the whole network. Figure 4A illustrates the goodness of fit of the radii predicted by Equation (3) for the individual vessels at the observed pressures. These fits also provide an alternative representation of vessel distensibility—stiffer vessels, with lower distensibility, have lower values of Pb. Figure 4B plots the estimated values of parameter Pa versus those of Pb, revealing a high degree of correlation. Figures 4C and 4D show the nonuniform distribution of parameter values Pa and Pb in terms of the radii r(P1). These plots reveal that the values of Pa and Pb tend to increase with the vessel radii. The larger vessels tend to be more compliant (less stiff with larger values of Pb) than the smaller vessels.
Figure 4. Characterization of heterogeneity of the constitutive pressure-radius relationship.
A. Predicted radius is plotted versus experimentally estimated vessel radius at the four experimental pressures for four generations of vessels in the network. B. The relationship between model parameters Pa and Pb for four generations of vessels in the network is illustrated. C. The distribution of parameter Pa plotted as a function of vessel radius r(P1). D. The distribution of parameter Pb is also plotted as a function of vessel radius r(P1).
The model of Equation (5) also effectively captures the pressure-versus-radii data (dashed lines in Figure 3). Deviations between the two models are apparent primarily only for pressures in ranges outside of the observed data. Thus, these data do not provide a means of distinguishing between these two models. The arctangent model of Equation (3) accounts for increased stiffening with increased pressure, i.e. the radius reaches a plateau as pressure increases, while the thin-wall linear model predicts higher radii at higher pressures compared to the arctangent model. The plateauing behavior of Equation (3) qualitatively matches observations on isolated systemic and pulmonary vessels of different sizes ((Lichtenstein et al. 1998), (Lammers et al. 2008)) in which the relationship between radius and pressure saturates in the same manner as it does for the arctangent model.
Convergence of pressure profiles through 4 generations
To assess the mechanics of the network during pulsatile blood flow, different versions of the model were simulated to capture different levels of anatomic and mechanical details. Figure 5 shows four different network models, representing the main trunk (panel 5A), the main trunk and second generation (panel 5B), the main trunk to third generation (panel 5C), and the main trunk to fourth generation (panel 5D). Each of these model networks was simulated with Windkessel boundary conditions parameterized as described in the methods section. For each network, the total resistance is inversely proportional to the cross sectional area of the outlet, and the capacitance is proportional to area of the outlet. The proportionality constants were scaled for each network so that for the given inflow, the mean and pulse pressures in the main pulmonary artery were 25 mmHg and 10 mmHg, respectively.
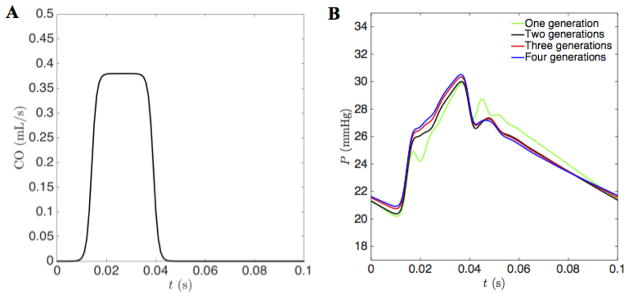
Figure 6 plots the inlet flow condition of Equation (12) and the mean pressure in the main pulmonary artery obtained by simulating each of the four networks of Figure 5 using the heterogeneous nonlinear wall model, Equation (3), parameterized as illustrated in Figure 4. Wave reflection phenomena are observed for each model, with the behavior essentially converged for the 3-generation model. The predicted pressure profile for the 3-generation model differs from the one obtained with the 4-generation model by less than 0.55 %. The converged behavior depends on the boundary condition scaling: tuning boundary conditions to obtain a given mean and pulse pressure.
Figure 6. The pressure profile convergence through 1 to 4 generations.
A. The prescribed cardiac output in the open-loop circulation. The cardiac-output driving function used as an inflow boundary condition at the root of the main pulmonary artery. Peak cardiac output is 0.38 mL/s; duration is approximately 30% of the period T = 0.1 sec. B. The pressure profiles predicted by simulations of the four models illustrated in Figure 5, and using heterogeneous parameterization of vessel mechanics. The pulmonary arterial pressure profiles are effectively converged for models of three generations and higher. The outer boundary parameters k1 and k2 (Eq. 9) are adjusted to match a mean pressure of 25 mmHg and pulse pressure of 10 mmHg.
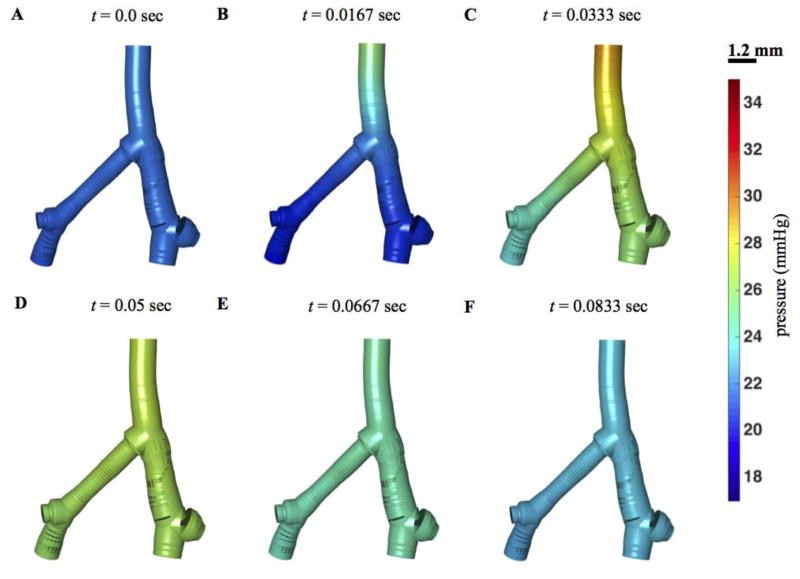
Figure 7 illustrates how pressure propagates through the network over the cardiac cycle with the three-generation model (Figure 5C). In diastole pressure is roughly 20 mmHg throughout the large vessels. The pressure pulse associated with systole first propagates from the main pulmonary artery to the larger diameter first-order bifurcation, then to the smaller diameter vessel. Pressure in the main pulmonary artery attains a local minimum around t = 0.04 sec, when input flow rapidly drops, roughly equivalent to closing of the pulmonary valve.
Figure 7. Pressure distribution in the network.
Predicted geometry and pressure in the three-generation model, illustrated for 6 time points in the cardiac cycle.
Pressure profiling, linear versus nonlinear and homogeneous versus heterogeneous
To investigate the potential implications for the variability in pulmonary arterial vessel mechanics, we calculated the pressure-volume relationship in all vessels within the four-generation network (Figure 8A) using two different parameterizations for the wall model, Equation (3). The ‘heterogeneous’ parameterization uses individual values of Pa and Pb for each of the 13 vessels in the network. Thus the heterogeneous parameterization captures the observed variability in stiffness with vessel size. The ‘homogeneous A’ parameterization globally applies the average values of Pa = 19.29 and Pb = 28.78 mmHg, the mean values of the parameters estimated over all vessels. As illustrated in the Figure, this parameterization results in a network that is globally slightly less stiff and with a slightly lower pressure at a given volume than the heterogeneous parameterization. The ‘homogenous B’ parameterization adopts global values Pa = 21.5 and Pb = 19.2 mmHg, adjusted to match the static pressure versus volume relationship from the heterogeneous parameterization. Thus neither homogeneous parameterization captures the observed variability/heterogeneity in vessel stiffness.
Figure 8. Pressure profiles from heterogeneous versus homogeneous and linear versus non-linear vessel mechanics.
A. The total vasculature compliance within the four-generation network is illustrated as pressure versus total blood volume for the three different parameterizations of the nonlinear arctangent model. B. Simulated mean pressure in the main pulmonary artery is plotted versus time for the different nonlinear model parameterizations. C. Simulated mean pressure in the main pulmonary artery plotted versus time for the heterogeneous nonlinear model (Equation (3)) and for the heterogeneous linear model (Equation (5)).
Predicted main pulmonary arterial pressure time courses for these three different parameterizations are illustrated in Figure 8B. All simulations are driven by the flow input specified by Equation (12), with boundary conditions scaled to give mean and pulse pressures of 25 and 10 mmHg at the midpoint of the main pulmonary artery, for the heterogeneous wall model, i.e. the boundary conditions are the same for all cases compared here. All simulations produce nearly identical results, with the results from homogeneous parameterization A differ by less than 2.85 % from the results from the heterogeneous parameterization. Homogeneous parametrization B produces results that are less than 2.35 % different from the heterogeneous parameterization.
Pulmonary arterial pressure waveforms predicted by the two wall models, Equations (3) and (5), are compared in Figure 8C. Again, boundary conditions were held constant for both simulations. Since the linear elastic thin-wall model is much less stiff than the arctangent model at high pressures, the predicted pulse pressure is approximately half of that what is obtained for the nonlinear arctangent model. By reducing the capacitance in the boundary networks used with the linear model, it is possible to increase the pulse pressure, but only up to 5.9 mmHg. Because the linear model is more compliant than the nonlinear model, it cannot produce a pulse pressure as high as 10 mmHg for the input flow used here.
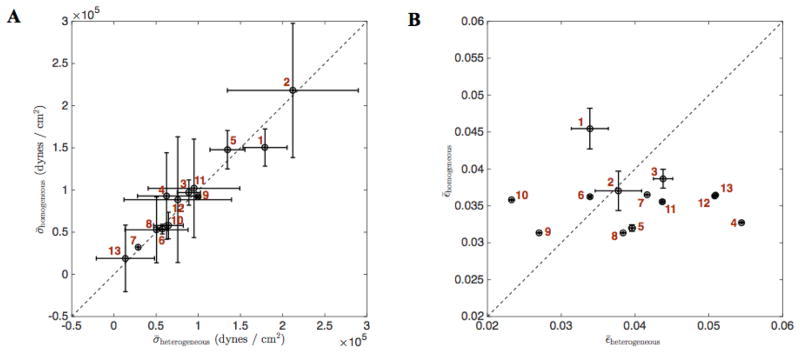
Figure 9 plots predicted mean strain and wall shear stress throughout the cardiac cycle for the 13 vessels for the heterogeneous versus the homogeneous B parameterization. Individual vessels that are stiffer than average (e.g. vessel 1) display a higher shear and lower strain for the heterogeneous than for the homogeneous parameterization.
Figure 9. Wall shear stress and strain from heterogeneous and homogeneous vessel mechanics for the 13 vessels.
(A) The average wall shear stress throughout the cardiac cycle and its standard deviation in each vessel is plotted heterogeneous versus homogeneous B vessel mechanics. (B) The average strain throughout the cardiac cycle and its standard deviation in each vessel is plotted heterogeneous versus homogeneous B vessel mechanics. The vessel indices are shown in red.
Pressure wave velocity and wave intensity analysis
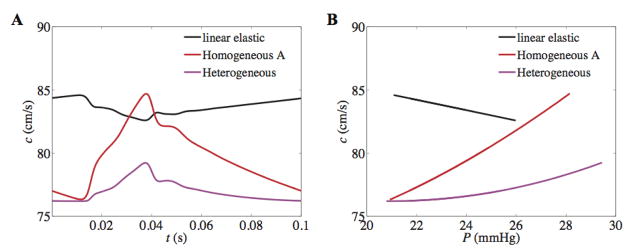
Although the heterogeneous and homogeneous models produce nearly identical pressures in the main pulmonary artery, the predicted dynamics throughout the network do differ between the different versions of the wall model. Figure 10 shows a comparison of PWV (c) computed in the main pulmonary artery for the heterogeneous, homogeneous A, and linear elastic wall models. Figure 10A predicts and contrasts the behavior of c for the linear versus non-linear models over one cardiac cycle. It should be noted that there is a stark difference in peak PWV between the heterogeneous and homogeneous A nonlinear models. Since c is inversely related with arterial compliance, from Figure 10B it can be inferred that for the non-linear model the vessel compliance decreases with pressure, which is physiologically correct, whereas it increases with pressure for the linear elastic model. Despite the qualitatively wrong behavior of c, the averaged PWV predicted by the linear elastic model is greater than both cases of non-linear model (for 19 mmHg < P < 26 mmHg). This predicts sufficient wall stiffening within the physiological pressure range. Moreover, although both the heterogeneous and homogeneous A models predict identical pressures, it is interesting to note the difference in degree of vessel stiffening with pressure between two models. This effect may be due to the heterogeneous nature of downstream network that is impacting the stiffness of a vessel upstream.
Figure 10. PWV over cardiac cycle (A) and as function of pressure (B) in the main trunk from linear and non-linear vessel mechanics.
Although the linear wall model predicts the qualitatively wrong behavior i.e. a decrease in PWV and arterial stiffness with pressure, the average PWV over the cardiac cycle is greater for the linear than the non-linear models; 83.6 ± 0.5 cm/s, 79.7 ± 2.3 cm/s and 77.0 ± 0.8 cm/s for linear-elastic, homogeneous A, and heterogeneous models, respectively.
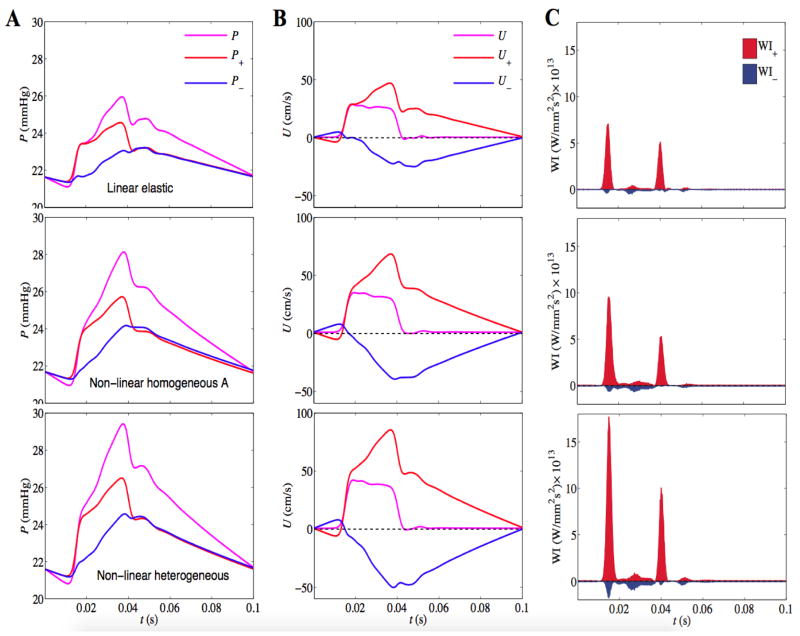
Finally, in Figure 11 the incident and reflected pressures, velocity and corresponding wave intensities are simulated for the linear elastic, nonlinear heterogeneous and homogeneous A models. The type of wave reflection characterizes the branching patterns and outflow boundary condition, while its amplitude and arrival time is determined by the wall mechanics. For all models, the incident compression wave is reflected back as a compression wave. The higher compliance of the linear model leads to shorter peaks in pressure and wave intensity profiles compared to the case of the nonlinear model. The associated differences in the amplitudes of the incident and reflected compression waves explain the differences in the pressure pulse for different versions of the arterial wall model. Thus the differences in amplitudes obtained for the two different model formulations are not due to differences in energy dissipation.
Figure 11. WIA in the main pulmonary artery for the linear elastic model (row 1), homogeneous A model (row 2) and heterogeneous model (row 3).
Separated pressure (A), velocity (B) and wave intensity (C) profiles are plotted for the incident and reflected wave components. Note the linear model shows considerably underestimated wave intensities evident from the shorter peaks of incident pressure and wave intensity profiles.
Discussion and Conclusions
In this study, the mechanical properties of 13 pulmonary arterial vessels from a normal mouse lung are analyzed to characterize the variability and heterogeneity of vessel stiffness in a normal individual. The observed pressure-radius relationships in the individual vessels are used to identify empirical constitutive wall models that are applied in one-dimensional fluid dynamics simulations of pulsatile fluid flow in the network. Results from a model capturing the observed heterogeneity are compared to a homogeneous version of the model as well as the linear elastic model. Analysis and simulations reveal the following findings:
The normal mouse pulmonary arterial network displays marked heterogeneity in vessel distensibility. While larger vessels tend to be more compliant than smaller, there is no simple relationship between position in the network and stiffness/distensibility. While the first two branches are among the most stiff in the network, there are downstream vessels that are more stiff than these (The estimation of α = 0.84 % per mmHg for the main pulmonary artery is likely influenced by the upstream cannula.)
The nonlinear wall model predicts substantially different behavior than the linear model. The linear elastic wall model underestimates the amplitudes of the incident and reflected compression waves compared to the nonlinear arctangent model.
The observed heterogeneity in mechanical properties is predicted to have little impact on the pressure in the main pulmonary artery, but has a substantial impact on the wall shear stress, pulse wave velocity and distension throughout the network.
These conclusions are drawn from simulations of arterial mechanics driven by an idealized flow transient to produce pressures and flow similar to those found in vivo. (These simulations do not represent an attempt to simulate an in vivo pressure or flow wave.)
Regarding the comparison of the linear to nonlinear wall models, although these two formulations give different results, it is not possible to judge with certainty which model most accurately reflects the behavior of the mouse pulmonary network. The models deviate from one another primarily over pressure ranges (Figure 3) that are outside of the range of the measurements. The commonly used linear wall model has the unrealistic property that the slope of radius as a function of pressure continues to increase with increasing pressure. The saturating behavior of the arctangent model is more physiologically realistic ((Lichtenstein et al. 1998), (Lammers et al. 2008)) and thus is expected to give more realistic results.
It is of practical importance that observed high degree of mechanical heterogeneity does not strongly influence the pulsatile pressure time course in the main pulmonary artery. If this finding translates to other species (including human) then it is possible to effectively simulate pulmonary arterial pressure wave propagation without detailed information on the mechanical properties of all the individual vessels in the network.
These findings are potentially impacted by at least one limitation of our approach. By identifying the constitutive pressure-radius relationship in pulmonary arteries from static data, our model does not account for viscoelastic properties of these vessels. Cyclically loaded large systemic arteries (e.g. aortas and carotid arteries from large animals) display hysteresis in deformation dynamics ((Lichtenstein et al. 1998), (Gamero et al. 2001), (Valdez-Jasso et al. 2011)). Similarly, pulmonary arteries excised from mouse lungs display hysteresis in pressure-volume relationships and frequency-dependent mechanical responses (Wang et al. 2013). Yet these properties are not likely to impact any of our major findings. Incorporation of a viscous component into the constitutive law for the large vessels would impact the predicted large-vessel mechanics, but not influence the finding that heterogeneity of stiffness in the smaller vessels has little impact on pressure/flow propagation in the large vessels. (Incorporation of viscous effects would require additional information, such as from dynamic ex-vivo mechanical testing of vessels from individual animals.) Another limitation is the sub-physiological pressure range of the imaging data. A known consequence of the ex vivo set up is contrast leakage from small vessels at physiological pressures [44], which precluded image acquisition and our ability to fit the models at physiological pressures.
The large arteries of healthy lungs have essentially no basal SMC tone, as previously demonstrated [45]. Small pulmonary arteries do have some SMC tone, as evidenced by a decrease in resistance when rho kinase inhibitor is administered ex vivo [44], but these vessels are likely smaller than those measured and modeled here. Thus, the current mechanical property results derived from lungs with SMC tone abolished are applicable to “normal” or “healthy” conditions.
To our knowledge this study represents the first characterization of vessel mechanical properties of multiple individual vessels from a single pulmonary arterial network. Thus there is little basis for knowing if or how these findings translate to larger animals. Furthermore, these findings do not necessarily apply in non-physiological situations such as in pulmonary arterial hypertension. Vascular remodeling in different forms of pulmonary hypertension can include stiffening in large proximal vessels, narrowing and stiffening in small distal vessels, and/or rarefaction of the arterial tree. It remains to be investigated how the heterogeneity and variability observed here in mechanical properties throughout the normal pulmonary arterial tree are manifest in cases of disease.
Acknowledgments
This is funded by National Institute of Health (P50GM094503).
Appendix A. Numerical methods and discretization for the 1D Navier-Stokes equations
Numerical simulations use a Backward-Euler and a second Runge-Kutta for time-stepping (Lee 2007) and Godunov upwind method (Lee et al. 2010) for the advection term of the momentum equation. The continuity equation is integrated via a second-order Runge-Kutta method (Lee 2007). The spatial gradient is discretized by the second order side-centered differentiation.
| (1) |
| (2) |
| (3) |
| (4) |
where superscript n indicates the time point t = nΔt.
The algorithm for simulating discretized 1D Navier-Stokes equations follows:
Update the pressure distribution from the pressure-radius relationship.
Update the volume flow rate from the momentum equation of 1D Navier-Stokes equations. (This step incorporates the inflow boundary condition.)
Determine the relationship between pressure and flow at the outflow boundaries from the coupled Windkessel model.
Update the cross-sectional area and vessel radii from the continuity equation.
The computational framework uses PETSc libraries ((Balay 1997), (Balay 2014)). In the Navier-Stokes solver, a Krylov iterative method of GMRES is used with a relative tolerance of 1.0e-6.
References
- Alastruey J, Parker KH, Peiro J, Sherwin SJ. Analysing the pattern of pulse waves in arterial networks: a time-domain study. J Eng Math. 2009;64:331–351. doi: 10.1007/s10665-009-9275-1. [DOI] [Google Scholar]
- Balay S, et al. Efficient management of parallelism in object oriented numerical software libraries. In: Arge E, Bruaset AM, Langtangen HP, editors. Modern software tools in scientific computing. Birkhauser Press; 1997. pp. 163–202. [Google Scholar]
- Balay S, et al. PETSc Users Manual vol Revision 3.4. Argonne National Laboratory; 2014. [Google Scholar]
- Caro CG, Pedley TJ, Schroter RC, Seed WA. The Mechanics of the Circulation. 2. Cambridge University Press; 2012. [Google Scholar]
- Coogan JS, Chan FP, Ladisa JF, Jr, Taylor CA, Hanley FL, Feinstein JA. Computational fluid dynamic simulations for determination of ventricular workload in aortic arch obstructions. The Journal of thoracic and cardiovascular surgery. 2013;145:489–495. e481. doi: 10.1016/j.jtcvs.2012.03.051. [DOI] [PubMed] [Google Scholar]
- Cuomo F, Ferruzzi J, Humphrey JD, Figueroa CA. An Experimental-Computational Study of Catheter Induced Alterations in Pulse Wave Velocity in Anesthetized Mice. Annals of biomedical engineering. 2015;43:1555–1570. doi: 10.1007/s10439-015-1272-0. [DOI] [PMC free article] [PubMed] [Google Scholar]
- Formaggia L, Gerbeau JF, Nobile F, Quarteroni A. On the coupling of 3D and 1D Navier-Stokes equations for flow problems in compliant vessels. Comput Method Appl M. 2001;191:561–582. doi: 10.1016/S0045-7825(01)00302-4. [DOI] [Google Scholar]
- Formaggia L, Lamponi D, Quarteroni A. One-dimensional models for blood flow in arteries. J Eng Math. 2003;47:251–276. doi: 10.1023/B:Engi.0000007980.01347.29. [DOI] [Google Scholar]
- Gamero LG, Armentano RL, Barra JG, Simon A, Levenson J. Identification of arterial wall dynamics in conscious dogs. Experimental physiology. 2001;86:519–528. doi: 10.1113/eph8602172. [DOI] [PubMed] [Google Scholar]
- Gleason RL, Gray SP, Wilson E, Humphrey JD. A multiaxial computer-controlled organ culture and biomechanical device for mouse carotid arteries. Journal of biomechanical engineering. 2004;126:787–795. doi: 10.1115/1.1824130. [DOI] [PubMed] [Google Scholar]
- Grinberg L, Cheever E, Anor T, Madsen JR, Karniadakis GE. Modeling Blood Flow Circulation in Intracranial Arterial Networks: A Comparative 3D/1D Simulation Study. Annals of biomedical engineering. 2011;39:297–309. doi: 10.1007/s10439-010-0132-1. [DOI] [PubMed] [Google Scholar]
- Huo Y, Wischgoll T, Kassab GS. Flow patterns in three-dimensional porcine epicardial coronary arterial tree. American journal of physiology Heart and circulatory physiology. 2007;293:H2959–2970. doi: 10.1152/ajpheart.00586.2007. [DOI] [PubMed] [Google Scholar]
- Bramwell JCAVH. The velocity of pulse wave in man. Proc Soc Lond B. 1922;93:298–306. [Google Scholar]
- Kim HJ, Vignon-Clementel IE, Coogan JS, Figueroa CA, Jansen KE, Taylor CA. Patient-specific modeling of blood flow and pressure in human coronary arteries. Annals of biomedical engineering. 2010;38:3195–3209. doi: 10.1007/s10439-010-0083-6. [DOI] [PubMed] [Google Scholar]
- Kim HJ, Vignon-Clementel IE, Figueroa CA, LaDisa JF, Jansen KE, Feinstein JA, Taylor CA. On coupling a lumped parameter heart model and a three-dimensional finite element aorta model. Annals of biomedical engineering. 2009;37:2153–2169. doi: 10.1007/s10439-009-9760-8. [DOI] [PubMed] [Google Scholar]
- LaDisa JF, Jr, et al. Computational simulations for aortic coarctation: representative results from a sampling of patients. Journal of biomechanical engineering. 2011;133:091008. doi: 10.1115/1.4004996. [DOI] [PMC free article] [PubMed] [Google Scholar]
- Lammers SR, et al. Changes in the structure-function relationship of elastin and its impact on the proximal pulmonary arterial mechanics of hypertensive calves. American journal of physiology Heart and circulatory physiology. 2008;295:H1451–1459. doi: 10.1152/ajpheart.00127.2008. [DOI] [PMC free article] [PubMed] [Google Scholar]
- Langewouters GJ, Wesseling KH, Goedhard WJ. The static elastic properties of 45 human thoracic and 20 abdominal aortas in vitro and the parameters of a new model. Journal of biomechanics. 1984;17:425–435. doi: 10.1016/0021-9290(84)90034-4. [DOI] [PubMed] [Google Scholar]
- Langewouters GJ, Wesseling KH, Goedhard WJ. The pressure dependent dynamic elasticity of 35 thoracic and 16 abdominal human aortas in vitro described by a five component model. Journal of biomechanics. 1985;18:613–620. doi: 10.1016/0021-9290(85)90015-6. [DOI] [PubMed] [Google Scholar]
- Lee P. The immersed boundary method with advection-electrodiffusion. New York University; 2007. [DOI] [PMC free article] [PubMed] [Google Scholar]
- Lee P, Griffith BE, Peskin CS. The immersed boundary method for advection-electrodiffusion with implicit timestepping and local mesh refinement. Journal of computational physics. 2010;229:5208–5227. doi: 10.1016/j.jcp.2010.03.036. [DOI] [PMC free article] [PubMed] [Google Scholar]
- Li CW, Cheng HD. A nonlinear fluid model for pulmonary blood circulation. Journal of biomechanics. 1993;26:653–664. doi: 10.1016/0021-9290(93)90029-e. [DOI] [PubMed] [Google Scholar]
- Lichtenstein O, Safar ME, Mathieu E, Poitevin P, Levy BI. Static and dynamic mechanical properties of the carotid artery from normotensive and hypertensive rats. Hypertension. 1998;32:346–350. doi: 10.1161/01.hyp.32.2.346. [DOI] [PubMed] [Google Scholar]
- Liu Y, Zhang W, Wang C, Kassab GS. A linearized and incompressible constitutive model for arteries. Journal of theoretical biology. 2011;286:85–91. doi: 10.1016/j.jtbi.2011.05.005. [DOI] [PMC free article] [PubMed] [Google Scholar]
- Migliavacca F, Balossino R, Pennati G, Dubini G, Hsia TY, de Leval MR, Bove EL. Multiscale modelling in biofluidynamics: application to reconstructive paediatric cardiac surgery. Journal of biomechanics. 2006;39:1010–1020. doi: 10.1016/j.jbiomech.2005.02.021. [DOI] [PubMed] [Google Scholar]
- Molthen RC, Karau KL, Dawson CA. Quantitative models of the rat pulmonary arterial tree morphometry applied to hypoxia-induced arterial remodeling. Journal of applied physiology. 2004;97:2372–2384. doi: 10.1152/japplphysiol.00454.2004. discussion 2354. [DOI] [PubMed] [Google Scholar]
- Morris PD, et al. Computational fluid dynamics modelling in cardiovascular medicine. Heart. 2015 doi: 10.1136/heartjnl-2015-308044. [DOI] [PMC free article] [PubMed] [Google Scholar]
- Morrison TM, Choi G, Zarins CK, Taylor CA. Circumferential and longitudinal cyclic strain of the human thoracic aorta: age-related changes. Journal of vascular surgery. 2009;49:1029–1036. doi: 10.1016/j.jvs.2008.11.056. [DOI] [PMC free article] [PubMed] [Google Scholar]
- Mynard JP, Smolich JJ. One-Dimensional Haemodynamic Modeling and Wave Dynamics in the Entire Adult Circulation. Annals of biomedical engineering. 2015;43:1443–1460. doi: 10.1007/s10439-015-1313-8. [DOI] [PubMed] [Google Scholar]
- Nichols WWMFOR. MacDonald’s blood flow in arteries: theoretical experimental and clinical principles. 4. Edward Arnold; Philadelphia: 1998. [Google Scholar]
- Olufsen MS. Structured tree outflow condition for blood flow in larger systemic arteries. The American journal of physiology. 1999;276:H257–268. doi: 10.1152/ajpheart.1999.276.1.H257. [DOI] [PubMed] [Google Scholar]
- Olufsen MS, Hill NA, Vaughan GD, Sainsbury C, Johnson M. Rarefaction and blood pressure in systemic and pulmonary arteries. Journal of fluid mechanics. 2012;705:280–305. doi: 10.1017/jfm.2012.220. [DOI] [PMC free article] [PubMed] [Google Scholar]
- Parker KH. An introduction to wave intensity analysis. Medical & biological engineering & computing. 2009;47:175–188. doi: 10.1007/s11517-009-0439-y. [DOI] [PubMed] [Google Scholar]
- Parker KH, Jones CJ. Forward and backward running waves in the arteries: analysis using the method of characteristics. Journal of biomechanical engineering. 1990;112:322–326. doi: 10.1115/1.2891191. [DOI] [PubMed] [Google Scholar]
- Pedley TJ. The fluid mechanics of large blood vessels. Cambridge University Press; 1980. [Google Scholar]
- Qureshi MU, Vaughan GD, Sainsbury C, Johnson M, Peskin CS, Olufsen MS, Hill NA. Numerical simulation of blood flow and pressure drop in the pulmonary arterial and venous circulation. Biomechanics and modeling in mechanobiology. 2014;13:1137–1154. doi: 10.1007/s10237-014-0563-y. [DOI] [PMC free article] [PubMed] [Google Scholar]
- Raines JK, Jaffrin MY, Shapiro AH. A computer simulation of arterial dynamics in the human leg. Journal of biomechanics. 1974;7:77–91. doi: 10.1016/0021-9290(74)90072-4. [DOI] [PubMed] [Google Scholar]
- Reymond P, Bohraus Y, Perren F, Lazeyras F, Stergiopulos N. Validation of a patient-specific one-dimensional model of the systemic arterial tree. Am J Physiol-Heart C. 2011;301:H1173–H1182. doi: 10.1152/ajpheart.00821.2010. [DOI] [PubMed] [Google Scholar]
- Reymond P, Vardoulis O, Stergiopulos N. Generic and patient-specific models of the arterial tree. Journal of clinical monitoring and computing. 2012;26:375–382. doi: 10.1007/s10877-012-9382-9. [DOI] [PubMed] [Google Scholar]
- Samyn MM, et al. Cardiovascular magnetic resonance imaging-based computational fluid dynamics/fluid-structure interaction pilot study to detect early vascular changes in pediatric patients with type 1 diabetes. Pediatric cardiology. 2015;36:851–861. doi: 10.1007/s00246-014-1071-7. [DOI] [PubMed] [Google Scholar]
- Saouti N, Westerhof N, Postmus PE, Vonk-Noordegraaf A. The arterial load in pulmonary hypertension. European respiratory review: an official journal of the European Respiratory Society. 2010;19:197–203. doi: 10.1183/09059180.00002210. [DOI] [PMC free article] [PubMed] [Google Scholar]
- Schiavazzi DE, et al. Hemodynamic effects of left pulmonary artery stenosis after superior cavopulmonary connection: a patient-specific multiscale modeling study. The Journal of thoracic and cardiovascular surgery. 2015;149:689–696. e681–683. doi: 10.1016/j.jtcvs.2014.12.040. [DOI] [PubMed] [Google Scholar]
- Sherwin SJ, Franke V, Peiro J, Parker K. One-dimensional modelling of a vascular network in space-time variables. J Eng Math. 2003;47:217–250. doi: 10.1023/B:Engi.0000007979.32871.E2. [DOI] [Google Scholar]
- Shi YB, Lawford P, Hose R. Review of Zero-D and 1-D Models of Blood Flow in the Cardiovascular System. Biomed Eng Online. 2011;10:Artn33. doi: 10.1186/1475-925x-10-33. [DOI] [PMC free article] [PubMed] [Google Scholar]
- Smith NP, Pullan AJ, Hunter PJ. An anatomically based model of transient coronary blood flow in the heart. Siam J Appl Math. 2002;62:990–1018. [Google Scholar]
- Sommer K, Schmidt R, Graafen D, Breit HC, Schreiber LM. Contrast agent bolus dispersion in a realistic coronary artery geometry: influence of outlet boundary conditions. Annals of biomedical engineering. 2014;42:787–796. doi: 10.1007/s10439-013-0950-z. [DOI] [PubMed] [Google Scholar]
- Spilker RL, Feinstein JA, Parker DW, Reddy VM, Taylor CA. Morphometry-based impedance boundary conditions for patient-specific modeling of blood flow in pulmonary arteries. Annals of biomedical engineering. 2007;35:546–559. doi: 10.1007/s10439-006-9240-3. [DOI] [PubMed] [Google Scholar]
- Steele BN, Valdez-Jasso D, Haider MA, Olufsen MS. Predicting Arterial Flow and Pressure Dynamics Using a 1d Fluid Dynamics Model with a Viscoelastic Wall. Siam J Appl Math. 2011;71:1123–1143. doi: 10.1137/100810186. [DOI] [Google Scholar]
- Tabima DM, Chesler NC. The effects of vasoactivity and hypoxic pulmonary hypertension on extralobar pulmonary artery biomechanics. Journal of biomechanics. 2010;43:1864–1869. doi: 10.1016/j.jbiomech.2010.03.033. [DOI] [PMC free article] [PubMed] [Google Scholar]
- Taelman L, Degroote J, Verdonck P, Vierendeels J, Segers P. Modeling Hemodynamics in Vascular Networks Using a Geometrical Multiscale Approach: Numerical Aspects. Annals of biomedical engineering. 2013;41:1445–1458. doi: 10.1007/s10439-012-0717-y. [DOI] [PubMed] [Google Scholar]
- Tang BT, Fonte TA, Chan FP, Tsao PS, Feinstein JA, Taylor CA. Three-dimensional hemodynamics in the human pulmonary arteries under resting and exercise conditions. Annals of biomedical engineering. 2011;39:347–358. doi: 10.1007/s10439-010-0124-1. [DOI] [PubMed] [Google Scholar]
- Taylor CA, Figueroa CA. Patient-specific modeling of cardiovascular mechanics. Annual review of biomedical engineering. 2009;11:109–134. doi: 10.1146/annurev.bioeng.10.061807.160521. [DOI] [PMC free article] [PubMed] [Google Scholar]
- Trachet B, Bols J, Degroote J, Verhegghe B, Stergiopulos N, Vierendeels J, Segers P. An animal-specific FSI model of the abdominal aorta in anesthetized mice. Annals of biomedical engineering. 2015;43:1298–1309. doi: 10.1007/s10439-015-1310-y. [DOI] [PubMed] [Google Scholar]
- Valdez-Jasso D, Bia D, Zocalo Y, Armentano RL, Haider MA, Olufsen MS. Linear and nonlinear viscoelastic modeling of aorta and carotid pressure-area dynamics under in vivo and ex vivo conditions. Annals of biomedical engineering. 2011;39:1438–1456. doi: 10.1007/s10439-010-0236-7. [DOI] [PMC free article] [PubMed] [Google Scholar]
- van de Vosse FN, Stergiopulos N. Pulse Wave Propagation in the Arterial Tree. Annu Rev Fluid Mech. 2011;43:467–499. doi: 10.1146/annurev-fluid-122109-160730. [DOI] [Google Scholar]
- Vander Werff TJ. Significant Parameters in Arterial-Pressure and Velocity Development. Journal of biomechanics. 1974;7:437–447. doi: 10.1016/0021-9290(74)90006-2. [DOI] [PubMed] [Google Scholar]
- Vanderpool RR, Kim AR, Molthen R, Chesler NC. Effects of acute Rho kinase inhibition on chronic hypoxia-induced changes in proximal and distal pulmonary arterial structure and function. Journal of applied physiology. 2011;110:188–198. doi: 10.1152/japplphysiol.00533.2010. [DOI] [PMC free article] [PubMed] [Google Scholar]
- Wang Z, Lakes RS, Golob M, Eickhoff JC, Chesler NC. Changes in large pulmonary arterial viscoelasticity in chronic pulmonary hypertension. PloS one. 2013;8:e78569. doi: 10.1371/journal.pone.0078569. [DOI] [PMC free article] [PubMed] [Google Scholar]
- Waters SL, et al. Theoretical models for coronary vascular biomechanics: progress & challenges. Progress in biophysics and molecular biology. 2011;104:49–76. doi: 10.1016/j.pbiomolbio.2010.10.001. [DOI] [PMC free article] [PubMed] [Google Scholar]
- Xiao N, Alastruey J, Figueroa CA. A systematic comparison between 1-D and 3-D hemodynamics in compliant arterial models. Int J Numer Meth Bio. 2014;30:204–231. doi: 10.1002/cnm.2598. [DOI] [PMC free article] [PubMed] [Google Scholar]
- Xiao N, Humphrey JD, Figueroa CA. Multi-Scale Computational Model of Three-Dimensional Hemodynamics within a Deformable Full-Body Arterial Network. Journal of computational physics. 2013;244:22–40. doi: 10.1016/j.jcp.2012.09.016. [DOI] [PMC free article] [PubMed] [Google Scholar]
- Yen RT, Fung YC, Bingham N. Elasticity of Small Pulmonary-Arteries in the Cat. J Biomech Eng-T Asme. 1980;102:170–177. doi: 10.1115/1.3138218. [DOI] [PubMed] [Google Scholar]


