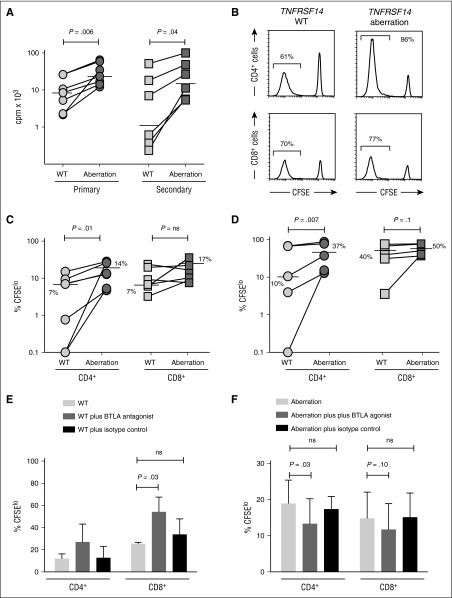
Figure 4.
FL B cells with dual TNFRSF14 aberrations stimulate greater allogeneic T-cell proliferation than WT FL B cells. (A) Proliferation of allogeneic T cells measured by thymidine incorporation after primary (n = 7) and secondary (n = 6) coculture with TNFRSF14 WT or dual TNFRSF14 aberration FL B cells. Horizontal lines show median values. (B) Representative histograms of CFSE dye dilution in allogeneic T cells in secondary coculture with FL B cells. Numbers are proportions of proliferating cells. (C-D) Proportion of proliferating allogeneic CD4+ and CD8+ T cells after primary (C; n = 7) and secondary (D; n = 5) coculture with FL B cells. Horizontal lines show median values. (E) Proportion of proliferating CD4+ and CD8+ T cells after primary allogeneic coculture with TNFRSF14 WT FL B cells without and with exogenous BTLA antagonist or isotype control antibody. (F) Proportion of proliferating CD4+ and CD8+ T cells after primary allogeneic coculture (n = 3) with FL B cells with dual TNFRSF14 aberrations without and with exogenous BTLA agonist or isotype control antibody. Mean values ± standard deviation for 3 independent experiments are shown in panels E-F. P values are for 2-tailed Student t tests throughout. cpm, counts per minute.

