

Summary
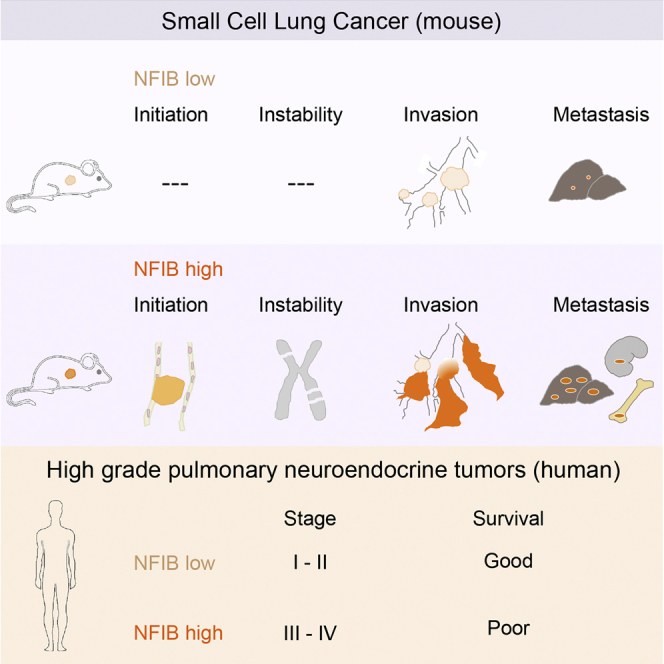
Small cell lung cancer (SCLC) is an aggressive neuroendocrine tumor, and no effective treatment is available to date. Mouse models of SCLC based on the inactivation of Rb1 and Trp53 show frequent amplifications of the Nfib and Mycl genes. Here, we report that, although overexpression of either transcription factor accelerates tumor growth, NFIB specifically promotes metastatic spread. High NFIB levels are associated with expansive growth of a poorly differentiated and almost exclusively E-cadherin (CDH1)-negative invasive tumor cell population. Consistent with the mouse data, we find that NFIB is overexpressed in almost all tested human metastatic high-grade neuroendocrine lung tumors, warranting further assessment of NFIB as a tumor progression marker in a clinical setting.
Graphical Abstract
Highlights
-
•
NFIB drives tumor initiation and progression in mouse models of SCLC
-
•
NFIB enhances metastasis and changes the metastatic profile
-
•
NFIB promotes dedifferentiation and invasion in SCLC
-
•
NFIB marks stage III/IV high-grade neuroendocrine carcinomas in patients
SCLC is a highly malignant cancer with an unmet need for better intervention strategies. Semenova et al. report that the transcription factor NFIB drives SCLC growth and metastasis, defines an aggressive tumor compartment in mice, and marks a subgroup of high-grade pulmonary neuroendocrine tumors (pNETs) in patients.
Introduction
Small cell lung cancer (SCLC) is the most aggressive subtype of lung cancer and is characterized by early metastatic spread to multiple organs (Byers and Rudin, 2015). It is most often diagnosed at an advanced stage of disease and is generally fatal within 4 months if left untreated. Another striking feature of SCLC is its exceptional initial response to standard first line chemotherapy regimens, which is followed by rapid relapse of chemoresistant tumors, limiting the survival benefit for SCLC patients (Byers and Rudin, 2015). The results of numerous clinical trials testing distinct therapeutic approaches for SCLC have been disappointing, and treatment programs have not changed in the last three decades (Byers and Rudin, 2015). Due to its metastatic nature at presentation, SCLC is rarely resected, leading to a scarcity of tumor material for analysis. In this context, mouse models of SCLC provide a powerful tool to study the biology of SCLC initiation, progression, and mechanisms of resistance (Kwon and Berns, 2013).
We have previously generated a mouse model of SCLC based on conditional inactivation of the tumor suppressor genes, Trp53 and Rb1, both of which are deleted in nearly all human SCLC cases (George et al., 2015, Meuwissen et al., 2003). The model recapitulates many salient features of SCLC, including its localization, metastatic progression, and histopathological characteristics (Gazdar et al., 2015, Meuwissen et al., 2003). In this model, recurrent genetic alterations included losses on chromosomes 8, 12, 14, 16, and 19 and both gains and losses on chromosome 4 (Dooley et al., 2011, McFadden et al., 2014). They likely provide a selective advantage to tumor cells during tumor evolution and may harbor driver genes in case of gene amplification. Chromosome 4 in particular often shows a number of genomic alterations such as focal deletions encompassing miR200a/miR200b, the hairy enhancer of split family of transcription factors (Hes2, Hes3, and Hes5), Trp73, and two focal amplifications, one encompassing Mycl and another Nfib (Calbo et al., 2011, McFadden et al., 2014).
MYCL is a basic-helix-loop-helix transcription factor reported to be an oncogene in SCLC. Several studies applying exome and whole genome sequencing reported recurrent amplification of the MYC family of oncogenes, including MYCL in SCLC (6.9%–9%) (Calbo et al., 2011, George et al., 2015, Iwakawa et al., 2013). In line with this observation, targeted overexpression of Mycl in a mouse model vastly accelerated tumor development (Huijbers et al., 2014).
NFIB belongs to the nuclear factor 1 (NFI) family of transcription factors. They were found as factors essential for adenovirus replication, but are now known to control expression of a large number of cellular genes (Gronostajski, 2000, Harris et al., 2015). The four members in vertebrates, NFIA, NFIB, NFIC, and NFIX, can bind as hetero and homodimers to the TTGGC(N5)GCCAA dyad symmetric consensus sequence and either activate or repress transcription depending on the context (Harris et al., 2015). They are expressed in multiple organ systems in partially overlapping patterns and play an important role in regulating tissue-specific expression programs (Harris et al., 2015). NFIB regulates proliferation and epithelial differentiation during lung maturation, and NFIB knockout animals have severe lung hypoplasia and developmental defects in the brain (Hsu et al., 2011, Steele-Perkins et al., 2005). In addition, it was reported to coordinate epithelial-melanocyte stem cell proliferation and differentiation in hair follicles, where it was shown to regulate the expression of 1,449 target genes (Chang et al., 2013). In the brain, NFIB regulates the differentiation of neural progenitor cells (Piper et al., 2014).
Several reports have defined NFIB as an oncogene (Dooley et al., 2011, Zhang et al., 2015). The chromosomal region encoding NFIB is amplified in patients with triple-negative breast cancer (Han et al., 2008), in patients with squamous cell carcinoma of the esophagus (Yang et al., 2001), and in submandibular gland carcinoma (Andreasen et al., 2016). Increased NFIB levels are also found in metastatic giant cell tumors of bone and are associated with an elevated risk of metastasis (Mosakhani et al., 2013, Quattrini et al., 2015). Using SCLC cell lines from both patients and mouse models, NFIB was shown to regulate apoptosis, senescence, and proliferation and to allow for anchorage-independent growth of fibroblasts (Dooley et al., 2011).
In contrast to MYC family genes, NFIB is amplified in a very limited number of human SCLC cases (George et al., 2015, Iwakawa et al., 2013). Considering the high frequency of its focal amplification in mouse, and its oncogenic potential in vitro, we decided to test how NFIB expression affects SCLC development in vivo and to examine its potential role in human SCLC.
Results
NFIB Accelerates SCLC Initiation and Progression
To assess the role of NFIB in driving SCLC, we generated two transgenic mouse strains that overexpressed Nfib concomitant with Trp53 and Rb1 loss, one expressing full-length Nfib (variant 1) and the other a shorter Nfib version lacking exons 9–11 (variant 3) (Figure S1A). Both variants contain the conserved DNA binding domain; however, the shorter one lacks a putative proline-rich transactivation domain at the C terminus (Gronostajski, 2000, Mermod et al., 1989). Both are expressed in normal mouse lung and in SCLC tumors of the Rb1F/F;Trp53F/F mouse model (Figure S1B). The targeted transgenes allowed for expression of the transgenic Nfib and firefly Luciferase (Luc) upon CRE mediated inversion (Figure S1C). Mouse models carrying similar targeted transgenes for either Mycl-Luc or Luc have been described previously (Huijbers et al., 2014). Four cohorts of animals were generated and analyzed in parallel as follows: (1) a control cohort of Rb1F/F;Trp53F/F and invCAG-Luc;Rb1F/F;Trp53F/F mice, (2) a Mycl cohort of invCAG-Mycl-Luc;Rb1F/F;Trp53F/F mice, (3) an Nfib cohort of invCAG-Nfib_v1-Luc;Rb1F/F;Trp53F/F and invCAG-Nfib_v3-Luc;Rb1F/F;Trp53F/F mice, and (4) an Nfib/Mycl cohort generated by crossbreeding of invCAG-Nfib_v1-Luc;Rb1F/F;Trp53F/F with invCAG-Mycl-Luc;Rb1F/F;Trp53F/F animals. The Nfib cohort contained both Nfib variants, since no significant differences were observed between them with regard to the parameters analyzed in this study. The Nfib/Mycl cohort was included to test whether NFIB can augment SCLC progression in combination with the strong oncogene MYCL and to gain insight into the selective pressure conferred by the frequent co-occurrence of Nfib and Mycl amplifications. All animals were injected intra-tracheally with adenovirus carrying the CRE recombinase driven from the ubiquitous CMV promoter. CRE expression resulted in the deletion of Trp53 and Rb1 and transcriptional activation of the transgenes (Figure S1D).
To monitor the dynamics of tumor development, we used bioluminescence imaging (Figures 1A and 1B). Control and Nfib cohort animals exhibited a similar tumor growth pattern, with a minimal increase in signal during the first weeks followed by a sharp switch to exponential growth. This switch occurred earlier in the Nfib cohort (median of 175 days) than in the control cohort (median at 201 days) (Figures 1A and 1B). In contrast, animals in both Mycl and Nfib/Mycl cohorts showed an exponential increase in the signal soon after its first detection with a median switch time of 109 and 89 days for Mycl and Nfib/Mycl, respectively (Figures 1A and 1B). The pattern of luciferase signal directly correlated with survival in the four cohorts (Figure 1C). Animals in the control group had the longest latency with a median of 235 days. NFIB overexpressing animals had a significantly decreased tumor latency (median survival of 193 days), with the two transcript variants in the Nfib cohort showing indistinguishable tumor acceleration when analyzed separately (Figure S1E). Mycl animals had decreased tumor latency as compared to both the control and Nfib mice (median latency of 146 days). A combination of NFIB and MYCL overexpression decreased tumor latency further to a median of 132 days. Therefore, NFIB and MYCL co-expression enhances SCLC development, consistent with their frequent co-amplification in mouse SCLC (Dooley et al., 2011).
Figure 1.

NFIB Accelerates Tumor Initiation and Progression in a Mouse Model of SCLC
(A) Schematic representation of the switched targeted transgene and measurements of luciferase activity from thorax over time following viral induction.
(B) Time point (in days) at which linear growth switched to exponential growth based on luciferase signal.
(C) Survival curves of animals within the four cohorts.
(D) Quantification of lesions (initial and advanced) at 70, 98, and 140 days following viral induction.
(E) A representative H&E staining of advanced lung lesions (taken from the control cohort, 193 days post-induction).
(F) Synaptophysin (SYN) staining of the same lung as in (E).
Error bars in (B) and (D) represent mean ± SEM.
See also Figures S1, S2, and S3.
To characterize the early stages of tumor formation, we sacrificed animals at distinct time points post-virus injection, starting at 70 days. Based on the luciferase signal, we did not expect any lesions in control and Nfib animals at that stage and expected some initial lesions in Mycl and Nfib/Mycl animals. Therefore, we included only one Mycl and one Nfib/Mycl mouse at this time point. Indeed, most of the lung was normal in both genotypes, with only four small hyperplastic lesions in each (Figures 1D, S2A, and S2B). We next collected lungs from animals in all groups 98 days following virus injection. No lesions were identified in the control cohort (three mice), and one lesion was found in one out of three lungs of the Nfib cohort. In contrast, both Mycl and Nfib/Mycl cohorts had multiple initial lesions (average 16.7 and 12 in Mycl and Nfib/Mycl, respectively, 3 lungs each). In addition, one Mycl lung and all three Nfib/Mycl lungs contained one or two advanced lesions (Figures 1D, S2C, and S2D). At 140 days following tumor induction, our final collection time point, animals in the control cohort showed minimal evidence of tumor initiation (a single lesion in one out of four lungs) (Figure 1D). In contrast, the Nfib cohort contained multiple initial lesions (average of 8.3, four lungs), and one out of four lungs contained two advanced lesions (Figure 1D). At the same time point, both Mycl and Nfib/Mycl animals had multiple initial and advanced lesions, with an average of 12 initial and 4.7 advanced for Mycl, and 11 initial and 7 advanced for Nfib/Mycl (Figures 1D, S2E, and S2F). Initial lesions in the control cohort became evident at 175 days post-injection (data not shown). Thus, overexpression of Nfib accelerated tumor initiation by 5 weeks, while overexpression of Mycl and Nfib/Mycl accelerated tumor initiation by 15 weeks.
We next performed a detailed histological evaluation of animals sacrificed due to respiratory distress. Full necropsy was carried out, and tissues were sectioned and stained with H&E. A range of lesions from atypical hyperplasia and intraepithelial neoplasia to advanced SCLC were identified in lung sections from animals in all groups. They were mainly located in the central lung and frequently within the mediastinum (Figure 1E). Peripheral lesions within the alveolar compartment were also found. Next, we stained lung sections with markers of neuroendocrine (NE) differentiation (synaptophysin, chromogranin, NCAM, and CGRP). All lesions were positive for these markers, confirming their NE origin (Figure 1F; data not shown). Interestingly, 10 out of 29 of the Nfib/Mycl animals and 4 out of 26 of the Nfib animals developed NE tumors within the trachea (Figures S3A–S3C). This was evident from both the luciferase imaging and histological evaluation (Figures S3A and S3B). This phenotype was driven by NFIB, as none of the Mycl mice (0 out of 32) had tumors in the trachea (Figure S3C). Interestingly, while NE cells within the central lung are mostly found in clusters (neuroendocrine bodies), NE cells in the trachea appear as single cells (Figures S3D and S3E).
Thus NFIB significantly accelerated tumor initiation and progression in the lung and supported tumor induction at a novel location, the trachea.
NFIB Is Associated with Chromosomal Instability
Focal amplifications of Nfib are frequently observed in mouse SCLC model (Dooley et al., 2011). However, other genes located near the Nfib locus are often co-amplified, e.g., Tyrp1, Mpdz, Cer1, Frem1, Zdhhc21, and Psip1, some of which have previously been implicated in tumor development (Cermáková et al., 2014, French et al., 2016, Ghanem and Fabrice, 2011). To examine whether transgenic Nfib expression is sufficient to eliminate the selective pressure for amplification of the corresponding endogenous locus, the copy number of Nfib in tumors from Nfib mice was examined using qPCR (Figures 2A and 2B). Previously we showed that the Mycl locus is not amplified in 95% of tumors of Mycl mice, arguing that the Mycl transgene abrogates the requirement for its amplification (Figure 2B) (Huijbers et al., 2014). Similarly, all tumors driven by the Nfib transgene exhibited a normal DNA copy number of the endogenous Nfib locus (Figures 2A and 2B). In combination with the accelerated SCLC tumor growth, this formally proves that Nfib is a bona fide driver of SCLC.
Figure 2.

NFIB Is Associated with Increased Chromosomal Instability
(A and B) Copy number of Nfib (A) and Mycl (B) genomic locus in control, Mycl, and Nfib cohort tumors. The dotted line indicates the threshold.
(C and D) Genomic rearrangement and copy-number alterations on chromosome 4 in control (C) and Nfib (D) tumors. Line coloring indicates orientation of fusion ends.
(E and F) Total number of copy-number aberration (CNA) events on chromosome 4 (E) and in the whole genome (F) in different tumor classes (indicated by ∗). Copy-number gain (log2 ratio > 0.459) and loss (log2 ratio < −0.67).
Data are mean ± SEM.
Amplification of the Mycl locus was detected in 33% of tumors in Nfib mice (6 out of 18 tumors). Conversely, the Nfib locus was amplified in 3 out of 20 tumors (15%) in Mycl mice (Figures 2A and 2B). These amplifications are in line with the reduced tumor latency observed in the Nfib/Mycl cohort and support a selective benefit for co-expression of Nfib and Mycl in SCLC. In control tumors, concurrent amplification of Nfib and Mycl is observed in 35% (9 out of 26) of cases (Figures 2A and 2B). These co-amplifications are striking, since both genes are never part of the same amplicon despite being juxtaposed on chromosome 4 (40.6 Mb apart). To gain better insight into the mechanism of co-amplification, we performed mate-pair sequencing on tumors of control and Nfib mice (Figures 2C and 2D). The tumors showed focal amplifications on chromosome 4, including Nfib and/or Mycl loci. We observed intrastrand chromosomal rearrangements leading to a re-shuffle of the chromosome in three out of five tumors examined. This type of intrastrand rearrangements was only observed on chromosome 4. This suggests that these rearrangements frequently occur simultaneously and are likely the result of a single catastrophic event, in line with several case reports for human SCLC (George et al., 2015, Iwakawa et al., 2013, Stephens et al., 2011). Observed amplifications likely reflect clonal evolution causing the heterogeneity we describe below.
To obtain an estimate of the overall genomic stability in SCLC in our mouse models, low-coverage whole genome sequencing was performed on a panel of tumors. The tumors were divided into different classes based on the type of transgene, on the focal amplification of either the Nfib or Mycl locus, and on their expression (Table 1). This division into classes allowed us to link genomic aberrations to gene expression of Nfib alone (Nfib class), Mycl alone (Mycl class), or both (Nfib/Mycl class). Both control and Mycl class tumors had a limited number of copy-number aberrations (CNAs). Surprisingly, Nfib class tumors showed a significantly increased number of CNA events compared to control and Mycl class tumors, and these chromosomal rearrangements were widely spread over the genome and chromosome 4 (Figures 2E and 2F). Interestingly, we also observed an increase in the number of CNA events when comparing Nfib/Mycl to Mycl class, suggesting that chromosomal instability is specifically associated with Nfib overexpression (Figures 2E and 2F).
Table 1.
Classes Based on Status of Nfib and Mycl in the Tumor
| Class | Mouse Genotype (Rb1F/F;P53F/F;invCAG-) | Tumor Genotype (Endogenous Locus) | Tumor Expression (qPCR Relative to Normal Lung) | |
|---|---|---|---|---|
| Controla | Luc (or WT) | Nfib and Mycl normal | and/or | Nfib and Mycl normal |
| Nfiba | Nfib-Luc | |||
| Luc (or WT) | Nfib, copies > 8 | and/or | Nfib, REU > 8 | |
| Mycla | Mycl-Luc | |||
| Luc (or WT) | Mycl, copies > 8 | and/or | Mycl, REU > 100 | |
| Nfib/Mycla | Nfib-Luc;Mycl-Luc | |||
| Nfib-Luc | Mycl, copies > 8 | and/or | Mycl, REU > 100 | |
| Mycl-Luc | Nfib, copies > 8 | and/or | Nfib, REU > 8 | |
| Luc (or WT) | Mycl, copies > 8 and Nfib, copies > 8 | and/or | Mycl, REU > 100 and Nfib, REU > 8 |
Indicates tumor class in figures. WT, wild type; REU, relative expression units.
NFIB Changes the Metastatic Profile
One of the key characteristics of SCLC is its aggressive metastatic dissemination. We therefore asked whether Nfib overexpression affected metastatic behavior of SCLC cells. The original Trp53;Rb1 SCLC mouse model primarily shows metastasis to the liver (Meuwissen et al., 2003). We stained livers with NCAM antibody to identify NE metastatic lesions and quantified the number of animals that carried liver metastasis within each of the four classes (Table 1). Considering the prevalence of upper airway lesions and associated early lethality, which likely prevented full metastatic dissemination, animals carrying both Nfib and Mycl transgenes were excluded from the analysis. Only 1 out of 7 animals and 3 out of 13 animals in the control and Mycl class, respectively, showed liver metastasis (Figure 3A). In contrast, the majority of animals in the two Nfib containing classes had liver metastases. Specifically, 8 out of 10 Nfib class animals and 17 out of 21 Nfib/Mycl class animals had multiple metastases in the liver (Figure 3A). Further characterization of liver samples revealed that some livers contained only a few foci, while others showed massive colonization by NCAM-positive cells. Also, metastatic foci themselves varied in size. Therefore, we quantified both the number of foci and the relative area of the liver occupied by metastases (Figures 3B and 3C). Control class animals had on average 1.5 ± 1.5 and Mycl class animals had 1 ± 0.6 metastatic foci per liver section. In contrast, Nfib class animals contained on average 9.7 ± 3 foci and Nfib/Mycl class animals 31 ± 10 foci per liver section (Figure 3B). The two Nfib isoforms showed a similar pattern (Figure S4A). Also, the area covered by liver metastases was significantly higher within the two Nfib containing classes when compared to both control and Mycl classes (Figure 3C). Importantly, all the liver samples with the highest metastatic load belonged to Nfib/Mycl class, while animals in the Nfib and Mycl classes had on average an intermediate and low tumor load, respectively (Figures 3B–3F).
Figure 3.

NFIB Promotes Metastases and Changes the Metastatic Profile
(A) Percent of animals with and without liver metastasis in each of the four classes.
(B) Quantification of the number of liver metastasis in each class.
(C) Quantification of the percent area of the liver covered by metastatic lesions in each of the four classes. Circles with a shaded upper or lower half indicate animals with kidney and bone metastasis, respectively. Circles marked with a central dot indicate animals with metastasis to both kidney and bone.
(D–F) Representative liver section from the three classes, Mycl (D), Nfib (E), and Nfib/Mycl (F), stained with NCAM to identify NE metastatic lesions.
(G) NE metastasis in the kidney, H&E.
(H) Percent of animals in each class with metastatic lesions outside the liver (bone, kidney).
(I) Number of animals in Mycl and Nfib/Mycl cohort that provided successful culture of NE cells from the blood.
Scale bars in (D)–(F), 200 μm. Scale bar in (G) represents 100 μm. See also Figure S4.
NFIB also changed the metastatic profile. We noted metastases to kidney and bone (Figures 3G, S4B, and S4C). All these cases belonged to either the Nfib or Nfib/Mycl class (Figures 3B, 3C, and 3H). In all instances, metastases were exclusively composed of NE cells as judged by SYN and NCAM staining and their morphology (Figures 3D–3F; data not shown). Thus, NFIB promotes more extensive metastasis in the SCLC mouse model.
The transgenic Nfib/Mycl cohort showed a relatively low incidence of metastasis (7 out of 28 animals) (data not shown). To test whether, despite early lethality and presence of upper airway lesions, NFIB also conferred metastatic potential in the transgenic Nfib/Mycl cohort, we looked for the presence of circulating tumor cells as a surrogate indicator of metastasis. In the absence of a suitable surface marker that would allow us to reliably quantify these cells, we collected blood from animals in Mycl and Nfib/Mycl cohorts and initiated cultures using media that supports growth of NE cells. The success rate of culturing NE cells was significantly higher in Nfib/Mycl cohort animals (6 out of 10), as compared to Mycl cohort animals (2 out of 11) (Figure 3I). One of the two Mycl animals that did exhibit growth from circulating tumor cells showed Nfib overexpression (20-fold increase by qPCR), indicating that it actually should be counted as belonging to the Nfib/Mycl class in this assay (data not shown). Therefore, NFIB is supporting metastasis of the tumor cells by promoting their intravasation, their survival, or both at early stages of dissemination.
NFIB Activates a Migration and Survival Program
In order to identify the putative targets of NFIB and to understand its role in tumor development and metastasis, we established SCLC cell lines from Mycl cohort tumors with low NFIB expression. We overexpressed mouse Nfib in four of these cell lines to examine the differential gene expression profiles (Figures S5A–S5C). We observed 148 upregulated and 70 downregulated genes following NFIB overexpression (Figure 4A; Table S1). To identify the signaling networks likely responsible for driving tumor progression, we performed functional clustering analysis of the differentially expressed genes using the Ingenuity Pathway Analysis. Analysis of upregulated genes showed significant enrichment for cellular growth and proliferation, cellular movement, and cell death and survival pathways (Figure 4B). 46 out of 148 upregulated genes were implicated in cell motility, and 50 out of 148 upregulated genes were associated with cell death and survival (Figure 4B). The cell motility category showed the highest activation Z score of 3.83, strongly indicating that genes upregulated following NFIB overexpression increased cell motility (Figure 4C). Some of the upregulated genes that were assigned to cell movement, cell death, and survival were validated by qPCR (Figure 4D; Figure S5D).
Figure 4.

Key Changes in Cancer Progression Following NFIB Overexpression In Vitro
(A) Analysis of the gene expression changes following Nfib overexpression in four mouse SCLC primary cell lines (heatmap). DEGs were selected if expressed in at least three out of four samples. Values are represented as log2 fold change. Red, upregulated (average log2 fold change > 0.5); green, downregulated genes (average log2 fold change < −0.5).
(B) Ingenuity pathway analysis (IPA) of differentially expressed genes based on Z score and p value. The biological functions that are expected to be increased according to the gene expression changes in our dataset were identified using the IPA regulation Z score algorithm (green dot). The p value was calculated with the Fischer’s exact test (p value ≤ 0.05).
(C) Genes involved in cell movement. Orange dashed line, predicting activation of cell movement; green dashed line, unknown directionality; black dashed line, effect not predicted.
(D) Validation of several genes in (C) by qPCR. Error bars represent mean ± SD.
NFIB Drives Tumor Dedifferentiation and Invasion
The ability to metastasize is often associated with dedifferentiation (Ellenbroek et al., 2012). Given the strong metastatic behavior of NFIB expressing tumors, we asked whether NFIB was associated with dedifferentiation. Indeed, early lesions that were low or negative for NFIB expressed high levels of SYN, whereas lesions with strong NFIB expression showed a clear reduction in SYN (Figures 5A and 5B). Similarly, in advanced lesions, the NFIB high (NFIBhi) populations showed signs of dedifferentiation, as judged by a decreased level of SYN (Figures 5D, 5E, S6A, and S6B).
Figure 5.

NFIB Drives Tumor Dedifferentiation and Invasion
(A–C) Early lesions NFIB (A), SYN (B), and CDH1 (C) staining, respectively (Nfib cohort).
(D–F) Advanced lesion NFIB (D), SYN (E), and CDH1 (F) staining, respectively (Mycl cohort).
(G) Whole lung, CDH1 staining (Mycl cohort).
(H and I) Part of the lung indicated with dotted area in (G), CDH1 (H) and NFIB (I), respectively. Invasive sheaths indicated with arrowheads.
(J) Whole lung, CDH1 staining (Nfib cohort).
(K and L) Diagrams of tumor growth and local and distant metastatic dissemination. NE tumor cells are abundantly found in lymph vessels. Without NFIB overexpression, intrapulmonary dissemination and metastatic load in liver is very limited (K). With NFIB overexpression, there is massive intrapulmonary dissemination, large metastatic load in the liver, and metastasis to kidney and bone (L).
Scale bars in (A)–(F) represent 100 μm. Scale bars in (H) and (I) represent 500 μm. See also Figure S6.
Another well-known prometastatic feature is increased invasiveness and decreased expression of adhesion molecules, such as E-cadherin (CDH1). All early lesions expressed CDH1, regardless of the NFIB level (Figures 5C and S6C), whereas NFIBhi “dedifferentiated” populations within advanced lesions had frequently lost this marker (Figure 5F).
Based on the above, we predicted an increase in both dedifferentiation and invasiveness within the Nfib cohort as compared to control and Mycl cohorts. Indeed, a large proportion of the tumors in the lungs of control and Mycl mice expressed high levels of CGRP and CDH1 and showed limited invasion (Figures 5G and 5K; data not shown). Still, we often found areas negative for CDH1 (CDH1−) juxtaposed to CDH1hi areas (Figures 5G, 5H, and S6D), the former possibly resulting from reseeding events. The CDH1− cells expressed high levels of NFIB and were CGRP/SYNlo (Figures 5I, S6E, and S6F). These NFIBhi/CGRPlo/CDH1− sub-populations often presented as pools of dedifferentiated tumor cells that invaded perivascular and peribronchial spaces, forming sheath-like patterns that are indicative of their strong disseminating capability (Figures 5H, 5I, and 5L). Consistent with this, tumors in the Nfib cohort were predominantly invasive and consisted primarily of NFIBhi/CGRPlo/CDH1− cells (Figure 5J). Interestingly, while we often found scattered p44/42 MAPK-positive cells within NFIBlo/CGRPhi/CDH1hi regions, the NFIBhi/CGRPlo/CDH1− areas were invariably p44/42-negative (Figures S6G–S6I).
All tumors, irrespective of NFIB levels, expressed ASCL1, a factor required for SCLC survival, and SOX2, shown to be amplified in a subset of SCLCs (Augustyn et al., 2014, Rudin et al., 2012). TTF1, also often expressed in SCLC (Travis, 2012), showed variable levels without a clear correlation with NFIB staining (data not shown).
Lungs from animals in all cohorts contained frequent vascular invasions that were already present early on following tumor induction (Figure S7A). To define invasion routes, we stained sequential lung sections with SYN, CD31, and podoplanin to mark NE cells, blood, and lymph vessels. NE cells were found in clusters and invaded mainly lymph vessels (Figures S7B and S7C; data not shown). Both CDH1+ and CDH1− cells could be found within vessels (Figure S7D). NFIB levels were moderate to high in NE cells present in lymph vessels (Figures S7E and S7F) and correlated with a stronger lymphovascular invasion (LVI) phenotype.
Given the abundant LVIs in our mouse model we were curious to see whether the LVIs previously reported for human SCLC show prominent expression of NFIB. Histological sections of SCLC from patients in which this could be assessed are not readily available. However, we did obtain sections from a human large cell neuroendocrine carcinoma (LCNEC) that showed LVIs (Figure S7G). Consistent with the mouse data, NE cells in these sections were NFIBhi (Figure S7H) while being CDH− (Figure S7I). This suggests that the process of tumor progression in high-grade NE tumors may also be linked to NFIB expression in humans. Indeed, critical driver lesions (RB1, p53, MYC, and NFIB) and changes in the expression of differentiation markers (CDH1, CGRP, SYN) as well as the route of tumor dissemination (LVI) are shared features of SCLC in humans and mice (Figures 5K and 5L).
NFIB Expression Is Correlated with Metastatic Disease in Human SCLC and LCNEC
The phenotypes described above point to the importance of NFIB in the acquisition of a high-grade invasive, dedifferentiated, and metastatic tumor state. We therefore tested whether NFIB is expressed in pulmonary neuroendocrine tumors (pNETs) of various grades. According to the recent edition of the World Health Organization, pNETs are classified into low-grade typical carcinoids (TCs), intermediate grade atypical carcinoid (AC), and high-grade NE carcinomas, the latter including both (LCNEC and SCLC) (Travis et al., 2015). We retrieved a panel of 48 pNET tumor samples from the archive of the Antoni van Leeuwenhoek hospital. The panel included TC, AC, LCNEC, and SCLC cases. Strikingly, while being absent or weakly expressed in all TC (10) (Figures 6A, 6B, and 6M) and in all AC (6) samples (Figures 6D, 6E, and 6M), NFIB was highly expressed in 22 out of 26 SCLC samples, including those derived from primary (13 out of 15) and metastatic (9 out of 11) sites (Figures 6J, 6K, and 6M). A significant spread in NFIB expression was evident in LCNEC cases (high expression in three out of six cases) (Figures 6G, 6H, and 6M). CDH1 expression showed an opposite trend, with rather high expression in more differentiated, low- and intermediate-grade TC and AC, and significantly lower average expression in SCLC and LCNEC (Figures 6C, 6F, 6I, 6L, and 6N). Strikingly, NFIBlo expressing cases showed significantly better overall survival compared to NFIBhi cases (Figure 6O). Further analysis of patient data indicated that five out of seven NFIBlo cases represented low-stage SCLC and LCNEC (stage I/II), and none of the NFIBlo category presented with stage IV disease characterized by distant metastases. In contrast, 23 out of 24 patients in the NFIBhi group for which we had records had stage III/IV disease. These data fully align with the results obtained in our mouse models.
Figure 6.

NFIB Marks Metastatic Disease in Patients
(A–C) Representative image of H&E (A), NFIB (B), and CDH1 (C) expression in typical carcinoid (TC).
(D–F) Representative image of H&E (D), NFIB (E), and CDH1 (F) expression in atypical carcinoid (AC).
(G–I) Representative image of H&E (G), NFIB (H), and CDH1 (I) expression in large cell NE carcinoma (LCNEC).
(J–L) Representative image of H&E (J), NFIB (K), and CDH1 (L) expression in SCLC.
(M and N) Quantification of NFIB (M) and CDH1(N) expression in human pNET samples, respectively.
(O) Survival curves of patients within high-grade pNET (LCNEC and SCLC).
Discussion
Well-designed mouse models are invaluable for understanding the processes underlying initiation, progression, and metastatic spread of SCLC and to rationally design better intervention strategies (Semenova et al., 2015). This is particularly important in view of the poor access to both early and progressed tumor lesions in patients. Several groups have successfully utilized Rb1F/F;Trp53F/F mouse models to identify and validate other oncogenic drivers, including MYCL, PTEN, and RBL2 as well as NOTCH and Hedgehog pathway components (Gazdar et al., 2015). Genome sequencing of human SCLC has pointed to a number of additional drivers that likely lead to the variations we observe in NE tumors. Here we show that NFIB is a prominent driver in SCLC, with a key role in shaping the aggressive nature of this tumor type.
NFIB Accelerates SCLC Initiation
We show that NFIB significantly accelerates SCLC initiation and progression in our mouse models. Forced NFIB overexpression allowed for more efficient and frequent initiation of NE lesions and led to tumor development at new sites, i.e., trachea. The striking predominance of tracheal lesions in the Nfib/Mycl cohort (with several cases in the Nfib cohort) and its absence in the Mycl cohort supports the critical role of NFIB in the development of these tumors. We hypothesize that the combination of the single-cell nature of NE cells in the trachea and environmental factors make these cells more refractory to tumor initiation and that NFIB is required to overcome these less favorable conditions for outgrowth.
NFIB Overexpression Is Associated with Increased Chromosomal Instability
An unexpected observation was the increased chromosomal instability in NFIB-driven tumors. Gene expression analysis did not reveal a candidate gene or signature associated with the control of cell replication or DNA repair. However, the increase in chromosomal aberrations observed in NFIB overexpressing cells may well be explained by a higher tolerance for chromosomal instability resulting from NFIB’s anti-apoptotic activity as previously found in SCLC cell lines and mouse embryonic fibroblasts (Dooley et al., 2011).
NFIB Is a Potent Driver of Metastasis
We show that NFIB promotes metastasis not only by increasing the local dissemination of the tumor cells within the lung but also by altering their metastatic profile, permitting colonization of a wider set of tissues. We identified gene signatures for proliferation and cellular movement imposed by NFIB overexpression in mouse SCLC cell lines. The profiles were in line with the observed phenotypes in the NFIB driven tumors and highlighted the ability of NFIB to modify a number of distinct behavioral features of NE cells, making them more capable to invade and colonize foreign sites.
We have previously shown that communication between NE (p44/42-negative) and NonNE (p44/42-positive) cells is required for efficient metastasis of subcutaneously grafted SCLC cells (Calbo et al., 2011, Kwon et al., 2015). Interestingly, p44/22-positive cells were only found in NFIBlo regions. Although NonNE cell cultures can be easily established from isolated tumors, their identity in vivo remains elusive. It might be that these p44/42-positive cells represent this NonNE population and that they play their own specific role in assisting NE cell survival, outgrowth, and dissemination.
NFIB Overexpression Results in Dedifferentiated Aggressive Tumors
Tumors in our SCLC mouse models showed both differentiated and dedifferentiated characteristics. High NFIB expression was associated with dedifferentiation and invasive behavior evidenced by the presence of perivascular and peribronchial sheath-like dissemination. This type of invasive behavior was most prevalent in the Nfib cohort. In line with this, we found a consistent negative correlation between the expression of NFIB and NE differentiation markers in advanced lesions. Unlike advanced lesions, a subset of NFIBhi early lesions showed high levels of NE differentiation markers, indicating that NFIB-driven dedifferentiation is at least in part a gradual process.
Once tumors start to progress, we see striking heterogeneity with respect to CDH1 expression, loss of which has been associated with metastatic spread (Schneider and Kolligs, 2015, Singhai et al., 2011). All early lesions are CDH1+, in LVIs the expression is heterogeneous, and it is lost in disseminated tumors. Consequently, the CDH1− lesions might well have arisen from reseeding events. The pattern of colonization within the lung supports this. In conclusion, NFIB is critical for forcing dedifferentiation of NE tumor lesions, thereby augmenting their invasive behavior.
NFIB Regulation
NFIB belongs to a family of transcription factors capable of binding and regulating a plethora of targets. This makes the dissection of the exact molecular mechanisms underlying NFIB-mediated oncogenic transformation a challenge. At the same time, this multifaceted function might be needed for progression and colonization of new metastatic sites.
In contrast to the highly conserved N-terminal DNA binding domain, the C-terminal region of NFIB diverges extensively between members of the NFI transcription factor family as well as between isoforms (Liu et al., 1997). The C-terminal region encodes a putative transactivation domain (Mermod et al., 1989). Overexpression of the two isoforms that differ in this C-terminal region resulted in indistinguishable phenotypes. Therefore, the role of this domain for tumor progression and metastasis appears to be negligible.
Little is known about the regulation of NFIB expression. The transcription factor PAX6, a member of the paired box gene family, has been shown to bind and regulate NFI family proteins, including NFIB (Holm et al., 2007, Ninkovic et al., 2013). In addition, several microRNAs (mRNAs), such as miR-124, miR-1246, and miR-153, have been reported to regulate NFIB (Tsai et al., 2014, Wang et al., 2015, Zhang et al., 2015). These miRNAs bind NFIB transcripts in the 3′ UTR. Altered expression of these miRNAs could therefore lead to NFIB upregulation in tumors.
It is worth noting that the mouse model brought NFIB to light, which otherwise would have been overlooked due to paucity of genomic aberrations encompassing the NFIB locus in human SCLC. This also emphasizes the added value of monitoring RNA and protein expression in parallel with the identification of genomic aberrations. The importance of conducting such analyses at the single cell level is nicely illustrated by the extensive and profound heterogeneity that we observe in mouse SCLC and that is also seen in human SCLC.
NFIB Marks Metastatic Disease in Human SCLC and LCNEC
The important role of NFIB in mouse SCLC prompted us to scrutinize its relevance for SCLC development in human. Utilizing a panel of human pNETs, we could show that NFIB is often highly expressed in NE human tumors, such as SCLC and LCNEC, as compared to the low- and intermediate-grade cancers, such as TC and AC.
Importantly, the majority of high-stage SCLC and LCNEC were NFIBhi, whereas the few tumor samples that were NFIBlo represented mainly stage I/II cases, and consequently these patients showed prolonged survival. This points to the biological significance of NFIB in commanding a highly proliferative, dedifferentiated, migratory, and invasive state that is a characteristic of metastatic disease in patients. The data are highly consistent with our results obtained in the mouse. When patients present with stage I/II disease, high expression of NFIB may already be indicative for a high probability of early progression with micro-metastasis. Therefore, our data point to a possible prognostic value of NFIB and call for analysis of a large patient cohort. However, before such prognostic marker can be useful, efficient early detection methods (i.e., liquid biopsy sequencing) have to be in place.
In summary, high NFIB expression marks high-grade tumor populations both in a mouse model of SCLC and in human pNETs. The specific set of features influenced by NFIB makes this transcription factor particularly potent in promoting tumor progression and metastatic dissemination. Therefore, analysis of targets downstream of NFIB and detailed dissection of molecular mechanisms involved in NFIB driven phenotypes may help to understand the key biological peculiarities of SCLC. In the same vein it will be important to identify the gene(s) that control the levels of NFIB as they likely serve as important master regulators of metastasis.
Experimental Procedures
More detailed procedures are described in the Supplemental Information.
Ethics Statement
The study was performed in accordance with the Dutch and European regulations on care and protection of laboratory animals. All animal experiments were approved by the local animal experimental committee, DEC NKI (OZP ID: 10023).
Genetic Engineering in Rb1F/F;Trp53F/F ESCs and Generation of Mice
The pFrt-invCAG-Nfib_v1-Luc and pFrt-invCAG-Nfib_v3-Luc vectors were introduced in a rederived Col1a1-frt targeted Rb1F/F;Trp53F/F embryonic stem cell (ESC) clone (NKI GEMM-ESC resource at www.infrafrontier.eu, clone TMA11101) by means of Flpe-mediated transgene integration as described (Huijbers et al., 2015).
DNA Sequencing and Copy-Number Profiling
Genomic DNA library was prepared by TruSeq DNA LT Sample Preparation kit (Illumina) and was sequenced using an Illumina HiSeq2000/2500 machine according to manufacturer’s instructions. To obtain copy-number profiles, we used CopywriteR tool (Kuilman et al., 2015).
Next-generation MPS mate-pair libraries were prepared using the Nextera Mate Pair Sample Preparation Kit (Illumina) (Stephens et al., 2011).
Human SCLC Patient Specimens
This study was approved by the institutional review board of the NKI-AVL. We collected archived formalin fixed and paraffin embedded samples of 48 TC, AC, LCNEC, and SCLC patients. The samples were primary and metastatic tumors diagnosed as stage I/IV. The H-score was determined by assessing the extent of immunoreactivity for NFIB and CDH1 (ECAD) by K.M. and E.A.S. (Table S2). An H-score above 150 was considered NFIBhi. Overall survival was determined by the length of time from diagnosis to last date of follow-up at which patients were still alive.
Statistical Analysis
Kaplan-Meier survival curves were analyzed using the log-rank test. All p values were calculated using a nonparametric Mann-Whitney test. Data shown in column graphs represent the mean ± SD. Statistical analyses were performed by GraphPad Prism6.
Author Contributions
E.A.S, M.-C.K., E.v.M., I.J.H., and A.B. conceived, designed, and analyzed the mouse experiments. M.C., J.v.d.V., J.-P.L., and N.P. performed these experiments. C.P. and I.J.H. conceived, designed, and made the mouse models. E.A.S., K.M., and E.F.S. conceived, designed, and analyzed human experiments. K.M., D.P., and W.A.B. performed these experiments. E.A.S. and J.-Y.S. performed the histopathological survey of mouse tissues. J.Z. performed the stainings. R.B., O.K., T.K., and A.V. performed computational analysis. E.A.S, M.-C.K., I.J.H., and A.B. wrote the manuscript with input from K.M., J.-Y.S., and R.B.
Acknowledgments
We thank members of the animal facility of the Netherlands Cancer Institute for maintaining the mice; the division of animal pathology members Ellen Riem, Joost van Ooij, Lex de Vrije, and Jelrik van der Meer for producing high-quality histopathologic samples; and the sequencing facility for sequencing the numerous samples. We thank Rahmen Bin Ali and Fina van der Ahé for excellent technical assistance. We thank Patrick Min for assistance with image preparation. We would like to acknowledge the NKI-AVL Core Facility Molecular Pathology & Biobanking (CFMPB) for supplying NKI-AVL Biobank material and/or lab support. This study was supported by a WKO grant to A.B. by the Dutch Cancer Society, a Synergy ERC grant in which A.B. is one of the principal investigators, and a National Roadmap grant for Large-Scale Research Facilities of the Netherlands Organization for Scientific Research.
Published: June 30, 2016
Footnotes
Supplemental Information includes Supplemental Experimental Procedures, seven figures, and two tables and can be found with this article online at http://dx.doi.org/10.1016/j.celrep.2016.06.020.
Contributor Information
Ivo J. Huijbers, Email: i.huijbers@nki.nl.
Anton Berns, Email: a.berns@nki.nl.
Accession Numbers
The accession number for the sequences reported in this paper is NCBI BioProject: SRP075877. The accession number for RNA sequencing data is GEO: GSE82005.
Supplemental Information
References
- Andreasen S., Persson M., Kiss K., Homøe P., Heegaard S., Stenman G. Genomic profiling of a combined large cell neuroendocrine carcinoma of the submandibular gland. Oncol. Rep. 2016;35:2177–2182. doi: 10.3892/or.2016.4621. [DOI] [PubMed] [Google Scholar]
- Augustyn A., Borromeo M., Wang T., Fujimoto J., Shao C., Dospoy P.D., Lee V., Tan C., Sullivan J.P., Larsen J.E. ASCL1 is a lineage oncogene providing therapeutic targets for high-grade neuroendocrine lung cancers. Proc. Natl. Acad. Sci. USA. 2014;111:14788–14793. doi: 10.1073/pnas.1410419111. [DOI] [PMC free article] [PubMed] [Google Scholar]
- Byers L.A., Rudin C.M. Small cell lung cancer: where do we go from here? Cancer. 2015;121:664–672. doi: 10.1002/cncr.29098. [DOI] [PMC free article] [PubMed] [Google Scholar]
- Calbo J., van Montfort E., Proost N., van Drunen E., Beverloo H.B., Meuwissen R., Berns A. A functional role for tumor cell heterogeneity in a mouse model of small cell lung cancer. Cancer Cell. 2011;19:244–256. doi: 10.1016/j.ccr.2010.12.021. [DOI] [PubMed] [Google Scholar]
- Cermáková K., Tesina P., Demeulemeester J., El Ashkar S., Méreau H., Schwaller J., Rezáčová P., Veverka V., De Rijck J. Validation and structural characterization of the LEDGF/p75-MLL interface as a new target for the treatment of MLL-dependent leukemia. Cancer Res. 2014;74:5139–5151. doi: 10.1158/0008-5472.CAN-13-3602. [DOI] [PubMed] [Google Scholar]
- Chang C.Y., Pasolli H.A., Giannopoulou E.G., Guasch G., Gronostajski R.M., Elemento O., Fuchs E. NFIB is a governor of epithelial-melanocyte stem cell behaviour in a shared niche. Nature. 2013;495:98–102. doi: 10.1038/nature11847. [DOI] [PMC free article] [PubMed] [Google Scholar]
- Dooley A.L., Winslow M.M., Chiang D.Y., Banerji S., Stransky N., Dayton T.L., Snyder E.L., Senna S., Whittaker C.A., Bronson R.T. Nuclear factor I/B is an oncogene in small cell lung cancer. Genes Dev. 2011;25:1470–1475. doi: 10.1101/gad.2046711. [DOI] [PMC free article] [PubMed] [Google Scholar]
- Ellenbroek S.I., Iden S., Collard J.G. Cell polarity proteins and cancer. Semin. Cancer Biol. 2012;22:208–215. doi: 10.1016/j.semcancer.2012.02.012. [DOI] [PubMed] [Google Scholar]
- French J.D., Johnatty S.E., Lu Y., Beesley J., Gao B., Kalimutho M., Henderson M.J., Russell A.J., Kar S., Chen X., On Behalf Of The Ovarian Cancer Association Consortium. Australian Ovarian Cancer Study Group. Australian Ovarian Cancer Study Germline polymorphisms in an enhancer of PSIP1 are associated with progression-free survival in epithelial ovarian cancer. Oncotarget. 2016;7:6353–6368. doi: 10.18632/oncotarget.7047. [DOI] [PMC free article] [PubMed] [Google Scholar]
- Gazdar A.F., Savage T.K., Johnson J.E., Berns A., Sage J., Linnoila R.I., MacPherson D., McFadden D.G., Farago A., Jacks T. The comparative pathology of genetically engineered mouse models for neuroendocrine carcinomas of the lung. J. Thorac. Oncol. 2015;10:553–564. doi: 10.1097/JTO.0000000000000459. [DOI] [PMC free article] [PubMed] [Google Scholar]
- George J., Lim J.S., Jang S.J., Cun Y., Ozretić L., Kong G., Leenders F., Lu X., Fernández-Cuesta L., Bosco G. Comprehensive genomic profiles of small cell lung cancer. Nature. 2015;524:47–53. doi: 10.1038/nature14664. [DOI] [PMC free article] [PubMed] [Google Scholar]
- Ghanem G., Fabrice J. Tyrosinase related protein 1 (TYRP1/gp75) in human cutaneous melanoma. Mol. Oncol. 2011;5:150–155. doi: 10.1016/j.molonc.2011.01.006. [DOI] [PMC free article] [PubMed] [Google Scholar]
- Gronostajski R.M. Roles of the NFI/CTF gene family in transcription and development. Gene. 2000;249:31–45. doi: 10.1016/s0378-1119(00)00140-2. [DOI] [PubMed] [Google Scholar]
- Han W., Jung E.M., Cho J., Lee J.W., Hwang K.T., Yang S.J., Kang J.J., Bae J.Y., Jeon Y.K., Park I.A. DNA copy number alterations and expression of relevant genes in triple-negative breast cancer. Genes Chromosomes Cancer. 2008;47:490–499. doi: 10.1002/gcc.20550. [DOI] [PubMed] [Google Scholar]
- Harris L., Genovesi L.A., Gronostajski R.M., Wainwright B.J., Piper M. Nuclear factor one transcription factors: divergent functions in developmental versus adult stem cell populations. Dev. Dyn. 2015;244:227–238. doi: 10.1002/dvdy.24182. [DOI] [PMC free article] [PubMed] [Google Scholar]
- Holm P.C., Mader M.T., Haubst N., Wizenmann A., Sigvardsson M., Götz M. Loss- and gain-of-function analyses reveal targets of Pax6 in the developing mouse telencephalon. Mol. Cell. Neurosci. 2007;34:99–119. doi: 10.1016/j.mcn.2006.10.008. [DOI] [PubMed] [Google Scholar]
- Hsu Y.C., Osinski J., Campbell C.E., Litwack E.D., Wang D., Liu S., Bachurski C.J., Gronostajski R.M. Mesenchymal nuclear factor I B regulates cell proliferation and epithelial differentiation during lung maturation. Dev. Biol. 2011;354:242–252. doi: 10.1016/j.ydbio.2011.04.002. [DOI] [PMC free article] [PubMed] [Google Scholar]
- Huijbers I.J., Bin Ali R., Pritchard C., Cozijnsen M., Kwon M.C., Proost N., Song J.Y., de Vries H., Badhai J., Sutherland K. Rapid target gene validation in complex cancer mouse models using re-derived embryonic stem cells. EMBO Mol. Med. 2014;6:212–225. doi: 10.1002/emmm.201303297. [DOI] [PMC free article] [PubMed] [Google Scholar]
- Huijbers I.J., Del Bravo J., Bin Ali R., Pritchard C., Braumuller T.M., van Miltenburg M.H., Henneman L., Michalak E.M., Berns A., Jonkers J. Using the GEMM-ESC strategy to study gene function in mouse models. Nat. Protoc. 2015;10:1755–1785. doi: 10.1038/nprot.2015.114. [DOI] [PubMed] [Google Scholar]
- Iwakawa R., Takenaka M., Kohno T., Shimada Y., Totoki Y., Shibata T., Tsuta K., Nishikawa R., Noguchi M., Sato-Otsubo A. Genome-wide identification of genes with amplification and/or fusion in small cell lung cancer. Genes Chromosomes Cancer. 2013;52:802–816. doi: 10.1002/gcc.22076. [DOI] [PMC free article] [PubMed] [Google Scholar]
- Kuilman T., Velds A., Kemper K., Ranzani M., Bombardelli L., Hoogstraat M., Nevedomskaya E., Xu G., de Ruiter J., Lolkema M.P. CopywriteR: DNA copy number detection from off-target sequence data. Genome Biol. 2015;16:49. doi: 10.1186/s13059-015-0617-1. [DOI] [PMC free article] [PubMed] [Google Scholar]
- Kwon M.C., Berns A. Mouse models for lung cancer. Mol. Oncol. 2013;7:165–177. doi: 10.1016/j.molonc.2013.02.010. [DOI] [PMC free article] [PubMed] [Google Scholar]
- Kwon M.C., Proost N., Song J.Y., Sutherland K.D., Zevenhoven J., Berns A. Paracrine signaling between tumor subclones of mouse SCLC: a critical role of ETS transcription factor Pea3 in facilitating metastasis. Genes Dev. 2015;29:1587–1592. doi: 10.1101/gad.262998.115. [DOI] [PMC free article] [PubMed] [Google Scholar]
- Liu Y., Bernard H.U., Apt D. NFI-B3, a novel transcriptional repressor of the nuclear factor I family, is generated by alternative RNA processing. J. Biol. Chem. 1997;272:10739–10745. doi: 10.1074/jbc.272.16.10739. [DOI] [PubMed] [Google Scholar]
- McFadden D.G., Papagiannakopoulos T., Taylor-Weiner A., Stewart C., Carter S.L., Cibulskis K., Bhutkar A., McKenna A., Dooley A., Vernon A. Genetic and clonal dissection of murine small cell lung carcinoma progression by genome sequencing. Cell. 2014;156:1298–1311. doi: 10.1016/j.cell.2014.02.031. [DOI] [PMC free article] [PubMed] [Google Scholar]
- Mermod N., O’Neill E.A., Kelly T.J., Tjian R. The proline-rich transcriptional activator of CTF/NF-I is distinct from the replication and DNA binding domain. Cell. 1989;58:741–753. doi: 10.1016/0092-8674(89)90108-6. [DOI] [PubMed] [Google Scholar]
- Meuwissen R., Linn S.C., Linnoila R.I., Zevenhoven J., Mooi W.J., Berns A. Induction of small cell lung cancer by somatic inactivation of both Trp53 and Rb1 in a conditional mouse model. Cancer Cell. 2003;4:181–189. doi: 10.1016/s1535-6108(03)00220-4. [DOI] [PubMed] [Google Scholar]
- Mosakhani N., Pazzaglia L., Benassi M.S., Borze I., Quattrini I., Picci P., Knuutila S. MicroRNA expression profiles in metastatic and non-metastatic giant cell tumor of bone. Histol. Histopathol. 2013;28:671–678. doi: 10.14670/HH-28.671. [DOI] [PubMed] [Google Scholar]
- Ninkovic J., Steiner-Mezzadri A., Jawerka M., Akinci U., Masserdotti G., Petricca S., Fischer J., von Holst A., Beckers J., Lie C.D. The BAF complex interacts with Pax6 in adult neural progenitors to establish a neurogenic cross-regulatory transcriptional network. Cell Stem Cell. 2013;13:403–418. doi: 10.1016/j.stem.2013.07.002. [DOI] [PMC free article] [PubMed] [Google Scholar]
- Piper M., Barry G., Harvey T.J., McLeay R., Smith A.G., Harris L., Mason S., Stringer B.W., Day B.W., Wray N.R. NFIB-mediated repression of the epigenetic factor Ezh2 regulates cortical development. J. Neurosci. 2014;34:2921–2930. doi: 10.1523/JNEUROSCI.2319-13.2014. [DOI] [PMC free article] [PubMed] [Google Scholar]
- Quattrini I., Pollino S., Pazzaglia L., Conti A., Novello C., Ferrari C., Pignotti E., Picci P., Benassi M.S. Prognostic role of nuclear factor/IB and bone remodeling proteins in metastatic giant cell tumor of bone: a retrospective study. J. Orthop. Res. 2015;33:1205–1211. doi: 10.1002/jor.22873. [DOI] [PubMed] [Google Scholar]
- Rudin C.M., Durinck S., Stawiski E.W., Poirier J.T., Modrusan Z., Shames D.S., Bergbower E.A., Guan Y., Shin J., Guillory J. Comprehensive genomic analysis identifies SOX2 as a frequently amplified gene in small-cell lung cancer. Nat. Genet. 2012;44:1111–1116. doi: 10.1038/ng.2405. [DOI] [PMC free article] [PubMed] [Google Scholar]
- Schneider M.R., Kolligs F.T. E-cadherin’s role in development, tissue homeostasis and disease: insights from mouse models: tissue-specific inactivation of the adhesion protein E-cadherin in mice reveals its functions in health and disease. BioEssays. 2015;37:294–304. doi: 10.1002/bies.201400141. [DOI] [PubMed] [Google Scholar]
- Semenova E.A., Nagel R., Berns A. Origins, genetic landscape, and emerging therapies of small cell lung cancer. Genes Dev. 2015;29:1447–1462. doi: 10.1101/gad.263145.115. [DOI] [PMC free article] [PubMed] [Google Scholar]
- Singhai R., Patil V.W., Jaiswal S.R., Patil S.D., Tayade M.B., Patil A.V. E-Cadherin as a diagnostic biomarker in breast cancer. N. Am. J. Med. Sci. 2011;3:227–233. doi: 10.4297/najms.2011.3227. [DOI] [PMC free article] [PubMed] [Google Scholar]
- Steele-Perkins G., Plachez C., Butz K.G., Yang G., Bachurski C.J., Kinsman S.L., Litwack E.D., Richards L.J., Gronostajski R.M. The transcription factor gene Nfib is essential for both lung maturation and brain development. Mol. Cell. Biol. 2005;25:685–698. doi: 10.1128/MCB.25.2.685-698.2005. [DOI] [PMC free article] [PubMed] [Google Scholar]
- Stephens P.J., Greenman C.D., Fu B., Yang F., Bignell G.R., Mudie L.J., Pleasance E.D., Lau K.W., Beare D., Stebbings L.A. Massive genomic rearrangement acquired in a single catastrophic event during cancer development. Cell. 2011;144:27–40. doi: 10.1016/j.cell.2010.11.055. [DOI] [PMC free article] [PubMed] [Google Scholar]
- Travis W.D. Update on small cell carcinoma and its differentiation from squamous cell carcinoma and other non-small cell carcinomas. Mod. Pathol. 2012;25(Suppl 1):S18–S30. doi: 10.1038/modpathol.2011.150. [DOI] [PubMed] [Google Scholar]
- Travis W.D., Brambilla E., Nicholson A.G., Yatabe Y., Austin J.H., Beasley M.B., Chirieac L.R., Dacic S., Duhig E., Flieder D.B. The 2015 World Health Organization classification of lung tumors: impact of genetic, clinical and radiologic advances since the 2004 classification. J. Thorac. Oncol. 2015;10:1243–1260. doi: 10.1097/JTO.0000000000000630. [DOI] [PubMed] [Google Scholar]
- Tsai P.C., Bake S., Balaraman S., Rawlings J., Holgate R.R., Dubois D., Miranda R.C. MiR-153 targets the nuclear factor-1 family and protects against teratogenic effects of ethanol exposure in fetal neural stem cells. Biol. Open. 2014;3:741–758. doi: 10.1242/bio.20147765. [DOI] [PMC free article] [PubMed] [Google Scholar]
- Wang Y., Huang C., Chintagari N.R., Xi D., Weng T., Liu L. miR-124 regulates fetal pulmonary epithelial cell maturation. Am. J. Physiol. Lung Cell. Mol. Physiol. 2015;309:L400–L413. doi: 10.1152/ajplung.00356.2014. [DOI] [PMC free article] [PubMed] [Google Scholar]
- Yang Z.Q., Imoto I., Pimkhaokham A., Shimada Y., Sasaki K., Oka M., Inazawa J. A novel amplicon at 9p23 - 24 in squamous cell carcinoma of the esophagus that lies proximal to GASC1 and harbors NFIB. Jpn. J. Cancer Res. 2001;92:423–428. doi: 10.1111/j.1349-7006.2001.tb01112.x. [DOI] [PMC free article] [PubMed] [Google Scholar]
- Zhang Q., Cao L.Y., Cheng S.J., Zhang A.M., Jin X.S., Li Y. p53-induced microRNA-1246 inhibits the cell growth of human hepatocellular carcinoma cells by targeting NFIB. Oncol. Rep. 2015;33:1335–1341. doi: 10.3892/or.2015.3715. [DOI] [PubMed] [Google Scholar]
Associated Data
This section collects any data citations, data availability statements, or supplementary materials included in this article.