

Abstract
RAS-like protein expressed in many tissues 1 (RIT1) is a disease-associated RAS subfamily small guanosine triphosphatase (GTPase). Recent studies revealed that germ-line and somatic RIT1 mutations can cause Noonan syndrome (NS), and drive proliferation of lung adenocarcinomas, respectively, akin to RAS mutations in these diseases. However, the locations of these RIT1 mutations differ significantly from those found in RAS, and do not affect the three mutational “hot spots” of RAS. Moreover, few studies have characterized the GTPase cycle of RIT1 and its disease-associated mutants. Here we developed a real-time NMR-based GTPase assay for RIT1 and investigated the effect of disease-associated mutations on GTPase cycle. RIT1 exhibits an intrinsic GTP hydrolysis rate similar to that of H-RAS, but its intrinsic nucleotide exchange rate is ∼4-fold faster, likely as a result of divergent residues near the nucleotide binding site. All of the disease-associated mutations investigated increased the GTP-loaded, activated state of RIT1 in vitro, but they could be classified into two groups with different intrinsic GTPase properties. The S35T, A57G, and Y89H mutants exhibited more rapid nucleotide exchange, whereas F82V and T83P impaired GTP hydrolysis. A RAS-binding domain pulldown assay indicated that RIT1 A57G and Y89H were highly activated in HEK293T cells, whereas T83P and F82V exhibited more modest activation. All five mutations are associated with NS, whereas two (A57G and F82V) have also been identified in urinary tract cancers and myeloid malignancies. Characterization of the effects on the GTPase cycle of RIT1 disease-associated mutations should enable better understanding of their role in disease processes.
Keywords: cancer, nuclear magnetic resonance (NMR), Ras protein, small GTPase, structure-function, GTP hydrolysis, Noonan Syndrome, RIT1, nucleotide exchange
Introduction
Small GTPase proteins regulate signal transduction through a conserved “switch” mechanism (1). The GTP-bound state of these proteins adopts an activated conformation that can bind to and activate downstream effector proteins, thus driving signal transduction. Hydrolysis of GTP to GDP then terminates the signaling event (Fig. 1A). GTPase proteins have the ability to hydrolyze GTP (intrinsic hydrolysis), and to become reactivated by releasing GDP and binding a new molecule of GTP (intrinsic exchange), although both of these processes occur slowly. Most GTPases can be rapidly inactivated by GTPase-activating proteins (GAPs),6 which catalyze nucleotide hydrolysis, whereas guanine nucleotide exchange factors (GEFs) promote their reactivation by accelerating the exchange of GDP for GTP. Mutations in small GTPases or their GAPs and GEFs can disrupt this GTPase cycle and result in diseases such as cancer and developmental disorders (2, 3).
FIGURE 1.

Sequence of RIT1 and location of disease-associated mutations. A, schematic representation of the RIT1 GTPase cycle. The GTP-bound form of RIT1 interacts with and activates downstream effector proteins, whereas GDP-bound RIT1 is inactive. B, location and frequency of the cancer-associated mutations (above) and NS-associated mutations (below) identified to date in RIT1. Five disease-associated mutations investigated in this study appear in bold. C, alignment of RIT1 with RAS isoforms. The conserved G-box motifs are highlighted in purple with non-conserved residues shaded as indicated. Sites of RIT1 mutations investigated in this study and the boundaries of the RIT1 construct used in this study (17–191) are indicated. Mutation sites and non-conserved residues discussed in this study are listed in the table along with the corresponding residues in H-RAS.
Recent genetic analyses of Noonan syndrome (NS) patients have shown that mutations in RIT1 can cause this condition (Fig. 1B and Table 1) (4–11). NS is a “RASopathy” characterized by short stature, distinctive facial features, and heart defects, caused by mutations in several RAS signaling pathway genes, including PTPN11, SOS1/2, RAF1, KRAS, NRAS, or BRAF (12–14). RIT1 belongs to the RAS subfamily, sharing ∼44% sequence identity with H-, K-, and N-RAS, but is distinct in that it has a unique N-terminal extension of unknown function, and its C-terminal hypervariable region lacks prenylation and palmitoylation motifs, although reportedly, it can be recruited to the plasma membrane through a C-terminal polybasic region (15, 16). There are three splice variants of RIT1: isoform 2 contains 18 extra N-terminal residues relative to RAS; an additional exon in isoform 1 further extends the N terminus by an additional 17 amino acids; and isoform 3 initiates at a Met downstream of the G1 box and thus lacks a critical component of the nucleotide binding site (Fig. 1B). In this study, the residue numbering is based on RIT1 isoform 2, consistent with previous studies. RIT1 activates some of the same effector proteins as RAS, including RAF kinases and RAL GEFs (15), however, potential GAPs and GEFs for RIT1 remain unknown.
TABLE 1.
RIT1 cancer and NS-associated mutations identified in patients
| RIT1 residues | Cancer-associated somatic mutations (No.) | NS-associated germline mutations (No.) | Corresponding KRAS4B residues | Conserved with KRAS4B? |
|---|---|---|---|---|
| Ser-19 | Leu (2) | Met-1 | No | |
| Lys-23 | Glu (2) | Asn (1) | Lys-K5 | Yes |
| Gly-30 | Gly-12 | Yes | ||
| Gly-31 | Arg (2) | Gly-13 | Yes | |
| Gly-33 | Trp (1) | Gly-15 | Yes | |
| Lys-34 | Thr (1) | Lys-16 | Yes | |
| Ser-35 | Thr (9) | Ser-17 | Yes | |
| Thr-38 | Ala (2) | Thr-20 | Yes | |
| Gln-40 | Leu (3) | Gln-22 | Yes | |
| Arg-45 | Gln (2) | His-27 | Conservative | |
| Asp51 | Val (1) | D51Y (2) | Asp-33 | Yes |
| Ala-57 | Gal (1) | Gly (24) | Ser-39 | Conservative |
| Leu-74 | Met (1) | Leu-56 | Yes | |
| Ala-77 | Pro (3), Ser (2) | Pro (1), Ser (1), Thr (5) | Ala-59 | Yes |
| Gln-79 | Gln-61 | Yes | ||
| Glu-81 | Gln (2), Gly (1) | Gly (1), Gln (1) | Glu-63 | Yes |
| Phe-82 | Cys (4), Leu (3), Val (1), Ile (1) | Ile (1), Leu (17), Val (6), Ser(1) | Tyr-64 | Conservative |
| Thr-83 | Pro (2) | Ser-65 | Conservative | |
| Ala-84 | Val (4) | |||
| Asp-87 | Asn (1) | Asp-69 | Yes | |
| Tyr-89 | His (2) | Tyr-71 | Yes | |
| Met-90 | Ile (10) | Ile (5) | Met-72 | Yes |
| Gly-95 | Ala (29) | Gly-77 | Yes | |
| Phe-108 | Leu (2) | Phe-90 | Yes | |
| Arg-112 | Cys (2) | His-94 | Conservative | |
| Arg-122 | Leu (3),a (2), Qln (1) | Lys-104 | Conservative | |
| Gly-133 | Glu (1) | Gly-115 | Yes | |
| Arg-154 | Leu (1) | Arg-135 | Yes | |
| Arg-168 | His (2) | Arg-149 | Yes | |
| Asp-172 | Glu (1) | Asp-153 | Yes | |
| Asp-173 | Asn (1) | Asp-154 | Yes | |
| Arg-180 | Leu (1) | Arg-161 | Yes | |
| Arg-183 | His (1) | Arg-164 | Yes | |
| Ala-192 | Thr (3) | Ser-172 | Conservative | |
| Phe-211 | Leu (2) | NAb | No | |
| Asp-216 | Tyr (2) | NA | No |
a Nonsense mutation.
b NA, not applicable.
An engineered hyperactivated RIT1 mutant (Q79L, which corresponds to RAS Q61L) has been reported to transform NIH3T3 cells, suggesting that RIT1 signaling could promote oncogenesis (17, 18). Subsequently, RIT1 mutations were identified as driver mutations in ∼2% of lung adenocarcinomas (19), and more recently RIT1 mutations have been reported in a wide variety of human cancers, including myeloid malignancies, hepatocellular carcinoma, breast cancer, and others (20–23). The RIT1 disease-associated mutations reported to date (summarized in Fig. 1B and Table 1) are dispersed widely throughout the gene and affect codons distinct from the three mutational hot spots in H-, K-, and N-RAS (i.e. Gly-12, Gly-13, and Gln-61), making it difficult to predict their effects on the GTPase cycle (19, 21, 23). Several NS-associated RIT1 mutations, S35T, A57G, A77P, E81G, F82L, F82V, T83P, Y89H, M90I, and G95A, were shown to be gain-of-function mutations with respect to activation of the RAS-ERK pathway (4, 5, 9); however, the biochemical properties of these mutants and the mechanisms underlying their gain-of-function phenotype remain unknown. In this study we employed a real-time NMR-based GTPase assay, which can accurately measure intrinsic nucleotide hydrolysis and exchange activities with no chemical modification of the nucleotide (24–26). We investigated wild-type RIT1 and a series of five disease-associated mutants and compared the results with those of the well known small GTPase oncoprotein RAS.
Results and Discussion
Developing a RIT1 GTPase Assay
To monitor the GTPase cycle of RIT1 using a real-time NMR assay, 15N-labeled recombinant GTPase domain (residues 17–191) of wild-type RIT1 isoform 2 was expressed and purified. A buffer of high ionic strength and high pH (450 mm NaCl, pH 8) was required to prevent precipitation of RIT1 during concentration of the final NMR sample, so these conditions were used throughout the purification as well as the GTPase assays described below. The size exclusion chromatography elution profiles revealed that addition of 5 μm GDP to the running buffer reduced aggregation of the protein (data not shown), and RIT1-GDP eluted as a monomer under these conditions as measured by in-line multi-angle light scattering (Fig. 2A).
FIGURE 2.

Biophysical properties of wild-type RIT1 and real-time NMR-based RIT1 GTPase assay. A, size exclusion chromatography coupled to in-line multiple angle light scattering was performed on 0.32 mm RIT1 in NMR buffer containing 5 μm GDP. Wild-type RIT1 GDP (20.705 kDa) exhibited a molar mass of 20.04 kDa. B, 1H-15N HSQC spectra of RIT1 in the GDP-bound state (black) and the GMP-PNP-bound state (red). The arrows track chemical shift changes of reporter residues that differ in the two states. C, example time course of cross-peaks (I171) shifting from the GTP-bound state to the GDP-bound state as hydrolysis proceeds.
High quality 1H/15N HSQC spectra of RIT1 (0.8 mm) were obtained for both the GMP-PNP-bound state and the GDP-bound state under the optimized buffer conditions (Fig. 2B). Standard triple-resonance backbone experiments were used to assign 125 cross-peaks for the GDP-bound form (∼70% of the peaks, deposited in the Biological Magnetic Resonance Bank under BMRB Entry 26787), and 12 residues with high-intensity peaks that exhibit chemical shift changes upon nucleotide cycling were chosen as “reporter residues” for the readout of the GTPase assay.
Comparison of the GTPase Cycles of RIT1 and HRAS
First, we compared the intrinsic nucleotide exchange and GTP hydrolysis rates of RIT1 to those of H-RAS, under the same high ionic strength buffer conditions (Fig. 3, A and B). When assays were conducted at pH 8 with 450 mm NaCl, H-RAS nucleotide exchange was accelerated 5-fold and hydrolysis was decreased 2-fold, relative to rates that we previously determined at pH 7.5 with 100 mm NaCl (25), possibly due to destabilization of ionic interactions between the nucleotides and the GTPase domain (Table 2). To initiate nucleotide exchange, a 10-fold molar excess of the non-hydrolysable GTP analog GTPγS was added to GDP-loaded GTPase samples, and HSQC spectra were collected in succession to monitor the reaction. Compared with H-RAS, RIT1 exhibited ∼4-fold faster nucleotide exchange (Fig. 3A and Table 2). To measure intrinsic nucleotide hydrolysis, the samples were loaded with GTP before collection of successive HSQC spectra (Fig. 2C). RIT1 exhibited a 2.2-fold faster hydrolysis rate relative to H-RAS (Fig. 3B).
FIGURE 3.

Comparison of wild-type RIT1 intrinsic nucleotide hydrolysis and exchange rates with RIT1 mutants and H-RAS. A, intrinsic nucleotide exchange and B, intrinsic GTP hydrolysis of the GTPase domains of RIT1 (residues 17–191) and H-RAS (1–171) performed under identical conditions (450 mm NaCl) using real-time NMR. C, nucleotide exchange curves of wild-type versus a series of mutations of RIT1. GDP-bound samples were monitored by real-time NMR following addition of a 10-fold excess of GTPγS. D, summary of the exchange rates of wild-type versus mutant RIT1 derived from the curves in panel C. E, GTP hydrolysis curves of wild-type (WT) versus mutant RIT1 GTPase domain (residues 17–191) monitored by real-time NMR. F, summary of nucleotide hydrolysis rates of wild-type versus mutant RIT1 derived from the curves in panel E. Rates are presented as mean ± S.D. of duplicate (n = 2) experiments in bar graphs.
TABLE 2.
NMR-derived hydrolysis and exchange rates for all experiments in this study
S.D. were derived from at least two repeats of the same experiment.
| Figure | Small GTPase | NaCl | pH | Exchange mean ± S.D. | Exchange fold-change | Hydrolysis mean ± S.D. | Hydrolysis fold-change | kE/kH ratio | kE/kH fold-change | kE/(kH + kE) |
|---|---|---|---|---|---|---|---|---|---|---|
| mm | min−1 | min−1 | ||||||||
| Fig. 3 | RIT1 WT | 450 | 8.0 | 7.8 ± 0.7E-2 | 1 | 8.8 ± 1.3E-3 | 1 | 9.0 ± 1.6 | 1 | 90.0% |
| RIT1 Q79L | 450 | 8.0 | 2.1 ± 0.1E-1 | 2.7X above WT | 5.10E-04 | 17.2X below WT | 4.1 ± 0.2E2 | 45.8X above WT | 99.8% | |
| RIT1 S35T | 450 | 8.0 | 3.0 ± 0.2E-1 | 3.8X above WT | 3.6 ± 0.4E-3 | 2.4X below WT | 8.3 ± 1.0E1 | 9.3X above WT | 98.8% | |
| RIT1 A57G | 450 | 8.0 | 4.7 ± 1E-1 | 6X above WT | 5.4 ± 1.0E-3 | 1.6X below WT | 8.7 ± 2.5E1 | 9.7X above WT | 98.9% | |
| RIT1 F82V | 450 | 8.0 | 7.6 ± 0.4E-2 | ∼1 | 3.0 ± 0.7E-3 | 2.9X below WT | 2.5 ± 0.6E1 | 2.8X above WT | 96.2% | |
| RIT1 T83P | 450 | 8.0 | 1.5 ± 0.3E-1 | 2.0X above WT | 2.9 ± 0.1E-3 | 3.0X below WT | 5.4 ± 1.1E1 | 6.0X above WT | 98.2% | |
| RIT1 Y89H | 450 | 8.0 | 3.2 ± 0.5E-1 | 4.1X above WT | 5.7 ± 0.2E-3 | 1.5X below WT | 5.7 ± 0.9E1 | 6.3X above WT | 98.3% | |
| H-RAS WT | 450 | 8.0 | 2.0 ± 0.2E-2 | 3.9X below RIT1 | 4.0 ± 0.6E-3 | 2.2X below RIT1 | 5.0 ± 0.9 | 1.8X below RIT1 | 83.4% | |
| Fig. 4 | H-RAS WT (1) | 100 | 7.5 | 3.8 ± 0.4E-3 | 1 | 8.8 ± 0.7E-3 | 1 | 4.3 ± 0.6E-1 | 1 | 30.2% |
| H-RAS G12Va | 100 | 7.5 | 2.0 ± 0.6E-3 | 1.8X below WT | 8.90E-04 | 10X below WT | 2.2 ± 0.7 | 5.2X above WT | 69.2% | |
| H-RAS G13Da | 100 | 7.5 | 56.7 ± 0.7E-3 | 15X above WT | 3.1 ± 0.0E-3 | 2.8X below WT | 1.8 ± 0.2E1 | 42X above WT | 94.8% | |
| H-RAS Q61La | 100 | 7.5 | 9.0 ± 0.9E-3 | 2.4X above WT | 1.10E-04 | 80X below WT | 8.2 ± 0.8E1 | 190X above WT | 98.8% |
a See Ref. 25.
The Effect of Disease-associated Mutations on RIT1 GTPase Cycle
Next, we investigated how engineered and disease-associated mutations affect the GTPase cycle of RIT1. We chose to study six mutations that have been associated with NS (S35T, A57G, F82V, T83P, Y89H, and G95A) and an engineered mutation, Q79L. Two of these mutations (A57G and F82V) have also been found in human cancers. Three of these mutations, S35T, A57G, and Y89H, increased the intrinsic nucleotide exchange rate by ∼4-fold, the Q79L and T83P mutations doubled the exchange rate, and F82V had no appreciable effect (Fig. 3, C and D). We then examined the effects of these mutations on GTP hydrolysis, beginning with RIT1 Q79L, an engineered mutation of the putative catalytic residue corresponding to RAS Gln-61 (27). As expected, the Q79L mutation strongly impaired GTPase activity, reducing the hydrolysis rate by 17-fold. Of the disease-associated mutations, F82V and T83P had the largest effect on GTP hydrolysis, reducing the rate by ∼3-fold, followed by S35T (2.4-fold decrease). The A57G and Y89H mutations each caused a modest (1.5-fold) reduction in hydrolysis rate (Fig. 3, E and F).
The RIT1 disease-associated mutants investigated in this study exhibited either a faster nucleotide exchange rate, a slower hydrolysis rate, or both (Fig. 4A), strongly suggesting that they would exist in a more highly activated state in vivo. We propose that these mutants can be classified into two groups according to their biochemical properties: fast-exchangers versus slow-hydrolyzers. The fast-exchanger group includes S35T, A57G, and Y89H, whereas the slow-hydrolyzer group includes F82V and T83P, as well as the engineered mutant Q79L.
FIGURE 4.

Effects of RIT1 and H-RAS mutations on the GTPase cycle and GTP loading. A, effect of mutations on exchange (y axis) and hydrolysis (x axis) expressed as fold-change. B, fraction of wild-type and mutant RIT1 loaded with GTP at steady state calculated as a function of the exchange and hydrolysis rates (GTPase domain in vitro at 298 K, pH 8.0, in 450 mm NaCl). C, changes in nucleotide exchange and GTP hydrolysis induced by H-RAS mutations in vitro at 298 K (pH 7.5) in 100 mm NaCl. D, fraction of wild-type versus mutant H-RAS bound to GTP calculated as a function of the exchange and hydrolysis rates in vitro at 298 K (pH 7.5) in 100 mm NaCl.
The ratio of the exchange to hydrolysis rates (kE/kH) for RIT1 is 2-fold higher than that of H-RAS under matched high salt conditions, implying a higher basal activation level. Here we propose a formula (see “Experimental Procedures”) to predict the fraction of H-RAS, RIT1, and their mutants in the activated state, on the basis of their intrinsic exchange and hydrolysis rates (Fig. 4B). The predicted basal activation level of H-RAS was 30% at 100 mm NaCl; however, the effects of high salt (450 mm NaCl) on kE and kH increased this value to 84% (Table 2). In the same high salt buffer, 90% of wild-type RIT1 was predicted to be in the activated state, primarily because it exhibits faster exchange (Fig. 4B). However, the basal activation level of RIT1 would probably be lower under physiological salt concentrations, which we were unable to investigate due protein precipitation (extrapolating the effect of salt on H-RAS suggests ∼44% basal activation level of RIT1).
The activation of RIT1 was further increased by mutation. The engineered mutant Q79L was the most highly activated mutant, with nearly complete GTP loading due to its impaired ability to hydrolyze GTP. Of the disease-associated mutants, the fast-exchangers were predicted to exhibit higher overall levels of activation than the slow-hydrolyzers. Mutations that perturb both exchange and hydrolysis (S35T and T83P) lead to particularly high levels of activation (Fig. 4, A and B). Using data from our previously published characterization of the intrinsic exchange and hydrolysis rates of H-RAS, we used the same formula to predict the fraction of activated H-RAS oncogenic mutants (25). The H-RAS mutants G12V and Q61L are slow-hydrolyzers, whereas G13D is a fast-exchanger. The impact of these H-RAS mutations on the intrinsic hydrolysis and exchange rates (Fig. 4, C and D) increases the basal activation state from 30 to 70–99% at 100 mm NaCl. The G13D substitution introduces a negative charge in the phosphate-binding site that renders binding of nucleotide less favorable (28). Affinity for nucleotide can also be reduced through an engineered H-RAS mutation (F28L) that disrupts a hydrophobic interaction with the base (29). This approach has been extended to produce analogous fast-exchange mutants of RhoA, Rac1, and Cdc42, which better mimic deregulated oncogenic RHO-GEF activity than mutants with impaired GTP hydrolysis (30). Thus, mutations that decrease nucleotide affinity can increase nucleotide exchange and the activation of small GTPases. It is interesting that three NS-associated mutations in RIT1 (S35T, A57G, and Y89H) behave like G13D and F28L in H-RAS, whereas the other two RIT1 NS mutations studied (F82V and T83P) are akin to G12V and Q61L in H-RAS. Furthermore, characterization of RASopathy-associated germ-line K-RAS mutations revealed subsets with fast intrinsic nucleotide exchange or slow hydrolysis (31). Thus, the proposed formula uncovered unexpected similarities between RIT1 and RAS mutants.
Effects of Disease-associated Mutations on Basal Activation of RIT1 in Cells
It is important to note that the activation state of RIT1 in vivo is likely to be substantially modulated by GAPs and/or GEFs, and the effect of RIT1 mutations on sensitivity to GAP/GEF activities. Currently, no such regulators have been identified, and this question awaits further investigation. Nevertheless, the overall activation state of a GTPase protein can be estimated by the fraction that can be pulled down through a GTP-dependent interaction with the GTPase-binding domain of an effector protein. We therefore sought to use a RAS-binding domain (RBD) pulldown assay to compare the basal activation level of RIT1 and its mutants in cells. Among several characterized RIT1 effectors, we chose BRAF as it had been shown to be essential for RIT1-mediated activation of ERK, a key signaling event in NS (32). Using NMR, we confirmed that recombinant RIT1 binds directly to recombinant BRAF-RBD in a GTP-dependent manner (data not shown), thus we used BRAF RBD for RIT1 pulldown assays.
Surprisingly, the engineered mutation of the catalytic residue (Q79L) did not significantly affect the amount of RIT1 pulled down by the RBD (Fig. 5), although a similar result was reported previously by Shi and Andres (32). Among five disease-associated RIT1 mutants tested, three of them (A57G, T83P, and Y89H) were pulled down ≥2-fold more than wild-type by BRAF-RBD (Fig. 5). The F82V mutant exhibited modest activation, whereas S35T was not pulled down to a greater extent than wild-type RIT1 (Fig. 5). Thus the predicted GTP loading of RIT1 mutants based on their intrinsic hydrolysis (Fig. 4) and exchange rates is not strongly correlated with the RIT1 activation state in cells inferred from the results of the BRAF-RBD pulldown assay, suggesting that mutational effects occur on multiple levels in cells. For example, some mutations may alter the sensitivity of RIT1 to the actions of GAPs or GEFs in cells, which were not present in the GTPase assay. Furthermore, different mutations may differentially impact the affinity of RIT1 for the BRAF RBD probe used to assess activation in the cell, akin to the previously reported effects of the H-RAS G12V mutation on ARAF and RGL1 RBD binding (33). It is important to note that the binding affinity for RAF-RBD is reduced by most of the germ-line and cancer-associated K-RAS mutations that have been studied, including those that are distal from the RBD-binding site (28, 31). The activation state of such mutants would be underestimated in RBD pulldown assays. The effect of Q79L mutation is somewhat puzzling, because there is evidence that this RIT1 mutation enhances phosphorylation of RAF and ERK (4, 19, 32) in the absence of any substantial increase in binding to BRAF (32), suggesting that additional regulatory mechanisms may contribute to RIT1-induced ERK activation.
FIGURE 5.
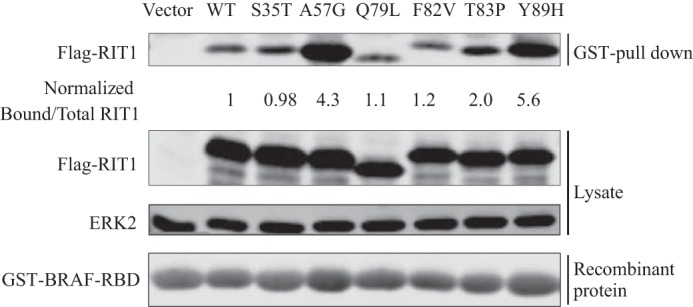
Effects of disease-associated mutations on the activation of RIT1 in cells. HEK293T cells were transfected with empty vector, wild-type FLAG-RIT1, or FLAG-RIT1 bearing engineered or disease-associated mutations. Activated RIT1 competent for effector binding (i.e. RIT1-GTP) was pulled down by immobilized GST-BRAF-RBD, and detected in a Western blot using anti-FLAG (upper panel). The expression of FLAG-RIT1 in the lysate and loading of recombinant GST-RBD were examined by Western blot using anti-FLAG and anti-GST (lower panel). Endogenous ERK2 was probed to serve as a loading control. Normalized ratios of the band intensities of RIT1 pulled down by the RBD to the total RIT1 in the lysate are indicated for each RIT1 construct. The results are representative of experiments performed in duplicate.
Structural Considerations of RIT1 Disease-associated Mutations
To deepen our understanding of the mechanistic rationale for the GTPase cycle defects of the RIT1 mutants, we modeled them using the structure of RIT1-GDP (PDB code 4KLZ) recently solved by Siegal and co-workers,7 and gained insight into these mutations from the extensive literature available on characterization of RAS mutations.
In RAS, the G13D mutation accelerates nucleotide exchange by destabilizing nucleotide binding. A recent crystal structure of K-RAS G13D revealed that the negative charge of the Asp substitution in proximity to the nucleotide phosphates creates unfavorable electrostatic interactions (28). The fast-exchanger RIT1 mutants each appear to destabilize nucleotide binding through different mechanisms. The side chain hydroxyl of RIT1 Ser-35 is highly conserved in RAS GTPases, and is involved in coordinating the Mg2+ ion that is required for high affinity nucleotide binding. The S35T mutation appears to destabilize nucleotide binding, either by affecting the rotameric dynamics of the hydroxyl group or by introducing steric hindrance in the Mg2+ binding site (Fig. 6, A–D). A decrease in nucleotide affinity would accelerate nucleotide exchange, consistent with the gain-of-function phenotype of S35T reported for ELK transactivation (4). It is possible that the S35T mutant may be highly activated in the GTP-rich cellular environment, but due to its reduced affinity the nucleotide may be lost during washing in the RBD pulldown assay, thus hindering the interaction. Interestingly, threonine is found in this position in many GTPases (ARF, RHO, and RAB subfamilies), but introduction of a more divergent side chain at the residue corresponding to Ser-35 in RAS (i.e. RAS S17N) sterically displaces Mg2+, severely destabilizing GTP binding (34). The S17N mutation generates a frequently used dominant-negative RAS mutant that blocks the activation of wild-type RAS by sequestering and inhibiting RAS GEFs (35). It was previously demonstrated that an engineered RIT1 S35N mutation disrupted interactions with putative RIT1 effectors (27), but it is not clear whether this mutant has dominant-negative properties; whereas its overexpression reduced ELK transactivation (4), its expression at near physiological levels did not reduce ERK phosphorylation (5).
FIGURE 6.

Structural analysis of the impact of the RIT1 S35T, A57G, and Y89H mutations on nucleotide binding with comparison to K-RAS G13D and H-RAS S17N. A, structure of wild-type RIT1-GDP (PDB code 4KLZ) indicating the position of the Ser-35 side chain, which is involved in the coordination of the Mg2+ ion. B, an S35T mutation was introduced into the wild-type RIT1-GDP structure, and the lowest-energy rotamer of the Thr-35 side chain was selected. The S35T mutation may destabilize the binding of Mg2+, consistent with its accelerated nucleotide exchange. C, mutation of the corresponding H-RAS residue to Asn (S17N) displaces Mg2+ (PDB code 3LO5). D, by contrast, the K-RAS G13D mutation destabilizes nucleotide binding electrostatically through the introduction of a negatively charged side chain (PDB code 4TQA). E and F, A57G and Y89H mutations were introduced into the wild-type RIT1-GDP and the lowest-energy rotamer of Y89H was selected. RIT1 A57G and Y89H mutations may disrupt the stability of Switch I and Switch II, respectively.
The A57G and Y89H mutations, which cause fast-exchange, are found in/near switch I and switch II, respectively (corresponding to RAS Ser-39 and Tyr-71, Fig. 1C), and the structure of wild-type RIT1-GDP suggests that these disease-associated mutations might perturb Van der Waals interactions between these hydrophobic side chains and Leu-74 (Fig. 6, E and F). Disruption of these interactions could destabilize Switch I or Switch II, respectively, thereby disrupting nucleotide binding and promoting nucleotide exchange (Fig. 6, E and F). The A57G and Y89H mutations were highly activated in the RBD pulldown, and have been shown to enhance activation of ERK (5, 8) and ELK (4, 9).
The RIT1 G95A protein exhibited severely reduced stability in vitro, and although some protein was present in the soluble fraction of Escherichia coli lysate, it precipitated during purification. Interestingly, of four NS-associated mutants expressed in Flp-In T-Rex 293 cells by Chen et al. (5), only G95A exhibited reduced expression and did not enhance EGF-induced ERK activation, whereas the other NS mutations (and Q79L) expressed more highly than wild-type and increased ERK activation. By contrast, transient overexpression of RIT1 G95A enhanced ELK transactivation and induced more developmental defects in zebrafish embryos than wild-type (4), suggesting that the intrinsic instability of this mutant protein might be overcome by higher expression levels in zebrafish. The instability of this mutant might be explained by impaired nucleotide binding, akin to other nucleotide-free GTPases such as the RAS homolog enriched in brain (RHEB) mutant D60K, which fails to bind GDP and GTP (36) and exhibited markedly reduced stability and solubility in E. coli expression. RIT1 Gly-95 is located in a glycine-rich hinge region connecting Switch II to β4. The corresponding glycine residues in RAS (Gly-77), together with Gly-75, is thought to confer flexibility on Switch II (37); thus the G95A mutation might impair nucleotide binding by restricting the conformation of Switch II. Notably G95A is the most frequent RIT1 mutation associated with NS and thus is very likely causative, although the underlying mechanism remains unclear. To date, this mutation has not been reported in cancer.
In RAS, Gln-61 is a key catalytic residue for hydrolysis of GTP. The RAS Gln-61 side chain forms an H-bond with a nucleophilic water molecule, which becomes activated to attack the γ-phosphate. The Q61L mutation displaces the bridging water and significantly decreases GTP hydrolysis (38, 39). The loss of RIT1 GTPase activity caused by the engineered mutation of the corresponding residue (Gln-79) suggests conservation of this type of mechanism, although a structure of RIT1 in the GTP-bound form is needed to reveal the details. The two RIT1 mutations that produce slow GTP hydrolyzers, F82V and T83P, are both in close proximity to Gln-79, suggesting that their impact on nucleotide hydrolysis might stem from perturbation of the precise positioning of Gln-79. These two mutations could be analogous to RAS G12V, which impairs GTP hydrolysis by interfering with the positioning of Gln-61 and the bridging water (38). Mutations of RIT1 Phe-82 to Val or Leu and T83P have been shown to increase phosphorylation of ERK (5), and activation of ELK (4, 9). In addition to fast nucleotide exchange, the S35T mutant also exhibited reduced GTPase activity, which is likely related to perturbation of the Mg2+ ion.
Comparison of the Mutational Profiles of RIT1 and RAS
It is interesting to note that among the disease-associated RIT1 mutations reported to date, there is only a single example (10) involving a codon that corresponds to the three RAS hotspots (i.e. RIT1 Gly-30, Gly-31, and Gln-79). Mutation of codon 79 (CAG) of the cDNA impaired GTP hydrolysis by altering the catalytic Gln residue; however, in the RIT1 gene this codon forms the splice site at the 3′ end of exon 4, as noted previously (19). Mutations that affect the second or third position of this codon would alter the consensus AG splice site motif, likely disrupting mRNA splicing and yielding a non-functional polypeptide. Likewise, mutation of the first position could lead to premature termination (TAG), or a very rare splice site (GAG) (40) encoding a Q79E mutation, which by analogy to H-RAS Q61E might accelerate intrinsic nucleotide hydrolysis (41). Of the nine possible point mutations of codon 79, only one (i.e. AAG) would be predicted to produce an activated RIT1 protein (Q79K); however, AAG is also rarely found at splice sites. The engineered RIT1 mutation G30V was shown to be less effective than Q79L or NS-associated mutations at inducing ELK transactivation (4). As this manuscript was in revision, a RIT1 G31R mutation (corresponding to RAS Gly-13) was identified in a patient with Noonan syndrome (10), however, its biochemical and functional properties remain to be characterized. It is not clear why RIT1 Gly-30 and Gly-31 are infrequently mutated relative to RAS, and whether local DNA sequence or structure of the RIT1 gene might render these codons less susceptible to mutation than RAS Gly-12/Gly-13.
Compared with the oncogenic hot spots in RAS isoforms, cancer-associated mutations of RIT1 are much more dispersed throughout the sequence (Fig. 1B and Table 1), resembling the spectrum of RASopathy-associated germ-line RAS mutations (19, 21, 23). Four of the cancer-associated RIT1 mutations affect residues (K23E, Q40L, D172E, and M90I) corresponding to germ-line and low-frequency somatic K-RAS mutation sites (K5N, Q22E, Q22R, D153V, and M72L) (21, 42). There are several examples of the same RIT1 mutation occurring in both NS and cancer (e.g. A57G, A77P, E81G, F82L, F82V, M90I), suggesting that mutations associated with the two diseases do not lead to distinct biochemical properties. The most frequently mutated RIT1 site is Phe-82, where mutations to Cys, Leu, Ile, and Val have been identified in multiple cancer types, whereas Leu and Val substitutions have been found in NS patients. Mutation of the corresponding site in H-RAS (Tyr-64) or RAP1A (Phe-64) impairs both intrinsic and GAP-mediated GTP hydrolysis (43).
The high level of RIT1 activation that results from its intrinsic hydrolysis and exchange rates underscores the importance of identifying potential GAP proteins that inactivate RIT1 in the cell, although none have been identified to date. Resistance to the catalytic activity of GAPs is the major mechanism by which oncogenic RAS mutants maintain high activation levels in cells (39, 44), whereas germ-line RASopathy-associated RAS mutations are highly variable in their impact on GAP sensitivity, ranging from undetectable to profound impairment (31, 45). Differential sensitivity to GAP activity might underlie some of the discordance between in vitro activation of RIT1 mutants and the RBD pulldown assays from cell lysates, although this remains to be investigated if a GAP is identified. RIT1 mutants that are resistant to GAP activity would be dependent on their intrinsic GTPase activity for inactivation.
Some cancer-associated RIT1 mutations (M90I and A77S) have been validated as oncogenic drivers (19), but most remain to be investigated. The cancer-associated mutations are biased toward highly conserved residues, suggesting that many are likely to perturb RIT1 function (Table 1).
Functional Implications of Divergent RIT1 Residues
An alignment of the sequences of RIT1 and three RAS isoforms reveals some key amino acid substitutions in the switch regions and the conserved nucleotide-binding G-box motifs (Fig. 1C), which could be responsible for the faster intrinsic exchange observed with RIT1. Compared with RAS, RIT1 has substitutions of residues within or immediately adjacent to all five G-box motifs. Most of these substitutions occur in sites that are fully conserved between H-, K-, and N-RAS, but exhibit some divergence across the RAS superfamily, consistent with our finding that RIT1 nucleotide binding is modestly destabilized, but not completely disrupted. Interestingly, at many of these sites (e.g. RIT1 codons His-50, Ala-57, Ala-80, Phe-82, Ser-136, and Ala-166), the RIT1 side chains are less bulky than those of RAS, potentially reducing the surface area in contact with the nucleotide.
Previous mutagenesis studies of some of these sites in H-RAS shed light on how some of the divergent residues might contribute to the biochemical properties of RIT1. Mutation of H-RAS Ser-39 or Lys-147 have been shown to destabilize nucleotide binding (46–48), and both of these positions bear alanine substitutions in RIT1 (Ala-57 and Ala-166, respectively). H-RAS Lys-147 lies within the G5 box and interacts with Phe-28 and Asp-119 through Van der Waals and polar interactions, stabilizing their side chains in conformations that can form ring stacking and ionic interactions, respectively, with the nucleotide base (Fig. 7A). H-RAS Ser-39 is adjacent to the G2 box in switch I, where it forms interactions with Asp-54 and Leu-56 that restrain the switch in a conformation whereby key G2 residues interact with the nucleotide phosphate groups (Fig. 7D). Substitution of these lysine or serine residues with alanine in RIT1 destabilizes these interactions, indirectly distorting the nucleotide binding site (Fig. 7, B and C).
FIGURE 7.

Structural analysis of divergent residues of RIT1 relative to RAS. The crystal structure of RIT1-GDP is shown (PDB code 4KLZ). Substitutions in the G2 and G5 motifs of RIT1 may destabilize nucleotide binding, resulting in faster nucleotide exchange. Panels A and B, RAS Lys-147 is involved in a stabilizing network of side chain interactions (A), which is disrupted by substitution with Ala (A166) in RIT1 (B). Panels C and D, RAS Ser-39 (G2) stabilizes a conformation of switch I that makes favorable interactions with the nucleotide (C), however, this network is disrupted by substitution with Ala (A57) in RIT1 (D).
H-RAS mutagenesis experiments suggest that the RIT1 substitutions in the G3 and G4 boxes (i.e. E62A and C118S, respectively) are unlikely to contribute to faster nucleotide exchange, but provide insight into other functional properties of RIT1. In H-RAS, neither the E62A nor the C118S mutation (analogous to RIT1 Ala-80 and Ser-136) directly impacts intrinsic nucleotide exchange. However, RAS E62A abolishes SOS-mediated nucleotide exchange, and this was identified as a highly conserved residue that is required for the GEF-mediated activation of most small GTPases (49, 50). Substitution of the corresponding residue of RIT1 with Ala, together with the rapid intrinsic nucleotide exchange rate, suggest that RIT1 might not be regulated by a GEF in the cell, or that any potential GEF may function through a non-canonical mechanism. Interestingly, SOS and EPAC (RAS- and RAP-GEFs, respectively) are required for RIT1 activation in cells, however, they fail to activate RIT1 in vitro (51, 52). RAS can be regulated through modification of Cys-118 by nitric oxide, which destabilizes nucleotide binding and promotes activation by accelerating nucleotide exchange (50). Notably, the oncogenicity of K-RAS is reduced by a C118S mutation (53, 54). Hence, the presence of serine at the corresponding position in RIT1 (Ser-136) argues that RIT1 would not be regulated by nitric oxide.
Classification of RIT1 GTPase mutants according to their hydrolysis and exchange properties could be of clinical significance for treatment of RIT1-mutant cancers. It was recently appreciated that specific K-RAS mutations are associated with different responses to targeted therapies. Colon cancer patients with K-RAS G13D, but not Gly-12 mutations benefit from the EGFR inhibitor Cetuximab (55–57), whereas non-small-cell lung cancers with G12C or G12V mutations responded better to a MEK inhibitor than those with other K-RAS mutations (58). The G13D mutation is associated with increased EGF receptor expression and p53 phosphorylation, which are strikingly different compared with codon 12 and 61 mutations (59). The number of patients identified with RIT1 mutant tumors to date is small, and specific targeted therapies for these patients have not been identified. Nevertheless, stratification of patients with specific mutations (or the two classes of mutations defined here) could be important for future analyses of the impact of RIT1 mutation status on clinical outcomes.
Experimental Procedures
Protein Preparation
Human H-RAS (residues 1–171) and RIT1 isoform 2 (residues 17–191) were expressed as His-tagged proteins in E. coli (BL21) from the pET28a vector described previously (60). RIT1 mutations (S35T, A57G, Q79L, F82V, T83P, Y89H, and G95A) were introduced using QuikChange site-directed mutagenesis (Stratagene). Bacteria were grown in minimal M9 media, supplemented with 15NH4Cl (and [13C]glucose to prepare samples for resonance assignment), and protein expression was induced with 0.25 mm isopropyl 1-thio-β-d-galactopyranoside at 15 °C overnight. Proteins were purified using nickel-nitrilotriacetic acid resin, and His tags were removed by thrombin. The thrombin-cleaved proteins were further purified through Superdex-75 size exclusion chromatography (GE Healthcare). Following purification from E. coli, H-RAS and RIT1 are in the GDP-bound form. Depending on the particular experiment, purified proteins were preloaded with GMP-PNP, GTPγS, or GTP (Sigma) in the presence of EDTA, which was removed along with the excess nucleotide using a G25 resin PD10 desalting column (GE Healthcare). A construct encoding residues 150–233 of the RBD of BRAF was cloned into pGEX-4T2 to express a GST-BRAF-RBD fusion protein, which was purified as previously described (33).
NMR Spectroscopy
Protein samples were prepared in a sample buffer containing 20 mm HEPES (pH 8), 450 mm NaCl, 5 mm MgCl2, 2 mm tris(2-carboxyethyl)phosphine hydrochloride, and 5 μm GDP. The final protein concentrations used in the real-time NMR assay and backbone chemical shift assignment experiments were 0.4 and 0.8 mm, respectively. For GTP hydrolysis assays, proteins were loaded with GTP by adding a 10-fold molar excess in the presence of EDTA, and excess reagents were removed by passage through a desalting column (PD MidiTrap G-25, GE Healthcare). For nucleotide exchange assays, we found it necessary to add 1 molar eq (0.4 mm) of GDP to the sample to stabilize some of the RIT1 mutants (e.g. RIT1 A57G precipitated within 15 min at room temperature in the absence of additional nucleotide); therefore, all samples were treated in this manner. Nucleotide exchange was initiated by adding a 10-fold molar excess of GTPγS to mimic physiological conditions. RIT1 G95A precipitated at 4 °C even in the presence of excess GDP, and could not be purified, suggesting that its nucleotide binding may be severely impaired.
All NMR data were acquired at 25 °C on an 800 MHz Bruker AVANCE II spectrometer equipped with a 5-mm TCI CryoProbe or a 600 MHz Bruker AVANCE III spectrometer with a TXI 1.7-mm CryoProbe. Triple resonance HNCACB, CBCACONH, HNCO, and HNCACO spectra, as well as 1H-15N HSQC spectra, were collected for the backbone chemical shift assignments. To monitor the GTPase reaction, 1H-15N HSQC spectra were collected in succession with 2 scans (5 min) for nucleotide exchange assays and 8 scans (20 min) for GTP hydrolysis assays. The spectra were processed with NMRPipe (61), and analyzed with SPARKY (62). Pairs of peaks that exhibited distinct chemical shifts in each nucleotide-bound state and were well resolved from other peaks were selected as reporters of reactions rates. The fraction of RIT1 in the GDP-bound state was calculated from IGDP/(IGDP + IGTP), where I is the peak intensity of reporters, plotted against time, and fit to a one-phase exponential decay curve using Prism (GraphPad software). The error was estimated as described previously (24).
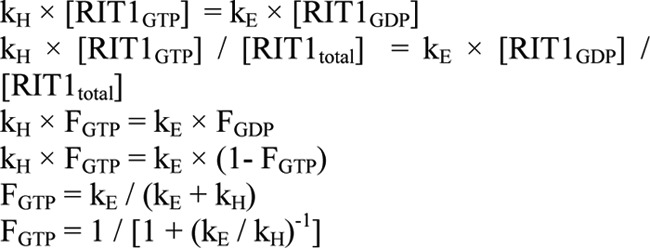
Formula Used for Calculating Level of Intrinsic Activation of GTPase Proteins
We developed a formula to predict the fraction of RIT1 bound to GTP at steady state when GTP hydrolysis and nucleotide exchange occur concurrently in the presence of a constant 10:1 ratio of GTP to GDP, which is consistent with the cellular GTP to GDP ratio. At steady state, the rate of GTP hydrolysis is equal to the rate of nucleotide exchange. As hydrolysis and exchange are first order reactions, the rates of which depend on the concentration of reactants, this leads to Equation 1 (kE, exchange rate constant; kH, hydrolysis rate constant; FGTP, fraction of GTP-bound RIT1 in total RIT1; FGDP, fraction of GDP-bound RIT1 in total RIT1). This equation demonstrates that intrinsic GTP loading of small GTPases is a function of the ratio of the exchange and hydrolysis rates (kE/kH) in this isolated system. For this reason, the intrinsic activation level of a small GTPase can be estimated on the basis of these rate constants. This level of intrinsic activation does not consider the activities of GEF-mediated activation or GAP activity. To date, no RIT1 GAPs or GEFs have been reported.
EQUATION 1.
Cell Lines, Transfections, and Assays of Cellular RIT1 Activation
HEK293T cells maintained in DMEM plus 10% FBS and antibiotics were transiently transfected using jetPRIME transfection reagent (Polyplus Transfection, Illkirch, France) according to the manufacturer's protocol 1 day after seeding. 24 h after transfection, cells were starved in serum-free DMEM overnight before harvesting. The GST-BRAF-RAS binding domain (RBD) pulldown assay was performed as described previously (63). Lysates containing 600 μg of total protein were incubated with 10 μg of GST-BRAF-RBD mixed with 10 μl of 50% slurry of glutathione resin (GeneScript) in a total volume of 600 μl for 45 min at 4 °C. The resin was collected and washed three times before bound proteins were released by boiling the resin in Laemmli sample buffer for 5 min. Samples were then resolved by SDS-PAGE, transferred to polyvinylidene difluoride membrane, and analyzed by immunoblotting to probe for FLAG-tagged RIT1 (anti-FLAG, clone M2, Sigma) in the pulldown and whole cell lysate, as well as ERK2 (anti-ERK1/2, Millipore) in the whole cell lysate, and GST-RBD (anti-GST, Novagen) in the pulldown to ensure equal loading. IRDye infrared secondary antibodies were used for visualization in the Odyssey Infrared imaging system (Li-Cor Biosciences), followed by quantification using Odyssey version 3.0 software. Ratios of each FLAG-RIT1 mutant band in the pulldown relative to whole cell lysate were calculated and normalized to that of wild-type RIT1.
Author Contributions
Z. F., C. B. M., and M. I. conceived the project and designed the experiments. Z. F. conducted most of the experiments and J. C. Y. performed Western blot analysis. J. C. Y., Y. X., and B. G. N. contributed new reagents/analytic tools. Z. F., C. B. M., M. T. M.-J., G. M. C. G.-S., M. J. S., T. N., B. G. N., and M. I. analyzed the results. Z. F., C. B. M., and M. I. wrote the paper.
Acknowledgment
NMR spectrometers were funded by the Canada Foundation for Innovation.
This work was supported by Cancer Research Society (Canada) Grant 14014, Canadian Cancer Society Research Institute Grant 703209, and the Princess Margaret Cancer Foundation. The authors declare that they have no conflicts of interest with the contents of this article.
D. M. Shah, M. Kobayashi, P. H. Keizers, A. W. Tuin, E. Ab, L. Manning, A. A. Rzepiela, M. Andrews, F. J. Hoedemaeker, and G. Siegal, unpublished data.
- GAP
- GTPase-activating proteins
- RIT1
- RAS-like protein expressed in many tissues
- GEF
- guanine nucleotide exchange factors
- RBD
- RAS-binding domain
- HSQC
- heteronuclear single-quantum coherence
- NS
- Noonan syndrome
- GTPγS
- guanosine 5′-3-O-(thio)triphosphate
- GMP-PNP
- guanosine 5′-[β,γ-imido]triphosphate.
References
- 1. Cherfils J., and Zeghouf M. (2013) Regulation of small GTPases by GEFs, GAPs, and GDIs. Physiol. Rev. 93, 269–309 [DOI] [PubMed] [Google Scholar]
- 2. Bos J. L. (1989) ras oncogenes in human cancer: a review. Cancer Res. 49, 4682–4689 [PubMed] [Google Scholar]
- 3. Rauen K. A. (2013) The RASopathies. Annu. Rev. Genomics Hum. Genet. 14, 355–369 [DOI] [PMC free article] [PubMed] [Google Scholar]
- 4. Aoki Y., Niihori T., Banjo T., Okamoto N., Mizuno S., Kurosawa K., Ogata T., Takada F., Yano M., Ando T., Hoshika T., Barnett C., Ohashi H., Kawame H., Hasegawa T., et al. (2013) Gain-of-function mutations in RIT1 cause Noonan syndrome, a RAS/MAPK pathway syndrome. Am. J. Hum. Genet. 93, 173–180 [DOI] [PMC free article] [PubMed] [Google Scholar]
- 5. Chen P. C., Yin J., Yu H. W., Yuan T., Fernandez M., Yung C. K., Trinh Q. M., Peltekova V. D., Reid J. G., Tworog-Dube E., Morgan M. B., Muzny D. M., Stein L., McPherson J. D., Roberts A. E., et al. (2014) Next-generation sequencing identifies rare variants associated with Noonan syndrome. Proc. Natl. Acad. Sci. U.S.A. 111, 11473–11478 [DOI] [PMC free article] [PubMed] [Google Scholar]
- 6. Bertola D. R., Yamamoto G. L., Almeida T. F., Buscarilli M., Jorge A. A., Malaquias A. C., Kim C. A., Takahashi V. N., Passos-Bueno M. R., and Pereira A. C. (2014) Further evidence of the importance of RIT1 in Noonan syndrome. Am. J. Med. Genet. Part A 164, 2952–2957 [DOI] [PubMed] [Google Scholar]
- 7. Gos M., Fahiminiya S., Poznánski J., Klapecki J., Obersztyn E., Piotrowicz M., Wierzba J., Posmyk R., Bal J., and Majewski J. (2014) Contribution of RIT1 mutations to the pathogenesis of Noonan syndrome: four new cases and further evidence of heterogeneity. Am. J. Med. Genet. A 164A, 2310–2316 [DOI] [PubMed] [Google Scholar]
- 8. Koenighofer M., Hung C. Y., McCauley J. L., Dallman J., Back E. J., Mihalek I., Gripp K. W., Sol-Church K., Rusconi P., Zhang Z., Shi G. X., Andres D. A., and Bodamer O. A. (2016) Mutations in RIT1 cause Noonan syndrome: additional functional evidence and expanding the clinical phenotype. Clin. Genet. 89, 359–366 [DOI] [PMC free article] [PubMed] [Google Scholar]
- 9. Yaoita M., Niihori T., Mizuno S., Okamoto N., Hayashi S., Watanabe A., Yokozawa M., Suzumura H., Nakahara A., Nakano Y., Hokosaki T., Ohmori A., Sawada H., Migita O., Mima A., et al. (2016) Spectrum of mutations and genotype-phenotype analysis in Noonan syndrome patients with RIT1 mutations. Hum. Genet. 135, 209–222 [DOI] [PubMed] [Google Scholar]
- 10. Kouz K., Lissewski C., Spranger S., Mitter D., Riess A., Lopez-Gonzalez V., Luttgen S., Aydin H., von Deimling F., Evers C., Hahn A., Hempel M., Issa U., Kahlert A. K., Lieb A., et al. (2016) Genotype and phenotype in patients with Noonan syndrome and a RIT1 mutation. Genet. Med. 10.1038/gim.2016.32 [DOI] [PubMed] [Google Scholar]
- 11. Cave H., Caye A., Ghedira N., Capri Y., Pouvreau N., Fillot N., Trimouille A., Vignal C., Fenneteau O., Alembik Y., Alessandri J. L., Blanchet P., Boute O., Bouvagnet P., David A., et al. (2016) Mutations in RIT1 cause Noonan syndrome with possible juvenile myelomonocytic leukemia but are not involved in acute lymphoblastic leukemia. Eur. J. Hum. Genet. 10.1038/ejhg.2015.273 [DOI] [PMC free article] [PubMed] [Google Scholar]
- 12. Romano A. A., Allanson J. E., Dahlgren J., Gelb B. D., Hall B., Pierpont M. E., Roberts A. E., Robinson W., Takemoto C. M., and Noonan J. A. (2010) Noonan syndrome: clinical features, diagnosis, and management guidelines. Pediatrics 126, 746–759 [DOI] [PubMed] [Google Scholar]
- 13. Roberts A. E., Allanson J. E., Tartaglia M., and Gelb B. D. (2013) Noonan syndrome. Lancet 381, 333–342 [DOI] [PMC free article] [PubMed] [Google Scholar]
- 14. Cordeddu V., Yin J. C., Gunnarsson C., Virtanen C., Drunat S., Lepri F., De Luca A., Rossi C., Ciolfi A., Pugh T. J., Bruselles A., Priest J. R., Pennacchio L. A., Lu Z., Danesh A., et al. (2015) Activating mutations affecting the Dbl homology domain of SOS2 cause Noonan syndrome. Hum. Mutat. 36, 1080–1087 [DOI] [PMC free article] [PubMed] [Google Scholar]
- 15. Shi G. X., Cai W., and Andres D. A. (2013) Rit subfamily small GTPases: regulators in neuronal differentiation and survival. Cell. Signal. 25, 2060–2068 [DOI] [PMC free article] [PubMed] [Google Scholar]
- 16. Heo W. D., Inoue T., Park W. S., Kim M. L., Park B. O., Wandless T. J., and Meyer T. (2006) PI(3,4,5)P3 and PI(4,5)P2 lipids target proteins with polybasic clusters to the plasma membrane. Science 314, 1458–1461 [DOI] [PMC free article] [PubMed] [Google Scholar]
- 17. Rusyn E. V., Reynolds E. R., Shao H., Grana T. M., Chan T. O., Andres D. A., and Cox A. D. (2000) Rit, a non-lipid-modified Ras-related protein, transforms NIH3T3 cells without activating the ERK, JNK, p38 MAPK or PI3K/Akt pathways. Oncogene 19, 4685–4694 [DOI] [PubMed] [Google Scholar]
- 18. Sakabe K., Teramoto H., Zohar M., Behbahani B., Miyazaki H., Chikumi H., and Gutkind J. S. (2002) Potent transforming activity of the small GTP-binding protein Rit in NIH 3T3 cells: evidence for a role of a p38γ-dependent signaling pathway. FEBS Lett. 511, 15–20 [DOI] [PubMed] [Google Scholar]
- 19. Berger A. H., Imielinski M., Duke F., Wala J., Kaplan N., Shi G. X., Andres D. A., and Meyerson M. (2014) Oncogenic RIT1 mutations in lung adenocarcinoma. Oncogene 33, 4418–4423 [DOI] [PMC free article] [PubMed] [Google Scholar]
- 20. Gómez-Seguí I., Makishima H., Jerez A., Yoshida K., Przychodzen B., Miyano S., Shiraishi Y., Husseinzadeh H. D., Guinta K., Clemente M., Hosono N., McDevitt M. A., Moliterno A. R., Sekeres M. A., Ogawa S., and Maciejewski J. P. (2013) Novel recurrent mutations in the RAS-like GTP-binding gene RIT1 in myeloid malignancies. Leukemia 27, 1943–1946 [DOI] [PMC free article] [PubMed] [Google Scholar]
- 21. Forbes S. A., Beare D., Gunasekaran P., Leung K., Bindal N., Boutselakis H., Ding M., Bamford S., Cole C., Ward S., Kok C. Y., Jia M., De T., Teague J. W., Stratton M. R., McDermott U., and Campbell P. J. (2015) COSMIC: exploring the world's knowledge of somatic mutations in human cancer. Nucleic Acids Res. 43, D805–811 [DOI] [PMC free article] [PubMed] [Google Scholar]
- 22. Li J. T., Liu W., Kuang Z. H., Zhang R. H., Chen H. K., and Feng Q. S. (2004) Mutation and amplification of RIT1 gene in hepatocellular carcinoma. Zhonghua Yi Xue Yi Chuan Xue Za Zhi 21, 43–46 [PubMed] [Google Scholar]
- 23. Lawrence M. S., Stojanov P., Mermel C. H., Robinson J. T., Garraway L. A., Golub T. R., Meyerson M., Gabriel S. B., Lander E. S., and Getz G. (2014) Discovery and saturation analysis of cancer genes across 21 tumour types. Nature 505, 495–501 [DOI] [PMC free article] [PubMed] [Google Scholar]
- 24. Marshall C. B., Ho J., Buerger C., Plevin M. J., Li G. Y., Li Z., Ikura M., and Stambolic V. (2009) Characterization of the intrinsic and TSC2-GAP-regulated GTPase activity of Rheb by real-time NMR. Sci. Signal. 2, ra3. [DOI] [PubMed] [Google Scholar]
- 25. Smith M. J., Neel B. G., and Ikura M. (2013) NMR-based functional profiling of RASopathies and oncogenic RAS mutations. Proc. Natl. Acad. Sci. U.S.A. 110, 4574–4579 [DOI] [PMC free article] [PubMed] [Google Scholar]
- 26. Mazhab-Jafari M. T., Marshall C. B., Smith M., Gasmi-Seabrook G. M., Stambolic V., Rottapel R., Neel B. G., and Ikura M. (2010) Real-time NMR study of three small GTPases reveals that fluorescent 2′(3′)-O-(N-methylanthraniloyl)-tagged nucleotides alter hydrolysis and exchange kinetics. J. Biol. Chem. 285, 5132–5136 [DOI] [PMC free article] [PubMed] [Google Scholar]
- 27. Shao H., Kadono-Okuda K., Finlin B. S., and Andres D. A. (1999) Biochemical characterization of the Ras-related GTPases Rit and Rin. Arch. Biochem. Biophys. 371, 207–219 [DOI] [PubMed] [Google Scholar]
- 28. Hunter J. C., Manandhar A., Carrasco M. A., Gurbani D., Gondi S., and Westover K. D. (2015) Biochemical and structural analysis of common cancer-associated KRAS mutations. Mol. Cancer Res. 13, 1325–1335 [DOI] [PubMed] [Google Scholar]
- 29. Reinstein J., Schlichting I., Frech M., Goody R. S., and Wittinghofer A. (1991) p21 with a phenylalanine 28–leucine mutation reacts normally with the GTPase activating protein GAP but nevertheless has transforming properties. J. Biol. Chem. 266, 17700–17706 [PubMed] [Google Scholar]
- 30. Lin R., Cerione R. A., and Manor D. (1999) Specific contributions of the small GTPases Rho, Rac, and Cdc42 to Dbl transformation. J. Biol. Chem. 274, 23633–23641 [DOI] [PubMed] [Google Scholar]
- 31. Gremer L., Merbitz-Zahradnik T., Dvorsky R., Cirstea I. C., Kratz C. P., Zenker M., Wittinghofer A., and Ahmadian M. R. (2011) Germline KRAS mutations cause aberrant biochemical and physical properties leading to developmental disorders. Hum. Mutat. 32, 33–43 [DOI] [PMC free article] [PubMed] [Google Scholar]
- 32. Shi G. X., and Andres D. A. (2005) Rit contributes to nerve growth factor-induced neuronal differentiation via activation of B-Raf-extracellular signal-regulated kinase and p38 mitogen-activated protein kinase cascades. Mol. Cell. Biol. 25, 830–846 [DOI] [PMC free article] [PubMed] [Google Scholar]
- 33. Smith M. J., and Ikura M. (2014) Integrated RAS signaling defined by parallel NMR detection of effectors and regulators. Nat. Chem. Biol. 10, 223–230 [DOI] [PubMed] [Google Scholar]
- 34. Nassar N., Singh K., and Garcia-Diaz M. (2010) Structure of the dominant negative S17N mutant of Ras. Biochemistry 49, 1970–1974 [DOI] [PMC free article] [PubMed] [Google Scholar]
- 35. Feig L. A., and Cooper G. M. (1988) Inhibition of NIH 3T3 cell proliferation by a mutant ras protein with preferential affinity for GDP. Mol. Cell. Biol. 8, 3235–3243 [DOI] [PMC free article] [PubMed] [Google Scholar]
- 36. Tabancay A. P. Jr., Gau C. L., Machado I. M., Uhlmann E. J., Gutmann D. H., Guo L., and Tamanoi F. (2003) Identification of dominant negative mutants of Rheb GTPase and their use to implicate the involvement of human Rheb in the activation of p70S6K. J. Biol. Chem. 278, 39921–39930 [DOI] [PubMed] [Google Scholar]
- 37. Stouten P. F., Sander C., Wittinghofer A., and Valencia A. (1993) How does the switch II region of G-domains work? FEBS Lett. 320, 1–6 [DOI] [PubMed] [Google Scholar]
- 38. Buhrman G., Kumar V. S., Cirit M., Haugh J. M., and Mattos C. (2011) Allosteric modulation of Ras-GTP is linked to signal transduction through RAF kinase. J. Biol. Chem. 286, 3323–3331 [DOI] [PMC free article] [PubMed] [Google Scholar]
- 39. Prior I. A., Lewis P. D., and Mattos C. (2012) A comprehensive survey of Ras mutations in cancer. Cancer Res. 72, 2457–2467 [DOI] [PMC free article] [PubMed] [Google Scholar]
- 40. Zhang M. Q. (1998) Statistical features of human exons and their flanking regions. Hum. Mol. Genet. 7, 919–932 [DOI] [PubMed] [Google Scholar]
- 41. Frech M., Darden T. A., Pedersen L. G., Foley C. K., Charifson P. S., Anderson M. W., and Wittinghofer A. (1994) Role of glutamine-61 in the hydrolysis of GTP by p21H−ras: an experimental and theoretical study. Biochemistry 33, 3237–3244 [DOI] [PubMed] [Google Scholar]
- 42. Addissie Y. A., Kotecha U., Hart R. A., Martinez A. F., Kruszka P., and Muenke M. (2015) Craniosynostosis and Noonan syndrome with KRAS mutations: expanding the phenotype with a case report and review of the literature. Am. J. Med. Genet. A 167A, 2657–2663 [DOI] [PubMed] [Google Scholar]
- 43. Nur-E-Kamal M. S., Sizeland A., D'Abaco G., and Maruta H. (1992) Asparagine 26, glutamic acid 31, valine 45, and tyrosine 64 of Ras proteins are required for their oncogenicity. J. Biol. Chem. 267, 1415–1418 [PubMed] [Google Scholar]
- 44. Fernández-Medarde A., and Santos E. (2011) Ras in cancer and developmental diseases. Genes Cancer 2, 344–358 [DOI] [PMC free article] [PubMed] [Google Scholar]
- 45. Schubbert S., Shannon K., and Bollag G. (2007) Hyperactive Ras in developmental disorders and cancer. Nat. Rev. Cancer 7, 295–308 [DOI] [PubMed] [Google Scholar]
- 46. Cirstea I. C., Gremer L., Dvorsky R., Zhang S. C., Piekorz R. P., Zenker M., and Ahmadian M. R. (2013) Diverging gain-of-function mechanisms of two novel KRAS mutations associated with Noonan and cardio-facio-cutaneous syndromes. Hum. Mol. Genet. 22, 262–270 [DOI] [PubMed] [Google Scholar]
- 47. Ford B., Boykevisch S., Zhao C., Kunzelmann S., Bar-Sagi D., Herrmann C., and Nassar N. (2009) Characterization of a Ras mutant with identical GDP- and GTP-bound structures. Biochemistry 48, 11449–11457 [DOI] [PMC free article] [PubMed] [Google Scholar]
- 48. Kapoor A., and Travesset A. (2014) Mechanism of the exchange reaction in HRAS from multiscale modeling. PloS One 9, e108846. [DOI] [PMC free article] [PubMed] [Google Scholar]
- 49. Gasper R., Thomas C., Ahmadian M. R., and Wittinghofer A. (2008) The role of the conserved switch II glutamate in guanine nucleotide exchange factor-mediated nucleotide exchange of GTP-binding proteins. J. Mol. Biol. 379, 51–63 [DOI] [PubMed] [Google Scholar]
- 50. Mott H. R., Carpenter J. W., and Campbell S. L. (1997) Structural and functional analysis of a mutant Ras protein that is insensitive to nitric oxide activation. Biochemistry 36, 3640–3644 [DOI] [PubMed] [Google Scholar]
- 51. Shi G. X., Jin L., and Andres D. A. (2010) Src-dependent TrkA transactivation is required for pituitary adenylate cyclase-activating polypeptide 38-mediated Rit activation and neuronal differentiation. Mol. Biol. Cell 21, 1597–1608 [DOI] [PMC free article] [PubMed] [Google Scholar]
- 52. Shi G. X., Rehmann H., and Andres D. A. (2006) A novel cyclic AMP-dependent Epac-Rit signaling pathway contributes to PACAP38-mediated neuronal differentiation. Mol. Cell. Biol. 26, 9136–9147 [DOI] [PMC free article] [PubMed] [Google Scholar]
- 53. Huang L., Carney J., Cardona D. M., and Counter C. M. (2014) Decreased tumorigenesis in mice with a K-ras point mutation at C118. Nat. Commun. 5, 5410. [DOI] [PMC free article] [PubMed] [Google Scholar]
- 54. Huang L., and Counter C. M. (2015) Reduced HRAS G12V-driven tumorigenesis of cell lines expressing K-RAS C118S. PloS One 10, e0123918. [DOI] [PMC free article] [PubMed] [Google Scholar]
- 55. Chen J., Ye Y., Sun H., and Shi G. (2013) Association between K-RAS codon 13 mutations and clinical response to anti-EGFR treatment in patients with metastatic colorectal cancer: results from a meta-analysis. Cancer Chemother. Pharmacol. 71, 265–272 [DOI] [PubMed] [Google Scholar]
- 56. De Roock W., Jonker D. J., Di Nicolantonio F., Sartore-Bianchi A., Tu D., Siena S., Lamba S., Arena S., Frattini M., Piessevaux H., Van Cutsem E., O'Callaghan C. J., Khambata-Ford S., Zalcberg J. R., et al. (2010) Association of KRAS p.G13D mutation with outcome in patients with chemotherapy-refractory metastatic colorectal cancer treated with cetuximab. JAMA 304, 1812–1820 [DOI] [PubMed] [Google Scholar]
- 57. Tejpar S., Celik I., Schlichting M., Sartorius U., Bokemeyer C., and Van Cutsem E. (2012) Association of K-RAS G13D tumor mutations with outcome in patients with metastatic colorectal cancer treated with first-line chemotherapy with or without cetuximab. J. Clin. Oncol. 30, 3570–3577 [DOI] [PubMed] [Google Scholar]
- 58. Jänne P. A., Smith I., McWalter G., Mann H., Dougherty B., Walker J., Orr M. C., Hodgson D. R., Shaw A. T., Pereira J. R., Jeannin G., Vansteenkiste J., Barrios C. H., Franke F. A., Crinò L., and Smith P. (2015) Impact of KRAS codon subtypes from a randomised phase II trial of selumetinib plus docetaxel in K-RAS mutant advanced non-small-cell lung cancer. Br. J. Cancer 113, 199–203 [DOI] [PMC free article] [PubMed] [Google Scholar]
- 59. Stolze B., Reinhart S., Bulllinger L., Fröhling S., and Scholl C. (2015) Comparative analysis of K-RAS codon 12, 13, 18, 61, and 117 mutations using human MCF10A isogenic cell lines. Sci. Rep. 5, 8535. [DOI] [PMC free article] [PubMed] [Google Scholar]
- 60. Marshall C. B., Meiri D., Smith M. J., Mazhab-Jafari M. T., Gasmi-Seabrook G. M., Rottapel R., Stambolic V., and Ikura M. (2012) Probing the GTPase cycle with real-time NMR: GAP and GEF activities in cell extracts. Methods 57, 473–485 [DOI] [PubMed] [Google Scholar]
- 61. Delaglio F., Grzesiek S., Vuister G. W., Zhu G., Pfeifer J., and Bax A. (1995) NMRPipe: a multidimensional spectral processing system based on UNIX pipes. J. Biomol. NMR 6, 277–293 [DOI] [PubMed] [Google Scholar]
- 62. Goddard T. D., and Kneller D. G. (2008) SPARKY 3, University of California, San Francisco, CA [Google Scholar]
- 63. Calvert R. J., Kammouni W., and Kikawa K. D. (2005) Optimization of a nonradioactive method for consistent and sensitive determination of activated K-ras protein. Anal. Biochem. 343, 283–292 [DOI] [PubMed] [Google Scholar]