

Abstract
Insulin resistance is a major aspect of type 2 diabetes (T2D), which results from impaired insulin signaling in target cells. Signaling to regulate forkhead box protein O1 (FOXO1) may be the most important mechanism for insulin to control transcription. Despite this, little is known about how insulin regulates FOXO1 and how FOXO1 may contribute to insulin resistance in adipocytes, which are the most critical cell type in the development of insulin resistance. We report a detailed mechanistic analysis of insulin control of FOXO1 in human adipocytes obtained from non-diabetic subjects and from patients with T2D. We show that FOXO1 is mainly phosphorylated through mTORC2-mediated phosphorylation of protein kinase B at Ser473 and that this mechanism is unperturbed in T2D. We also demonstrate a cross-talk from the MAPK branch of insulin signaling to stimulate phosphorylation of FOXO1. The cellular abundance and consequently activity of FOXO1 are halved in T2D. Interestingly, inhibition of mTORC1 with rapamycin reduces the abundance of FOXO1 to the levels in T2D. This suggests that the reduction of the concentration of FOXO1 is a consequence of attenuation of mTORC1, which defines much of the diabetic state in human adipocytes. We integrate insulin control of FOXO1 in a network-wide mathematical model of insulin signaling dynamics based on compatible data from human adipocytes. The diabetic state is network-wide explained by attenuation of an mTORC1-to-insulin receptor substrate-1 (IRS1) feedback and reduced abundances of insulin receptor, GLUT4, AS160, ribosomal protein S6, and FOXO1. The model demonstrates that attenuation of the mTORC1-to-IRS1 feedback is a major mechanism of insulin resistance in the diabetic state.
Keywords: adipocyte, human, insulin resistance, mammalian target of rapamycin (mTOR), mathematical modeling, protein phosphorylation, transcription factor, type 2 diabetes, insulin signaling, ribosome biogenesis
Introduction
Insulin has a crucial function to maintain energy homeostasis at the whole-body level and at the cellular level in a variable environment of nutrient supply. Failure to sustain this function is at the center of diabetes. Type 2 diabetes (T2D)2 is characterized by failure to properly respond to insulin in target cells (insulin resistance) and by impaired production of the hormone. Because of the central role of insulin in energy homeostasis, effects of insulin are pleiotropic, affecting almost every aspect of cellular metabolism, which is reflected in a highly branched signaling network in target cells of the hormone. T2D is also closely related to obesity (1), and the insulin resistance first develops in the adipocytes of an expanding adipose tissue. Failure to store fat in the adipose tissue then leads to ectopic fat deposition in other organs, such as liver and muscle, which is believed to spread the insulin resistance to those organs (2). Eventually the insulin-producing β-cells often fail to compensate for the insulin resistance, and T2D can be diagnosed. It is therefore of primary importance to understand the disease mechanisms in human adipocytes to be able to treat the disease at an early stage before other organs are affected.
Forkhead box protein O1 (FOXO1) may be the most important mediator of the control of transcription by insulin. FOXO1 is particularly important in regulating the levels of key rate-controlling enzymes in cellular metabolism (for reviews, see Refs. 3–5). FOXO1 has also been reported to control insulin receptor (IR) transcription (6) and is likely involved in transcriptional control of other signaling mediators of insulin. The perturbation of such transcriptional feedbacks may be involved in establishment of the long term effects of insulin resistance. In particular, FOXO1 suppresses expression and activity of both peroxisome proliferator-activated receptor-γ and CCAAT/enhancer binding protein-α and could thereby inhibit adipogenesis in mice (7). FOXO1 thus affects the number and size of adipocytes (8–10), which appear to be critical to the diabetic state (11–15).
FOXO1 is part of a subfamily that has four highly homologous members, FOXO1, FOXO3, FOXO4, and FOXO6. FOXO1, FOXO3, and FOXO4 are similarly regulated (for a review, see Ref. 16). Genetically manipulated mouse models indicate that FOXO1, FOXO3, and FOXO4 are redundant in many aspects, although FOXO-specific knock-out mice display specific developmental abnormalities. FOXO1 is the most abundant of the FOXOs in metabolically important tissues, such as in adipose tissue, liver, skeletal muscle, skeleton, β-cells, and hypothalamus. FOXO1 is potentially subject to regulation through control of its expression, different post-translational modifications, binding to chaperone proteins, and degradation. A fundamental control mechanism exerted by insulin is the reversible phosphorylation of three phosphorylation sites, Thr24, Ser256, and Ser319 (human sequence). Phosphorylation at these sites by protein kinase B (PKB) inhibits transcriptional control by FOXO1 by inducing the rapid exclusion of the protein from the nucleus (for reviews, see Refs. 17–19). FOXO1 is also subject to acetylation, methylation, and ubiquitination. Reversible acetylation of FOXO1 modulates its activity, although whether acetylation results in enhanced or reduced transcriptional activity may depend on the target gene (20–22).
There are, however, two fundamental hurdles that have prevented us from understanding the role of FOXO1 in the development of insulin resistance and T2D. First, the function of FOXO1 in human adipocytes has been underinvestigated, and little is known about how FOXO1 contributes to the diabetic state. Second, nothing is known about the function of FOXO1 on a systems level, which is where it is connected with the mechanisms of insulin resistance.
To understand the role of FOXO1 at the systems level, it is necessary to collect internally consistent experimental data for insulin signaling to control FOXO1 as well as of the different branches of the insulin-signaling network. Together with specific perturbations of the signaling and mathematical modeling, such data can provide a systems level understanding of insulin signaling. When further combined with compatible data from cells of patients with T2D, the systems analysis can also pinpoint mechanisms of insulin resistance in diabetes. We have previously developed a mathematical model of insulin signaling based on internally consistent dynamic data obtained from isolated human adipocytes that describes insulin signaling control of glucose uptake, protein synthesis, and autophagy and transcriptional control via MAPK-Elk1, normally and in diabetes (23–26). Importantly, the model has established a single mechanism that can explain the insulin resistance throughout the examined branches of the signaling network. This model forms a basis for an expandable mathematical model of the dynamics of the insulin-signaling network. However, the model has lacked the FOXO1 branch of insulin signaling.
Herein we report an in-depth analysis of insulin control of FOXO1 in mature human adipocytes, normally and in T2D, and integrate this control into a systems-wide comprehensive mathematical model of insulin signaling. In particular, our analysis demonstrates the mechanistic origin and spreading of insulin resistance of T2D throughout the signaling network and the role of FOXO1 in this condition.
Results
Abundance and Phosphorylation of FOXO1 in Response to Insulin, Normally and in T2D
To understand the role of FOXO1 in human adipocytes, normally and in T2D, we first examined the abundance and phosphorylation of FOXO1. The abundance of FOXO1 protein in adipocytes from patients with T2D was reduced to 55% of the concentration in cells from non-diabetic subjects (Fig. 1B and Table 1).
FIGURE 1.

Abundance of signaling proteins, normally and in T2D. Adipocytes from non-diabetic control subjects (blue) or subjects with T2D (red) were analyzed for the abundance of the indicated signaling protein by SDS-PAGE and immunoblotting. Data are presented as mean ± S.E. (error bars) of cell preparations from the indicated number of subjects. a.u., arbitrary units. Representative immunoblots are shown with the lower band representing the loading control tubulin (t). A, tubulin. The amount of tubulin was quantified in the 16 different non-diabetic and 15 different diabetic subjects that were analyzed in B–F. B, FOXO1; 10 non-diabetic control subjects (mean age, 62 years (range, 33–91); mean BMI, 24 kg/m2 (range, 19–27)) and 10 subjects with T2D (mean age, 55 years (range, 28–81); mean BMI, 39 kg/m2 (range, 28–49)). C, S6; nine non-diabetic control subjects (mean age, 64 years (range, 33–91); mean BMI, 24 kg/m2 (range, 19–27)) and eight subjects with T2D (mean age, 55 years (range, 28–81); mean BMI, 39 kg/m2 (range, 28–49)). D, AS160; nine non-diabetic control subjects (mean age, 65 years (range, 43–91); BMI, 20–27 kg/m2; mean BMI, 24 kg/m2 (range, 20–27)) and seven subjects with T2D (mean age, 59 years (range, 28–79); mean BMI, 34 kg/m2 (range, 28–43)). E, mTOR, eight non-diabetic control subjects (mean age, 67 years (range, 37–91); mean BMI, 23 kg/m2 (range, 19–27)) and 11 subjects with T2D (mean age, 64 years (range, 37–91); mean BMI, 37 kg/m2 (range, 28–49)). F, PKB, nine non-diabetic control subjects (mean age, 62 years (age, 33–91); mean BMI, 23 kg/m2 (range, 19–27)) and six subjects with T2D (mean age, 57 years (range, 28–81); mean BMI, 37 kg/m2 (range, 31–45)). The non-diabetic control subjects had a mean fasting plasma concentration of glucose of 6.4 mm (range, 5.3–8.0) and a mean concentration of insulin of 54 pm (range, 6–142).
TABLE 1.
Summary of the abundances and insulin responses of the different intermediaries in the insulin-signaling network, normally and in T2D
Steady-state levels of phosphorylation and glucose uptake, determined at maximal insulin concentrations, are presented as -fold increase over non-diabetic controls at basal (without insulin) conditions. contr, non-diabetic controls; ND, not determined; no-ss, no steady-state; ns, not significantly different. Data are from Refs. 23–26 and 31 and herein.
| Sensitivity EC50 |
Response time t½ |
Steady-state level |
Total abundance of corresponding protein in T2D | Refs. | ||||
|---|---|---|---|---|---|---|---|---|
| contr | T2D | contr | T2D | contr | T2D | |||
| nm insulin | min | -fold over basal contr | % of contr | |||||
| IR-Tyr(P) | 1.0 | 1.0 | 1.0 | ND | 4.3 | 1.5 | 55 | 25, 31 |
| IRS1-Tyr(P) | 0.3 | 2.0 | 1.0 | ND | 2.6 | 1.0 | ns | 23, 25, 31 |
| IRS1-Ser(P)307 | 0.2 | 0.9 | 0.7 | 2.0 | 4.4 | 1.9 | 25 | |
| PKB-Thr(P)308 | 0.3 | 0.4 | ND | ND | 5.0 | 5.0 | ns | 25, herein |
| PKB-Ser(P)473 | 0.1 | 0.4 | 1.0 | 1.0 | 5.0 | 5.0 | 25 | |
| AS160-Thr(P)642 | 0.02 | 0.2 | 1.5 | 2.0 | 2.9 | 1.3 | 45 | 25, herein |
| Glucose transport | 0.04 | 0.2 | ND | ND | 2.1 | 1.0 | 50 | 25 |
| S6K1-Thr(P)389 | ND | ND | 7.5 | 7.5 | 4.1 | 2.6 | ns | 24, 25 |
| S6-Ser(P)235/236 | 0.3 | ND | 15 | 4.3 | 2.5 | 48 | 25, herein | |
| ERK1/2-Thr(P)202/Tyr(P)204 | 0.2 | 0.7 | 2.5 | 2.5 | no-ss | no-ss | ns | 26 |
| Elk1-Ser(P)383 | ND | ND | 5 | no-ss | no-ss | ns | 26 | |
| FOXO1-Ser(P)256 | 0.02 | 0.02 | 5 | 5 | 1.7 | 1.1 | 55 | Herein |
The time course for phosphorylation of FOXO1 at Ser256 3 in response to insulin (10 nm) stimulation of non-diabetic control cells revealed a rapid (t½ = ∼5 min) phosphorylation in response to the hormone (Fig. 2A, blue). In Table 1, this number can be compared with the corresponding numbers for the other examined signal mediators. The response time was similar in cells from patients with T2D (Fig. 2A, red), but the level of phosphorylation was lower due to the reduced abundance of FOXO1. When corrected for the amount of FOXO1, the phosphorylation was similar in cells from patients with T2D and in normal non-diabetic cells (Fig. 2B, red dashed line). However, the total abundance of non-phosphorylated (i.e. active) FOXO1 is reduced in T2D.
FIGURE 2.
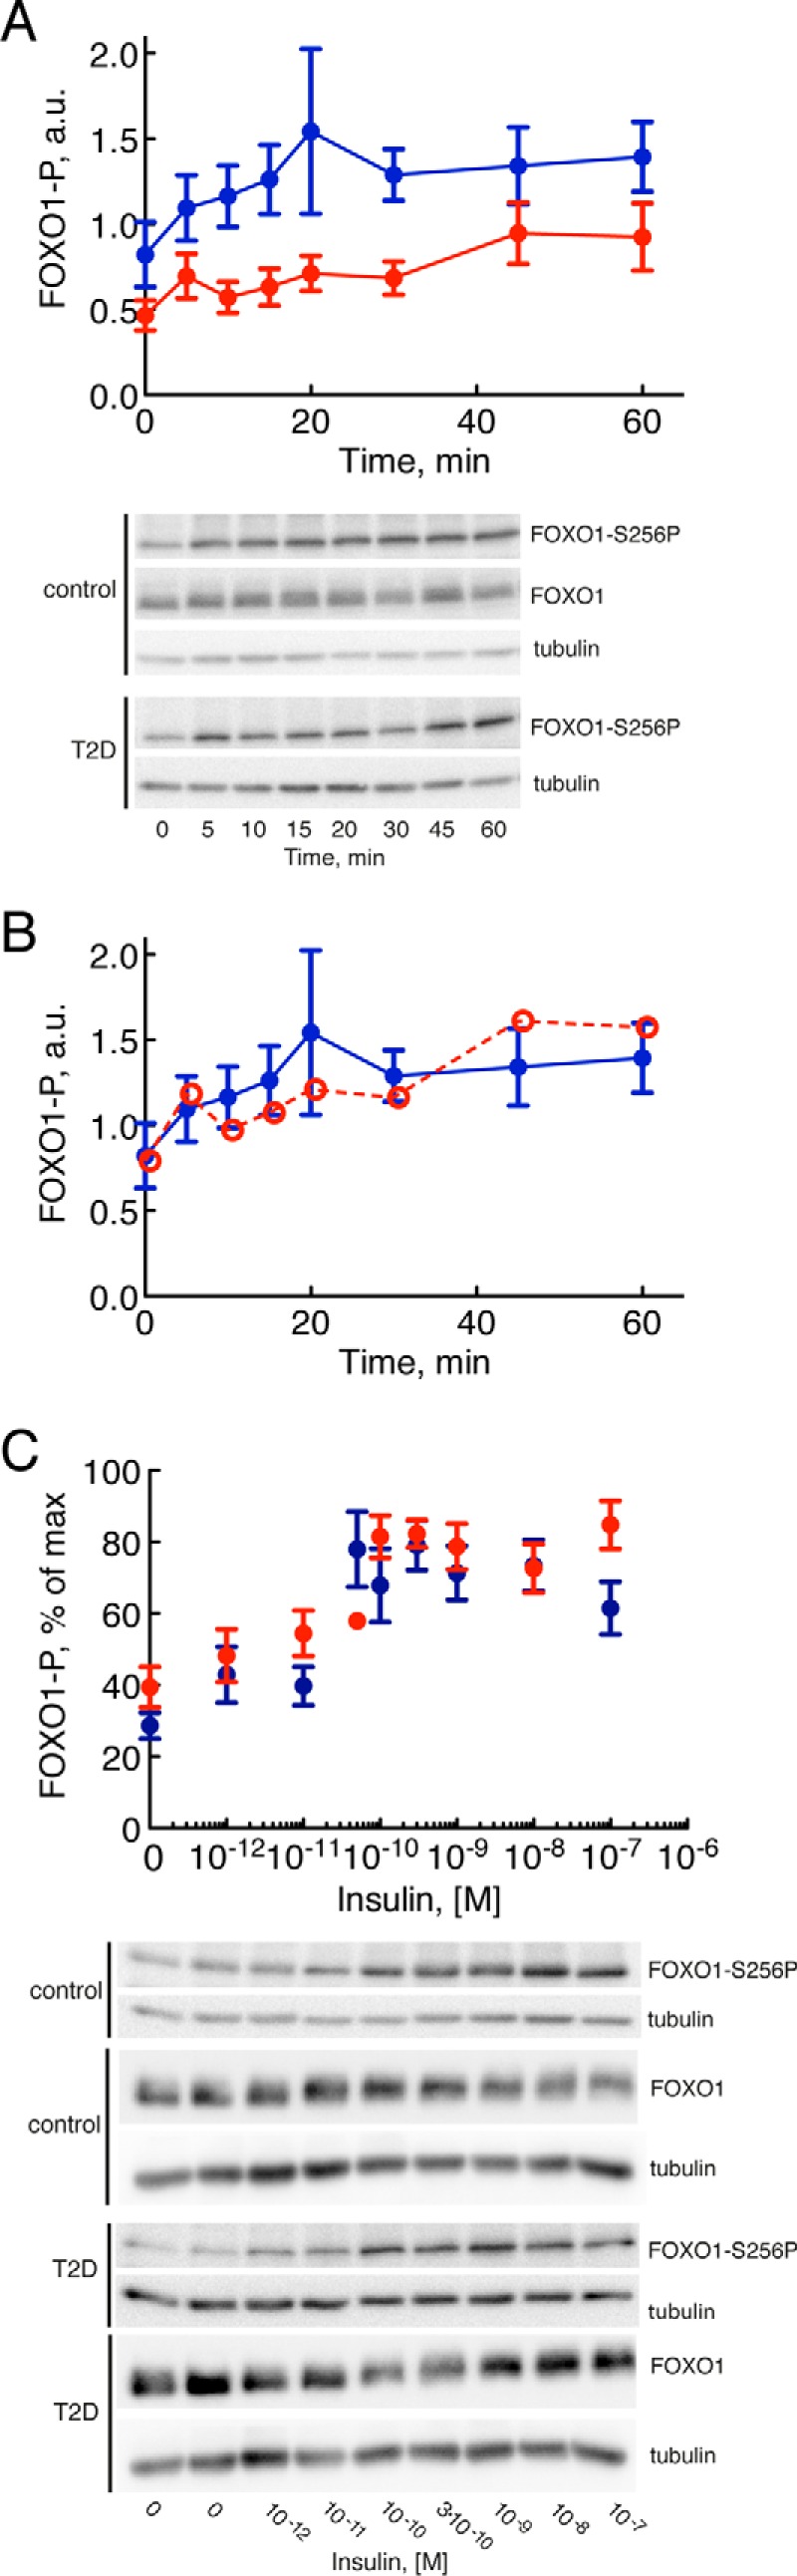
Insulin control of phosphorylation of FOXO1, normally and in T2D. Adipocytes from non-diabetic control subjects (blue) and subjects with T2D (red) were analyzed for phosphorylation, time course and dose response, in response to insulin by SDS-PAGE and immunoblotting. Data are presented as mean ± S.E. (error bars) of cell preparations from the indicated number of subjects. a.u., arbitrary units. Representative immunoblots are shown. A, time course for phosphorylation (P) of FOXO1 at serine 256 in response to 10 nm insulin for the indicated times. Adipocytes from six subjects were analyzed in each group: six non-diabetic control subjects (mean age, 63 years (range, 37–91); mean BMI, 24 kg/m2 (range, 21–27); mean fasting plasma concentration of glucose, 5.8 mm (range, 5.0–8.0); mean concentration of insulin, 53 pm (range, 16–142)) and six subjects with T2D (mean age, 60 years (range, 44–73); mean BMI, 40 kg/m2 (range, 28–52)). B, same as in A, but the extent of phosphorylation in diabetic cells was normalized to the reduced abundance of FOXO1 in diabetic cells (red open and dashed line). C, dose response for phosphorylation of FOXO1 at serine 256 after 30 min in response to the indicated concentrations of insulin. Adipocytes from eight subjects were analyzed in each group except for the 10−10 m concentration of insulin where adipocytes from one diabetic patient were analyzed: eight non-diabetic control subjects (mean age, 65 years (range, 50–85); mean BMI, 26 kg/m2 (range, 23–28); mean fasting plasma concentration of glucose, 6.2 mm (range, 5.0–8.4); mean concentration of insulin, 54 pm (range, 22–97)) and eight subjects with T2D (mean age, 59 years (range, 28–74); mean BMI, 37 kg/m2 (range, 28–52)).
The response to different concentrations of insulin demonstrated an EC50 for phosphorylation of FOXO1-Ser256 at about 0.02 nm insulin (Fig. 2C and Table 1). There was no difference in EC50 for insulin in adipocytes from patients with T2D compared with cells from non-diabetic subjects (Fig. 2C). It can be noted that the abundance of FOXO1 was not affected by its phosphorylation in response to insulin over 60 min (Fig. 2A) or in response to different concentrations of insulin (Fig. 2C).
Taken together, these findings demonstrate that the ability of insulin to control FOXO1 is not affected in the diabetic state. This can readily be explained by the dependence of FOXO1 phosphorylation on phosphorylation of PKB at Ser473 as shown next. However, due to the reduced abundance, the cellular functions of FOXO1 are likely affected in diabetes.
FOXO1 Is Downstream of PKB Phosphorylated at Ser473
The phosphorylation of FOXO1 by PKB in response to insulin has been found to depend on phosphorylation of PKB at Ser473, which is catalyzed by mammalian/mechanistic target of rapamycin (mTOR) in complex with rictor (mTORC2) (Fig. 3), and to be largely independent of phosphorylation of PKB at Thr308, which is catalyzed by phosphoinositide-dependent protein kinase-1 downstream of insulin receptor substrate-1 (IRS1) (Fig. 3). We wanted to examine whether this concept operates in human adipocytes. We have previously shown that the phosphorylation of PKB at Ser473 in response to insulin is not affected by rapamycin (25), which is a specific inhibitor of mTOR in complex with raptor (mTORC1) without much acute effect on mTORC2. Rapamycin also had no effect on the phosphorylation of FOXO1 in response to insulin (Fig. 4A), whereas torin-1, which inhibits both mTORC1 and mTORC2, inhibited the insulin-stimulated phosphorylation of both PKB-Ser473 (Fig. 4B) and FOXO1 (Fig. 4C). Hence, the situation in human adipocytes is compatible with FOXO1 being exclusively under the control of PKB phosphorylation at Ser473 as is the case in other cell types (27–29). Note that neither treatment with rapamycin nor with torin-1 affected the abundance of FOXO1 in the cells (Fig. 4E).
FIGURE 3.

The insulin-signaling network. Examined phosphorylation sites in signaling intermediaries are indicated (-P). The green arrow indicates positive feedback signal.
FIGURE 4.

Effects of MEK, mTORC1, or mTORC1+2 inhibitors on insulin signaling for control of FOXO1. Cells were preincubated with vehicle (−) or 50 nm rapamycin, 1 μm torin-1, or 10 μm PD184352 for 30 min followed by incubation with 10 nm insulin for 30 min. Data are expressed as mean ± S.E. (error bars). Representative immunoblots of cells are shown with the lower band representing the loading control tubulin (the 0- and 30-min blots were quantified). A, effects of rapamycin on the phosphorylation (P) of FOXO1 at serine 256 (adipocytes from four subjects were analyzed in each group). Data are expressed as mean ± S.E. (error bars). B, effects of torin-1 on the phosphorylation of PKB at serine 473 (adipocytes from two subjects were analyzed in each group). Data expressed as mean ± range (error bars). C, effects of torin-1 on the phosphorylation of FOXO1 at serine 256 (adipocytes from two subjects were analyzed in each group). Data are expressed as mean ± range (error bars). D, effects of PD184352 on phosphorylation of FOXO1 at serine 256 (adipocytes from five subjects were analyzed in each group). Data are expressed as mean ± S.E. (error bars). E, effects of rapamycin, torin-1, or PD184352 as indicated on the abundance of FOXO1 in the cells. veh, vehicle; rapa, rapamycin; torin, torin-1; PD, PD184352.
Acetylation of FOXO1, Normally and in T2D
We next examined the state of acetylation of FOXO1 because acetylation at lysines has been found to modulate the activity of FOXO1 in mice (20–22). We examined acetylation of FOXO1 at Lys262,265,274 (human sequence). The acetylation appeared to be slightly reduced in adipocytes from patients with T2D compared with cells from non-diabetic subjects (Fig. 5). However, the extent of acetylation varied a lot between individuals, and the reduction was not statistically significant. This indicates that T2D does not involve any major changes in the acetylation of FOXO1 at Lys262,265,274, which is compatible with the intact response to insulin in the diabetic state. Likewise, changes in the state of methylation of FOXO1 probably do not contribute to the diabetic state as methylation of FOXO1 at Arg251 and Arg253 in the PKB recognition motif for phosphorylation of FOXO1 has been shown to inhibit subsequent phosphorylation at Ser256 (30).
FIGURE 5.
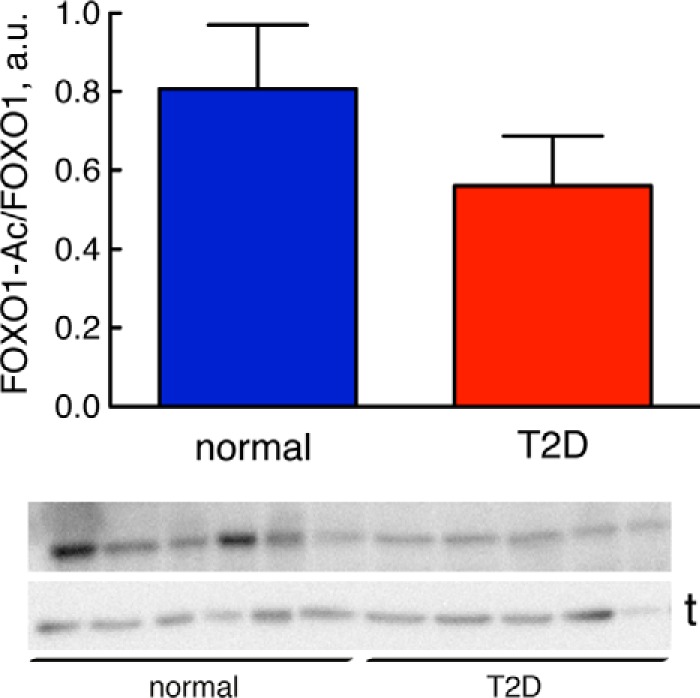
Extent of acetylation of FOXO1, normally and in T2D. The total level of FOXO1 acetylation at Lys262,265,274 (human sequence) was analyzed by SDS-PAGE and immunoblotting in adipocytes from nine non-diabetic control subjects (blue) (mean age, 66 years (range, 27–91); mean BMI, 24 kg/m2 (range, 19–28)) and 10 subjects with type 2 diabetes (red) (mean age, 66 years (range, 28–81); mean BMI, 40 kg/m2 (range, 29–49)). Data are expressed as mean ± S.E. (error bars). a.u., arbitrary units. The non-diabetic control subjects had a mean fasting plasma concentration of glucose of 6.3 mm (range, 4.4–8.0) and a mean concentration of insulin of 53 pm (range, 16–142). Representative immunoblots are shown; each sample represents a single subject with the lower band representing the loading control tubulin (t).
Abundance of Signaling Proteins
We have reported earlier that the abundances of the IR (23, 31) and the insulin-regulated glucose transporter (GLUT4) (25) are reduced in human adipocytes in T2D, whereas the abundances of IRS1 (23, 31), p70 ribosomal S6 kinase (S6K) (24), extracellular signal-regulated kinases 1/2 (ERK1/2) (26), and Elk1 (26) are the same in cells from non-diabetic subjects and from patients with T2D (Table 1). We now wanted to examine whether any other key signaling protein in the insulin-signaling network is affected in the diabetic state. The abundances of ribosomal protein S6 (S6) and AS160 in cells from patients with T2D were reduced to about 45% of the levels in non-diabetic cells (Fig. 1, C and D). The abundances of mTOR and PKB were not significantly different in the diabetic cells (Fig. 1, E and F, and Table 1).
Abundance of rRNA
The reduced abundance of the ribosomal protein S6 (Fig. 1C) indicated that ribosome biogenesis might be affected in T2D. We therefore examined the abundance of the 18S ribosomal RNA that is part of the same 40S ribosomal subunit as the S6 protein. Indeed, the abundance of the 18S rRNA was also reduced in cells from patients with T2D compared with cells from non-diabetic controls (Fig. 6). As mTORC1 has been implicated in the control of biosynthesis of rRNA (32, 33), our findings suggest that mTORC1 controls not only the efficiency of protein synthesis but also the translational capacity in human adipocytes. And, interestingly, both translational efficiency (reduced phosphorylation of S6 (25)) and capacity (reduced abundance of ribosomes) are impaired in the diabetic state as a result of the attenuated mTORC1.
FIGURE 6.
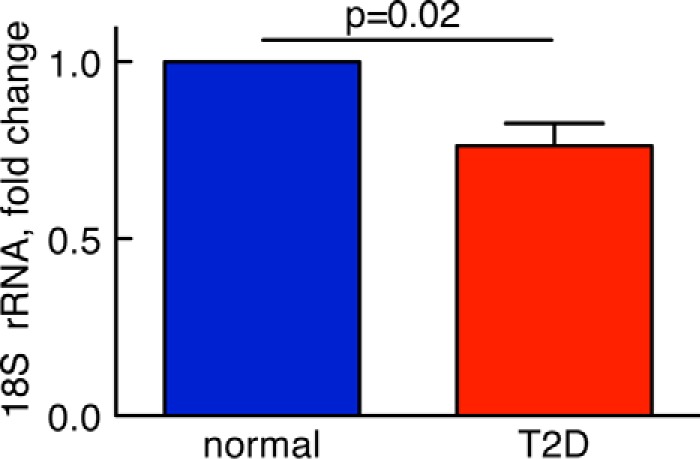
Abundance of rRNA, normally and in T2D. RNA was isolated from human adipocytes obtained from five non-diabetic control subjects (blue) (mean age, 62 years (range, 57–69); mean BMI, 23 kg/m2 (range, 22–24)) and five subjects with type 2 diabetes (red) (mean age, 68 years (range, 45–79); mean BMI, 34 kg/m2 (range, 28–43)). RNA samples were then analyzed for the abundance of 18S rRNA by real time PCR. Data are presented as fraction of the mean of non-diabetic controls, mean ± S.E. (error bars), of cell preparations from the indicated number of subjects.
Long Term Effects of mTORC1 Inhibition on Abundance of Signaling Proteins
Because attenuation of mTORC1 signaling is a fundamental mechanism of insulin resistance in human adipocytes (23–26), we examined the effect of inhibiting mTORC1 with rapamycin for 48 h on the abundance of the insulin-signaling mediators that are reduced in the diabetic state. Interestingly, inhibition of mTORC1 activity in non-diabetic cells reduced the abundance of FOXO1 (Fig. 7A) to about the same level as in cells from patients with T2D (Fig. 1B). In contrast, 48-h inhibition of mTORC1 had no effects on the abundance of IR, S6, AS160, or GLUT4 (Fig. 7, B–E). It is nevertheless possible that e.g. the level of IR is reduced secondarily to the reduction of FOXO1 (6) in response to prolonged inhibition of mTORC1. We could not examine this possibility because the primary adipocytes do not fare well during such prolonged incubations. It is known that prolonged incubation with rapamycin in some cell types can also inhibit mTORC2 (34). This was, however, not the case in the human adipocytes as the effect of insulin on phosphorylation of PKB at Ser473 was not inhibited (Fig. 7F).
FIGURE 7.

Abundance of signaling proteins after prolonged inhibition of mTORC1 with rapamycin. Adipocytes from non-diabetic control subjects were incubated with 50 nm rapamycin or vehicle (control) for 48 h and then analyzed for the abundance of the indicated signaling protein by SDS-PAGE and immunoblotting. Data are presented as mean ± S.E. (error bars) of cell preparations from the indicated number of subjects. a.u., arbitrary units. Representative immunoblots are shown with the lower band representing the loading control tubulin (t). Subjects are arbitrarily numbered for this figure. A, abundance of FOXO1 (four subjects). B, abundance of IR (four subjects). C, abundance of S6 (four subjects). D, abundance of AS160 (four subjects). E, abundance of GLUT4 (five subjects). F, phosphorylation (P) of PKB at Ser473 (four subjects).
Cross-talk with the MAPK Branch of the Insulin-signaling Network
Signaling networks are characterized by cross-talk between signaling branches, and we therefore examined whether the MAPK branch could affect the phosphorylation of FOXO1. Inhibition of mitogen-activated protein kinase/extracellular signal-regulated kinase kinases 1/2 (MEK1/2)-catalyzed phosphorylation/activation of ERK1/2 by the specific inhibitor PD184352 inhibited the insulin-stimulated phosphorylation of FOXO1 at Ser256 by 35% (Fig. 4D) without affecting the abundance of FOXO1 (Fig. 4E). This demonstrates the existence of a significant cross-talk between the MAPK branch and the mTORC2-PKB branch of insulin signaling in the control of FOXO1 phosphorylation in human adipocytes.
A Comprehensive Mathematical Model of the Insulin-signaling Network
To perform a systems analysis of our data on the insulin-signaling network, we integrated insulin signaling with control of FOXO1 in a comprehensive dynamic mathematical model of the insulin-signaling network as outlined in Fig. 3 and detailed in Fig. 8. The model structure includes our finding that FOXO1 is downstream of PKB-Ser(P)473 with limited contribution from PKB-Thr308. The model structure also includes the new cross-talk from the mitogen-activated protein kinase branch to phosphorylation of FOXO1 (Fig. 8).
FIGURE 8.

A comprehensive mathematical model for insulin resistance in T2D. Given is the structure of the complete mathematical model for insulin signaling and insulin resistance in human adipocytes with the new FOXO1 module included. The insulin receptor (IR) exists in five states in the model: phosphorylated in the membrane (IRm-YP) and internalized (IRi-YP), insulin-bound (IRins), and inactive in the membrane (IRm) and internalized (IRi). To simulate the model in the diabetic state, the diabetes parameters (shown in “red”) were used. The main diabetes parameter (15% feedback) is fitted to data. All other diabetes parameters are based on measurements of protein levels herein (Fig. 1, B–D), 55% IR (31), and 50% GLUT4 (25). Heavy arrows represent transitions between states of the same protein, and arrows represent activation/deactivation of proteins. Model equations are described in detail in the supplemental material. P after a residue number indicates phosphorylation.
Simulation with the model demonstrates a good fit with the experimental data for the non-diabetic controls throughout the network (Fig. 9, blue simulation lines and data points, respectively). It should be noted that, although knowledge of the effects of mTOR inhibitors was used to outline the model structure, the actual data were not used to optimize the model parameters.
FIGURE 9.

Model simulations are in agreement with normal and diabetes data. Shown are model simulations (lines) using the mathematical model in Fig. 8 for insulin signaling, normally (blue) and in T2D (red), and comparisons with the corresponding experimental data (dots and error bars (S.E.)) for the indicated signaling intermediaries. Normal simulations are scaled with normalization constants to the experimental data (blue). The T2D simulations are obtained by changing the diabetes parameters as shown in Fig. 8. The data obtained herein for FOXO1 are explained in the legend to Fig. 2, and the other data sets are detailed in Refs. 25, 26, and 52. a.u., arbitrary units.
To model the diabetic state, we introduced the differences (diabetes parameters) that we have identified in the signaling network in adipocytes from diabetics. First, the reduced abundances of FOXO1, AS160, and S6 (Fig. 1, B–D) and the earlier reported reduced abundances of insulin receptor (23, 31) and GLUT4 (25) were introduced. The abundances of mTOR (Fig. 1E), PKB (Fig. 1F), IRS1 (23, 31), S6K (24), ERK1/2 (26), and Elk1 (26), however, are the same in cells from non-diabetic subjects and from patients with T2D. Second, we introduced the attenuation of the feedback from mTORC1 to phosphorylation of IRS1 at Ser307 (23–25). The values of these diabetes parameters are shown in Fig. 8, and when applied, the model faithfully describes the experimental data obtained in cells from patients with T2D (Fig. 9, red simulation lines and data points, respectively). It can be noted, however, that the model does not replicate the experimentally observed small increase in the phosphorylation of PKB at Ser473 in the diabetic state (Fig. 9). This is an interesting discrepancy that indicates that the model structure lacks feedback and/or cross-talk from other branches of the network, e.g. from mTORC1-S6K to Rictor of the mTORC2 complex (35–37). However, the effect is small and does not affect the downstream phosphorylation of FOXO1 (Fig. 2).
Contribution of the Different Diabetes Parameters to the Diabetic State
We next utilized the comprehensive model to examine the impact on insulin signaling by the different diabetes parameters individually. The reduced abundance of the insulin receptor has local effects on its autophosphorylation in response to insulin but also on signaling via AS160 and through the MAPK branch to control Elk1 (Fig. 10), which is directly downstream of the insulin receptor as well as downstream of IRS1 (26) (Figs. 3 and 8). The reduced abundances of GLUT4, AS160, and S6, as expected, have only local effects in the insulin-signaling network (Fig. 10). It remains to be determined what the long term cellular effects of the reduced amount of FOXO1 are and how those may affect the signaling network. Importantly, the reduced mTORC1-to-IRS1 feedback determines the reduced steady-state responses and sensitivity to insulin (EC50) in diabetes throughout the network (except for signaling to FOXO1, which is unperturbed in T2D for reasons discussed above) (Fig. 10).
FIGURE 10.
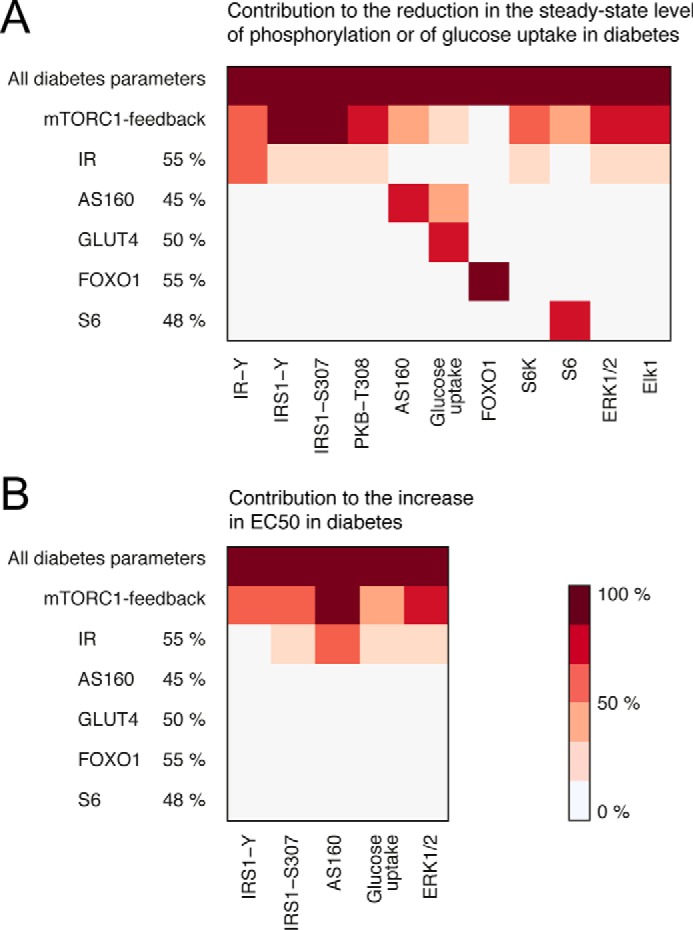
The impact of the individual diabetes parameters. Shown are heat maps of the impact of the individual diabetes parameters on the measured model variables. Light color indicates a small contribution, and dark color indicates a large contribution. The mTORC1 feedback contributes to the reduction in the steady-state level of phosphorylation and to the increased EC50 all over the insulin-signaling network. The reduction of IR levels also has slight effects network-wide, whereas all other diabetes parameters reflect peripheral protein levels, the reductions of which only have local effects. A, the contribution to the reduction in the steady-state level of phosphorylation for the diabetes parameters is calculated as the reduction from normal in the insulin-stimulated steady state for a single diabetes parameter (as indicated) divided by the reduction from normal in the diabetes simulation with all diabetes parameters. B, the contribution to the increase in EC50 for the diabetes parameters is calculated as the increase above normal in EC50 for a single diabetes parameter (as indicated) divided by the increase above normal in the diabetes simulation with all diabetes parameters.
Experimental Tests of the Model
We have herein and previously described how the feedback from mTORC1 to phosphorylation of IRS1 at Ser307 is attenuated in T2D (23–25). Simulation of the comprehensive model of the insulin-signaling network with inhibition of mTORC1 and thus inhibition of the crucial mTORC1-to-IRS1 feedback has been experimentally verified (using rapamycin to inhibit mTORC1) for insulin signaling control of glucose transport (38), protein synthesis (25), autophagy (24), and MAPK-mediated regulation of the transcription factor Elk1 (26). Model simulations for inhibition of mTORC1 indicated no inhibition of the phosphorylation of FOXO1 in response to insulin (Fig. 11). Accordingly, the phosphorylation of FOXO1 in response to insulin was not affected when we experimentally inhibited mTORC1 with rapamycin in human adipocytes (Fig. 4A). In contrast, model simulations for inhibition of both mTORC1 and mTORC2 indicated inhibition of the phosphorylation of both PKB-Ser473 and FOXO1 (Fig. 11), which was experimentally verified using the inhibitor torin-1 (Fig. 4, B and C). It is also important that inhibition of the phosphorylation and activation of ERK1/2 in the model (Fig. 11) simulates the experimental effects on the phosphorylation of FOXO1 in response to insulin using the inhibitor PD184352 to inhibit MEK-ERK1/2 (Fig. 4D). The simulations of the model with inhibition of mTOR required no refitting of parameters in the model.
FIGURE 11.

Inhibition of mTORC1, mTORC1+2, or MEK to test the model. Shown are simulations of the mathematical model in Fig. 8 obtained with increasing inhibition (50, 75, 83, 88, 90, 92, and 93%) of mTORC1 (cyan) or mTORC1+2 (violet) or of activation of ERK1/2 (yellow) compared with normal simulations (blue). Shown are the inhibited signals (top) and the downstream effects (bottom). Gray bars indicate the conditions used in the corresponding experimental tests in Fig. 4 as indicated. Data in Fig. 4D were used to estimate model parameters for ERK signaling to phosphorylation of FOXO1; however, the data in Fig. 4, A–C, were not used in estimation of parameters. a.u., arbitrary units. P after a residue number indicates phosphorylation.
Discussion
Herein we have delineated the molecular mechanisms of insulin signaling through FOXO1, normally and in T2D, in human adipocytes. We have shown that FOXO1 is phosphorylated/inhibited via the mTORC2-mediated phosphorylation of PKB at Ser473, a mechanism that is unperturbed in T2D. However, a substantial reduction of the abundance of FOXO1 in T2D may contribute to the diabetic state. Interestingly, the reduced abundance of FOXO1 in response to prolonged treatment of adipocytes with rapamycin indicates that insulin via mTORC1 acts to maintain the abundance of FOXO1 in contrast to the acute inhibition of FOXO1 activity via mTORC2. This also suggests that in the pathogenesis of diabetes the reduction of the concentration of FOXO1 is a consequence of the attenuation of mTORC1 and the feedback to IRS1, which defines much of the diabetic state in these cells.
We demonstrate a significant cross-talk from the MAPK branch to control FOXO1 phosphorylation in response to insulin. It is interesting that, in human adipocytes, the MAPK branch exerts control of transcription through both Elk1 (26) and FOXO1 while simultaneously also controlling translation through the ribosomal protein S6 (26). However, this interrelatedness of signaling branches may just represent the tip of the iceberg as cross-talks and feedbacks likely are highly prevalent in signaling networks (see Ref. 39). In an in vitro assay, ERK2 has been found to phosphorylate FOXO1 at seven sites and in cells overexpressing ERK2 and FOXO1 mutants at nine sites, none of which correspond to the Ser256 in human FOXO1 examined here (40). This may indicate a species difference or that the MAPK-mediated phosphorylation of FOXO1 at Ser256 is catalyzed by another protein kinase.
Importantly, with integration of the mTORC2-PKB-FOXO1 branch in our mathematical model of insulin signaling, we demonstrate a state-of-the-art comprehensive model of the insulin-signaling network dynamics that is entirely based on consistently obtained and comparable data from a single cell type, the isolated mature primary adipocyte of humans. The model is based on network-wide sets of steady-state dose-response and dynamic time course data. The model includes the major signal mediators that control glucose uptake, protein synthesis, and autophagy as well as transcriptional control via Elk1 and FOXO1. The model structure includes insulin receptor internalization and experimentally verified negative and positive feedback loops and cross-talks between the signaling branches. Moreover, the model is extensively verified by a wide array of model properties that are experimentally corroborated. As the model is based on data obtained from adipocytes of non-diabetic subjects and in parallel from patients with T2D, the model enables comparison of insulin signal transmission, normally and in the insulin-resistant diabetic state, over the entire network. This allows a unique systems analysis and comparison of insulin signaling, normally and in diabetes. This is particularly important considering that little has been known about how the insulin resistance is manifested at the molecular level and how it spreads throughout the signaling network to affect the different pleiotropic effects of the hormone. Such knowledge is crucial for a rational development of drugs and treatments of insulin resistance and T2D.
Simulations with the comprehensive model faithfully reproduce the human adipocyte data throughout the entire network, both normally and in the diabetic state (albeit see discussion above about the increased phosphorylation of PKB at Ser473 in the diabetic state) (Fig. 9). The diabetic state is explained network-wide by the experimentally determined attenuation of the mTORC1-to-IRS1 feedback and reduced concentrations of IR, GLUT4, AS160, S6, and FOXO1. The model also allowed us to examine how these differences, which we have identified in the diabetic state, individually affect the insulin-signaling network. Importantly, the attenuation of the positive feedback from mTORC1 to phosphorylation of IRS1 at Ser307 explains most of the insulin resistance throughout the network in the diabetic state. Interestingly, the attenuation of this feedback appears to also explain the reduced abundance of FOXO1, which provides for a lower activity of FOXO1 in the diabetic state. Not much is known about the control of FOXO1 abundance. It has been described that phosphorylated FOXO1 is subject to ubiquitination and subsequent proteasomal degradation (41). Our finding that long term inhibition of mTORC1 with rapamycin reduces the abundance of FOXO1 without affecting the state of phosphorylation of PKB at Ser473 indicates that this mechanism is not operating in this case. Hence, other mechanisms may also control the level of FOXO1 in human adipocytes.
Our model of the insulin-signaling network is neither final nor does it include all known intermediaries and interactions. Nevertheless, the model structure contains the most important intermediaries and aspects of what defines the network as shown by the agreement between model simulations and data. This agreement is achieved by an optimization of model parameter values to available data because the actual values of the parameters are not possible to determine experimentally. The optimization of parameter values allows for model interactions with multiple steps (e.g. IRS1 to PKB in the model), and steps may include interactions in addition to phosphorylation. This is advantageous because the model thus may accurately describe experimental data without prior knowledge of parameter values.
The model presently does not deal with long term effects of insulin, and we have not yet examined the potentially interesting consequences of the reduced FOXO1 abundance, but it may explain the reduced abundance of the insulin receptor (6). It is interesting, however, that the phosphorylation of FOXO1 also in skeletal muscle is similar in lean non-diabetic and obese diabetic individuals before as well as during infusion of insulin (42). Moreover, dysregulation of target gene expression in the diabetic muscle is compatible with a reduced abundance of FOXO1 also in muscle (42). In contrast, it has been reported that expression of FOXO1 is increased in omental adipose tissue in gestational diabetes (43), which may reflect the specific etiology of gestational diabetes or the examination of the adipose tissue where adipocytes constitute just a fraction of the cells.
Our findings indicate a separate control for the phosphorylation of PKB at the two sites Thr308 and Ser473 and that these sites in turn separately control enzyme activity, substrate specificity, and downstream signaling in human adipocytes. This split control of PKB can explain that insulin control of the phosphorylation of FOXO1 remains unperturbed in T2D because insulin controls the phosphorylation of FOXO1 via mTORC2-catalyzed phosphorylation of PKB at Ser473, which is not attenuated in T2D (25). Indeed, in accordance with model predictions, inhibition of the feedback from mTORC1 to phosphorylation of IRS1 by rapamycin blocks the phosphorylation of S6K-Thr389 (26) without reducing the phosphorylation of PKB at Ser473 (25) or its direct downstream target FOXO1 at Ser256 (Fig. 4A). In this context, it is interesting that control of glucose transport in rat adipocytes has been found to be independent of phosphorylation at Ser473 (44). Our findings, moreover, are consistent with earlier findings that insulin resistance due to chronic hyperinsulinemia inhibits GLUT4 translocation in 3T3-L1 adipocytes in response to insulin without affecting the nuclear exclusion of FOXO1 (45).
A problem facing every researcher examining cells ex vivo, be it from animals or human beings, is that we cannot be sure that the excised cells behave as in vivo, although we use identically treated cells as controls. This is not easily resolved as there is no direct way to examine molecular events in a specific cell type in vivo. We have, however, tried to ascertain this as much as possible for the isolated human adipocytes along two lines of investigation. First, we have compared isolated cells with tissue fragments, and we have also subjected isolated cells to a second round of cell isolation procedures without detecting any changes in the response to insulin (46). Moreover, comparison of tissue excision during general anesthesia with excision during local anesthesia did not reveal any differences (46). Second, we have inserted our insulin signaling model for control of glucose uptake as an adipose tissue module in a dynamic whole-body model of glucose homeostasis during intake of a meal. This revealed that both in normal healthy individuals (47) and in patients with type 2 diabetes (25) our model of insulin signaling, normally and in diabetes, respectively, could explain the function of the adipose tissue in maintaining glucose homeostasis during the meal. This is possibly the most rigorous test of the in vivo relevance of any ex vivo system. However, this approach is not applicable for FOXO1 as we have no way of measuring the phosphorylation or abundance of FOXO1 in situ.
The herein presented experimental data and state-of-the-art comprehensive dynamic model of the insulin-signaling network demonstrate that the insulin-resistant state of diabetes is explained systems-wide by an attenuated positive feedback from mTORC1 to IRS1 in conjunction with localized effects in the signaling network caused by the reduced abundance of defined signal-mediating proteins. In contrast to descriptions based solely on bioinformatics analyses of the signaling network, our dynamic model is “alive” and can therefore be asked questions, such as “what happens when a particular signal mediator is augmented or attenuated?”. The model thus provides a unique tool to examine insulin signaling and the network-wide effects of drug candidates with applications in diabetes research as well as in many forms of cancer in which the same signaling branches feature prominently. With this new type of understanding of the human disease now available, it is no longer tenable to define mechanisms of insulin resistance based on animal models of obesity/insulin resistance. Further understanding of the etiology of this disease in humans should benefit from the unique insights gained from our data and model.
Experimental Procedures
Subjects
Informed consent was obtained from all participants. The procedures were approved by the Regional Ethical Board, Linköping University, and were performed in accordance with the World Medical Association Declaration of Helsinki. Female subjects who were undergoing elective gynecological abdominal surgery under general anesthesia at the Department of Obstetrics and Gynecology at the University Hospital in Linköping were recruited consecutively. A slice of subcutaneous tissue from skin to muscle fascia was excised.
To ensure inclusion only of patients with T2D related to obesity (diabesity), patients were selected when diagnosed with T2D and as obese/overweight (BMI >27 kg/m2). In the comparison group, the only selection criterion for non-diabetic subjects was that they were not diagnosed with diabetes and not obese (BMI <28 kg/m2). Thus, there may be some overweight insulin-resistant subjects in the non-diabetic comparison group (patient data are given in the respective figure legend). This approach allows for examination of the common obesity-related T2D and for a wide significance of the results. The subjects were all female, and findings may therefore not automatically be applied to male subjects (48). However, we have previously compared insulin signaling in adipocytes from female and male subjects, normally and in diabetes, and found no significant differences (46).
Materials
Monoclonal mouse anti-β-tubulin antibody was from Sigma-Aldrich (T5201). Anti-FOXO1-Ser(P)256 (catalog number 9461), anti-FOXO1 (catalog number 2880), anti-PKB-Ser(P)473 (catalog number 9271), anti-PKB (catalog number 9272), anti-mTOR (catalog number 2972), and anti-ribosomal protein S6 (catalog number 2217) antibodies were from Cell Signaling Technology. Anti-FOXO1-Lys259,262,271 (sc-49437) and anti-insulin receptor-β (sc-711) antibodies were from Santa Cruz Biotechnology (Santa Cruz, CA). Anti-AS160 (catalog number 07-741) and anti-GLUT4 (07-1404) antibodies were from Millipore. Rapamycin, PD184352, and other chemicals were from Sigma-Aldrich unless otherwise stated.
Isolation and Incubation of Adipocytes
Adipocytes were isolated from subcutaneous adipose tissue by collagenase (type 1; Worthington) digestion as described (49). Cells were incubated in a shaking water bath in supplemented Krebs-Ringer solution as described (46).
SDS-PAGE and Immunoblotting
Cell incubations were terminated by separating cells from medium using centrifugation through dinonylphthalate. To minimize postincubation signaling and protein modifications, cells were immediately dissolved in SDS and β-mercaptoethanol with protease and protein phosphatase inhibitors, frozen within 10 s, and later thawed in boiling water for further processing as described (49). Immunoblotting after SDS-PAGE (46) was evaluated by chemiluminescence imaging (Las 1000, Image-Gauge, Fuji, Tokyo, Japan). After adjusting the concentration of primary and secondary antibodies, the linearity of the chemiluminescence signal to the amount of each specific protein or protein modification was ascertained. β-Tubulin was used as a loading control, and all samples were normalized for the amount of β-tubulin, which was not affected by incubation with insulin for at least 60 min, or with rapamycin or PD184352 as indicated (not shown). Likewise, the amount of tubulin was not different between cells from non-diabetic and diabetic individuals (Fig. 1A). The total amount of FOXO1 protein in the adipocytes did not change during incubation with insulin (see “Results”); hence the determined total phosphorylation of FOXO1 represents the extent of its phosphorylation. The extent of phosphorylation of a protein is expressed such that it is dependent on the abundance of the specific protein (i.e. not as the ratio of the extent of phosphorylation and the abundance of the protein in the cells). This is for comparison between signaling normally and in T2D. For comparison of the level of phosphorylation between subjects, a standard mixture of adipocyte proteins was run in duplicate on each gel so that all samples were normalized to the mean intensity of the corresponding phosphorylated protein in the standard mixture. In some cases, we have expressed the extent of phosphorylation relative to the maximal phosphorylation obtained in each individual experiment. The averages of these values are then reported as percentage of maximum. This is particularly important for dose-response experiments to reveal any difference in EC50 values.
RNA Isolation and Analysis by Real Time PCR
RNA was prepared from isolated adipocytes by TRIzol extraction and solid phase extraction using RNeasy MinElute Cleanup columns (Qiagen, Hilden, Germany). Reagent for real time PCR analysis of 18S rRNA, Glyceraldehyde-3-phosphate dehydrogenase (GAPDH) and iQTM SYBR® Green Supermix were from Bio-Rad. GAPDH was used as internal reference to normalize expression levels between samples. First strand cDNA was synthesized from 1.5 μg of adipocyte total RNA using an iScriptTM Advanced cDNA Synthesis kit for quantitative RT-PCR according to the manufacturer's instructions (Bio-Rad). All real time PCR measurements were performed in triplicates (CFX96TM Real-Time PCR Detection System, Bio-Rad) with default cycle parameters. Primers were as follows: 18S rRNA: forward, 5′-CACATGGCCTCCAAGGAGTAAG-3′ and reverse, 5′-CCAGCAGTGAGGGTCTCTCT-3′; GAPDH: forward, 5′-GTCAGTGGTGGACCTGACCT-3′ and reverse, 5′-CACCACCCTGTTGCTGTAGC-3′.
Mathematical Modeling
We formulated ordinary differential equation models in the Systems Biology Toolbox for Matlab (50, 51). To reduce the number of parameters, we used mass action kinetics in the rate equations. However, for the newly added activation of FOXO1, saturated Michaelis-Menten kinetics was needed to be able to simulate data. The resulting ordinary differential equations for FOXO1 are shown in (Scheme 1) where k12a1, k12a2, k12b, and km12 are model parameters that were estimated using both dose-response and time-resolved data for FOXO1 (Fig. 2, A and C). The inputs to the FOXO1 model were PKB_S473P + PKB_T308P_S473P, i.e. the PKB states phosphorylated at Ser473, and ERK_T202_Y204P, i.e. double phosphorylated ERK (P after a residue number indicates phosphorylation).
SCHEME 1.

We first simulated a steady state for the model without insulin, and second we simulated the effects of insulin with the obtained steady-state values as initial conditions. The estimation of model parameters was only performed for newly added model parameters, and all previously determined parameter values were kept constant. To evaluate the agreement between simulated outputs of the model and experimental data, commonly referred to as the cost, we used the sum of squares of the residuals weighted by the data variance. The data variance was estimated by the S.E. We used the simannealing SBAO function in Systems Biology Toolbox to search through the parameter space.
The comprehensive mathematical model is described in detail in the provided supplemental file catalog mathematical_modeling.zip. This catalog also contains Matlab scripts to simulate the model and to reproduce the figures herein, including all data.
Statistical Analysis
We analyzed batches of adipocytes, and results thus represent the average behavior of the adipocytes. Similarly, every data point presented is the average of adipocytes from the indicated number of subjects. As such, data are widely applicable and have a broad relevance in the population but cannot be used to predict insulin signaling in individual subjects. All experimental values are mean ± S.E. for the indicated number (n) of different subjects. One-sample or Student's t tests were used with p < 0.05 considered significant.
Author Contributions
P. S. conceived and coordinated the study. P. S., M. R. R., E. N., P. K., and G. C. wrote the paper. M. R. R. performed the experiments. M. R. R. and P. S. analyzed the experiments. E. N. made the mathematical modeling. P. K. contributed materials. All authors reviewed the results and approved the final version of the manuscript.
Supplementary Material
This work was supported by a 3-year program at the Swedish Diabetes Fund, University of Linköping, and a 5-year program at the Swedish Research Council. The salary for E. N. was paid through a grant from AstraZeneca.

This article contains the supplemental file catalog mathematical_modeling.zip containing the data, models, and scripts in Matlab format to simulate the models in the article.
The numbering of amino acid residues refers to human sequences.
- T2D
- type 2 diabetes
- FOXO
- forkhead box protein O
- IR
- insulin receptor
- IRS1
- insulin receptor substrate-1
- GLUT4
- insulin-regulated glucose transporter
- mTOR
- mammalian/mechanistic target of rapamycin
- mTORC1
- mammalian/mechanistic target of rapamycin in complex with raptor
- mTORC2
- mammalian/mechanistic target of rapamycin in complex with rictor
- PKB
- protein kinase B
- S6K
- p70 ribosomal S6 kinase
- S6
- ribosomal protein S6
- BMI
- body mass index
- EC50
- half-maximal effective concentration.
References
- 1. Chen L., Magliano D. J., and Zimmet P. Z. (2012) The worldwide epidemiology of type 2 diabetes mellitus—present and future perspectives. Nat. Rev. Endocrinol. 8, 228–236 [DOI] [PubMed] [Google Scholar]
- 2. Samuel V. T., and Shulman G. I. (2016) The pathogenesis of insulin resistance: integrating signaling pathways and substrate flux. J. Clin. Investig. 126, 12–22 [DOI] [PMC free article] [PubMed] [Google Scholar]
- 3. Kousteni S. (2012) FoxO1, the transcriptional chief of staff of energy metabolism. Bone 50, 437–443 [DOI] [PMC free article] [PubMed] [Google Scholar]
- 4. Nakae J., Oki M., and Cao Y. (2008) The FoxO transcription factors and metabolic regulation. FEBS Lett. 582, 54–67 [DOI] [PubMed] [Google Scholar]
- 5. Lettieri Barbato D., Aquilano K., and Ciriolo M. R. (2014) FoxO1 at the nexus between fat catabolism and longevity pathways. Biochim. Biophys. Acta 1841, 1555–1560 [DOI] [PubMed] [Google Scholar]
- 6. Puig O., and Tjian R. (2005) Transcriptional feedback control of insulin receptor by dFOXO/FOXO1. Genes Dev. 19, 2435–2446 [DOI] [PMC free article] [PubMed] [Google Scholar]
- 7. Dowell P., Otto T. C., Adi S., and Lane M. D. (2003) Convergence of peroxisome proliferator-activated receptor γ and Foxo1 signaling pathways. J. Biol. Chem. 278, 45485–45491 [DOI] [PubMed] [Google Scholar]
- 8. Nakae J., Kitamura T., Kitamura Y., Biggs W. H. 3rd, Arden K. C., and Accili D. (2003) The forkhead transcription factor Foxo1 regulates adipocyte differentiation. Dev. Cell 4, 119–129 [DOI] [PubMed] [Google Scholar]
- 9. Kim J. J., Li P., Huntley J., Chang J. P., Arden K. C., and Olefsky J. M. (2009) FoxO1 haploinsufficiency protects against high-fat diet-induced insulin resistance with enhanced peroxisome proliferator-activated receptor gamma activation in adipose tissue. Diabetes 58, 1275–1282 [DOI] [PMC free article] [PubMed] [Google Scholar]
- 10. Armoni M., Harel C., Karni S., Chen H., Bar-Yoseph F., Ver M. R., Quon M. J., and Karnieli E. (2006) FOXO1 represses peroxisome proliferator-activated receptor-γ1 and γ2 gene promotors in primary adipocytes. A novel paradigm to increase insulin sensitivity. J. Biol. Chem. 281, 19881–19891 [DOI] [PubMed] [Google Scholar]
- 11. Franck N., Stenkula K. G., Ost A., Lindström T., Strålfors P., and Nystrom F. H. (2007) Insulin-induced GLUT4 translocation to the plasma membrane is blunted in large compared with small fat cells isolated from the same subjects. Diabetologia 50, 1716–1722 [DOI] [PubMed] [Google Scholar]
- 12. Salans L. B., and Dougherty J. W. (1971) The effect of insulin upon glucose metabolism by adipose cells of different size. Influence of cell lipid and protein content, age, and nutritional state. J. Clin. Investig. 50, 1399–1410 [DOI] [PMC free article] [PubMed] [Google Scholar]
- 13. Laurencikiene J., Skurk T., Kulyté A., Hedén P., Aström G., Sjölin E., Rydén M., Hauner H., and Arner P. (2011) Regulation of lipolysis in small and large fat cells of the same subject. J. Clin. Endocrinol. Metab. 96, E2045–E2049 [DOI] [PubMed] [Google Scholar]
- 14. Klöting N., Fasshauer M., Dietrich A., Kovacs P., Schön M. R., Kern M., Stumvoll M., and Blüher M. (2010) Insulin-sensitive obesity. Am. J. Physiol. Endocrinol. Metab. 299, E506–E515 [DOI] [PubMed] [Google Scholar]
- 15. Lönn M., Mehlig K., Bengtsson C., and Lissner L. (2010) Adipocyte size predicts incidence of type 2 diabetes in women. FASEB J. 24, 326–331 [DOI] [PubMed] [Google Scholar]
- 16. Eijkelenboom A., and Burgering B. M. (2013) FOXOs: signalling integrators for homeostasis maintenance. Nat. Rev. Mol. Cell Biol. 14, 83–97 [DOI] [PubMed] [Google Scholar]
- 17. Brunet A., Bonni A., Zigmond M. J., Lin M. Z., Juo P., Hu L. S., Anderson M. J., Arden K. C., Blenis J., and Greenberg M. E. (1999) Akt promotes cell survival by phosphorylating and inhibiting a Forkhead transcription factor. Cell 96, 857–868 [DOI] [PubMed] [Google Scholar]
- 18. Rena G., Guo S., Cichy S. C., Unterman T. G., and Cohen P. (1999) Phosphorylation of the transcription factor forkhead family member FKHR by protein kinase B. J. Biol. Chem. 274, 17179–17183 [DOI] [PubMed] [Google Scholar]
- 19. Biggs W. H. 3rd, Meisenhelder J., Hunter T., Cavenee W. K., and Arden K. C. (1999) Protein kinase B/Akt-mediated phosphorylation promotes nuclear exclusion of the winged helix transcription factor FKHR1. Proc. Natl. Acad. Sci. U.S.A. 96, 7421–7426 [DOI] [PMC free article] [PubMed] [Google Scholar]
- 20. van der Horst A., Tertoolen L. G., de Vries-Smits L. M., Frye R. A., Medema R. H., and Burgering B. M. (2004) FOXO4 is acetylated upon peroxide stress and deacetylated by the longevity protein hSir2(SIRT1). J. Biol. Chem. 279, 28873–28879 [DOI] [PubMed] [Google Scholar]
- 21. Brunet A., Sweeney L. B., Sturgill J. F., Chua K. F., Greer P. L., Lin Y., Tran H., Ross S. E., Mostoslavsky R., Cohen H. Y., Hu L. S., Cheng H. L., Jedrychowski M. P., Gygi S. P., Sinclair D. A., Alt F. W., and Greenberg M. E. (2004) Stress-dependent regulation of FOXO transcription factors by the SIRT1 deacetylase. Science 303, 2011–2015 [DOI] [PubMed] [Google Scholar]
- 22. Motta M. C., Divecha N., Lemieux M., Kamel C., Chen D., Gu W., Bultsma Y., McBurney M., and Guarente L. (2004) Mammalian SIRT1 represses forkhead transcription factors. Cell 116, 551–563 [DOI] [PubMed] [Google Scholar]
- 23. Danielsson A., Ost A., Nystrom F. H., and Strålfors P. (2005) Attenuation of insulin-stimulated insulin receptor substrate-1 serine 307 phosphorylation in insulin resistance of type 2 diabetes. J. Biol. Chem. 280, 34389–34392 [DOI] [PubMed] [Google Scholar]
- 24. Ost A., Svensson K., Ruishalme I., Brännmark C., Franck N., Krook H., Sandström P., Kjolhede P., and Strålfors P. (2010) Attenuated mTOR signaling and enhanced autophagy in adipocytes from obese patients with type 2 diabetes. Mol. Med. 16, 235–246 [DOI] [PMC free article] [PubMed] [Google Scholar]
- 25. Brännmark C., Nyman E., Fagerholm S., Bergenholm L., Ekstrand E.-M., Cedersund G., and Strålfors P. (2013) Insulin signalling in type 2 diabetes. Experimental and modeling analyses reveal mechanisms of insulin resistance in human adipocytes. J. Biol. Chem. 288, 9867–9880 [DOI] [PMC free article] [PubMed] [Google Scholar]
- 26. Nyman E., Rajan M. R., Fagerholm S., Brännmark C., Cedersund G., and Strålfors P. (2014) A single mechanism can explain network-wide insulin resistance in adipocytes from obese patients with type 2 diabetes. J. Biol. Chem. 289, 33215–33230 [DOI] [PMC free article] [PubMed] [Google Scholar]
- 27. Jacinto E., Facchinetti V., Liu D., Soto N., Wei S., Jung S. Y., Huang Q., Qin J., and Su B. (2006) SIN1/MIP1 maintains rictor-mTOR complex integrity and regulates Akt phosphorylation and substrate specificity. Cell 127, 125–137 [DOI] [PubMed] [Google Scholar]
- 28. Shiota C., Woo J. T., Lindner J., Shelton K. D., and Magnuson M. A. (2006) Multiallelic disruption of the rictor gene in mice reveals that mTOR complex 2 is essential for fetal growth and viability. Dev. Cell 11, 583–589 [DOI] [PubMed] [Google Scholar]
- 29. Guertin D. A., Stevens D. M., Thoreen C. C., Burds A. A., Kalaany N. Y., Moffat J., Brown M., Fitzgerald K. J., and Sabatini D. M. (2006) Ablation in mice of the mTORC components raptor, rictor, or mLST8 reveals that mTORC2 is required for signaling to Akt-FOXO and PKCα, but not S6K1. Dev. Cell 11, 859–871 [DOI] [PubMed] [Google Scholar]
- 30. Yamagata K., Daitoku H., Takahashi Y., Namiki K., Hisatake K., Kako K., Mukai H., Kasuya Y., and Fukamizu A. (2008) Arginine methylation of FOXO transcription factors inhibits their phosphorylation by Akt. Mol. Cell 32, 221–231 [DOI] [PubMed] [Google Scholar]
- 31. Danielsson A., Fagerholm S., Ost A., Franck N., Kjolhede P., Nystrom F. H., and Strålfors P. (2009) Short-term over-eating induces insulin resistance in fat cells in lean human subjects. Mol. Med. 15, 228–234 [DOI] [PMC free article] [PubMed] [Google Scholar]
- 32. Hannan K. M., Brandenburger Y., Jenkins A., Sharkey K., Cavanaugh A., Rothblum L., Moss T., Poortinga G., McArthur G. A., Pearson R. B., and Hannan R. D. (2003) mTOR-dependent regulation of ribosomal gene transcription requires S6K1 and is mediated by phosphorylation of the carboxy-terminal activation domain of the nucleolar transcription factor UBF. Mol. Cell. Biol. 23, 8862–8877 [DOI] [PMC free article] [PubMed] [Google Scholar]
- 33. Kantidakis T., Ramsbottom B. A., Birch J. L., Dowding S. N., and White R. J. (2010) mTOR associates with TFIIIC, is found at tRNA and 5S rRNA genes, and targets their repressor Maf1. Proc. Natl. Acad. Sci. U.S.A. 107, 11823–11828 [DOI] [PMC free article] [PubMed] [Google Scholar]
- 34. Sarbassov D. D., Ali S. M., Sengupta S., Sheen J. H., Hsu P. P., Bagley A. F., Markhard A. L., and Sabatini D. M. (2006) Prolonged rapamycin treatment inhibits mTORC2 assembly and Akt/PKB. Mol. Cell 22, 159–168 [DOI] [PubMed] [Google Scholar]
- 35. Dibble C. C., Asara J. M., and Manning B. D. (2009) Characterization of Rictor phosphorylation sites reveals direct regulation of mTOR complex 2 by S6K1. Mol. Cell. Biol. 29, 5657–5670 [DOI] [PMC free article] [PubMed] [Google Scholar]
- 36. Julien L. A., Carriere A., Moreau J., and Roux P. P. (2010) mTORC1-activated S6K1 phosphorylates Rictor on threonine 1135 and regulates mTORC2 signaling. Mol. Cell. Biol. 30, 908–921 [DOI] [PMC free article] [PubMed] [Google Scholar]
- 37. Treins C., Warne P. H., Magnuson M. A., Pende M., and Downward J. (2010) Rictor is a novel target of p70 S6 kinase-1. Oncogene 29, 1003–1016 [DOI] [PubMed] [Google Scholar]
- 38. Pereira M. J., Palming J., Rizell M., Aureliano M., Carvalho E., Svensson M. K., and Eriksson J. W. (2012) mTOR inhibition with rapamycin causes impaired insulin signalling and glucose uptake in human subcutaneous and omental adipocytes. Mol. Cell. Endocrinol. 355, 96–105 [DOI] [PubMed] [Google Scholar]
- 39. Filteau M., Diss G., Torres-Quiroz F., Dubé A. K., Schraffl A., Bachmann V. A., Gagnon-Arsenault I., Chrétien A. È., Steunou A. L., Dionne U., Côté J., Bisson N., Stefan E., and Landry C. R. (2015) Systematic identification of signal integration by protein kinase A. Proc. Natl. Acad. Sci. U.S.A. 112, 4501–4506 [DOI] [PMC free article] [PubMed] [Google Scholar]
- 40. Asada S., Daitoku H., Matsuzaki H., Saito T., Sudo T., Mukai H., Iwashita S., Kako K., Kishi T., Kasuya Y., and Fukamizu A. (2007) Mitogen-activated protein kinases, Erk and p38, phosphorylate and regulate Foxo1 Cell. Signal. 19, 519–527 [DOI] [PubMed] [Google Scholar]
- 41. Fu W., Ma Q., Chen L., Li P., Zhang M., Ramamoorthy S., Nawaz Z., Shimojima T., Wang H., Yang Y., Shen Z., Zhang Y., Zhang X., Nicosia S. V., Zhang Y., Pledger J. W., Chen J., and Bai W. (2009) MDM2 acts downstream of p53 as an E3 ligase to promote FOXO ubiquitination and degradation. J. Biol. Chem. 284, 13987–14000 [DOI] [PMC free article] [PubMed] [Google Scholar]
- 42. Tonks K. T., Ng Y., Miller S., Coster A. C., Samocha-Bonet D., Iseli T. J., Xu A., Patrick E., Yang J. Y., Junutula J. R., Modrusan Z., Kolumam G., Stöckli J., Chisholm D. J., James D. E., and Greenfield J. R. (2013) Impaired Akt phosphorylation in insulin-resistant human muscle is accompanied by selective and heterogeneous downstream defects. Diabetologia 56, 875–885 [DOI] [PubMed] [Google Scholar]
- 43. Xu Y., Jin B., Sun L., Yang H., Cao X., and Zhang G. (2014) The expression of FoxO1 in placenta and omental adipose tissue of gestational diabetes mellitus. Exp. Clin. Endocrinol. Diabetes 122, 287–294 [DOI] [PubMed] [Google Scholar]
- 44. Kondapaka S. B., Zarnowski M., Yver D. R., Sausville E. A., and Cushman S. W. (2004) 7-Hydroxystaurosporine (UCN-01) inhibition of Akt Thr308 but not Ser473 phosphorylation: a basis for decreased insulin-stimulated glucose transport. Clin. Cancer Res. 10, 7192–7198 [DOI] [PubMed] [Google Scholar]
- 45. Gonzalez E., Flier E., Molle D., Accili D., and McGraw T. E. (2011) Hyperinsulinemia leads to uncoupled insulin regulation of the GLUT4 glucose transporter and the FoxO1 transcription factor. Proc. Natl. Acad. Sci. U.S.A. 108, 10162–10167 [DOI] [PMC free article] [PubMed] [Google Scholar]
- 46. Danielsson A., Ost A., Lystedt E., Kjolhede P., Gustavsson J., Nystrom F. H., and Strålfors P. (2005) Insulin resistance in human adipocytes occurs downstream of IRS1 after surgical cell isolation, but at the level of phosphorylation of IRS1 in type 2 diabetes. FEBS J. 272, 141–151 [DOI] [PubMed] [Google Scholar]
- 47. Nyman E., Brännmark C., Palmér R., Brugård J., Nyström F. H., Strålfors P., and Cedersund G. (2011) A hierarchical whole body modeling approach elucidates the link between in vitro insulin signaling and in vivo glucose homeostasis. J. Biol. Chem. 286, 26028–26041 [DOI] [PMC free article] [PubMed] [Google Scholar]
- 48. de Vries G. J., and Forger N. G. (2015) Sex differences in the brain a whole body perspective. Biol. Sex Diff. 6, 15. [DOI] [PMC free article] [PubMed] [Google Scholar]
- 49. Strålfors P., and Honnor R. C. (1989) Insulin-induced dephosphorylation of hormone-sensitive lipase. Correlation with lipolysis and cAMP-dependent protein kinase activity. Eur. J. Biochem. 182, 379–385 [DOI] [PubMed] [Google Scholar]
- 50. Schmidt H., and Jirstrand M. (2006) Systems Biology Toolbox for MATLAB: a computational platform for research in systems biology. Bioinformatics 22, 514–515 [DOI] [PubMed] [Google Scholar]
- 51. Schmidt H. (2007) SBaddon: high performance simulation for the Systems Biology Toolbox for MATLAB. Bioinformatics 23, 646–647 [DOI] [PubMed] [Google Scholar]
- 52. Brännmark C., Palmér R., Glad S. T., Cedersund G., and Strålfors P. (2010) Mass and information feedbacks through receptor endocytosis govern insulin signaling as revealed using a parameter-free modeling framework. J. Biol. Chem. 285, 20171–20179 [DOI] [PMC free article] [PubMed] [Google Scholar]
Associated Data
This section collects any data citations, data availability statements, or supplementary materials included in this article.