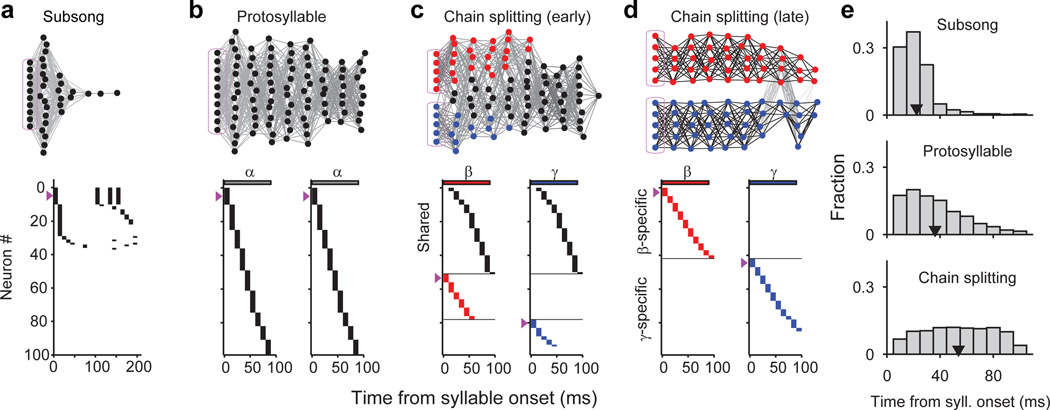
Figure 5. A neural model of sequence formation and splitting in HVC.
a–d, Top: network diagrams of participating neurons (darker lines indicate stronger connections; magenta boxes indicate seed neurons). Bottom: raster plot of neurons showing shared and specific sequences. Neurons sorted by relative latency. Magenta arrows indicate groups of seed neurons. a, Subsong stage: activation of seed neurons produces a rapidly-decaying burst of sequential activity. b, Protosyllable stage: rhythmic activation of seed neurons induces formation of a protosyllable chain. c, Alternating activation of red and blue seed neurons and synaptic competition drives the network to split into two chains (specific neurons: red and blue; shared neurons: black). d, Network after chain splitting. e, Distribution of model burst latencies during subsong, protosyllable stage, and chain splitting stage (early and late combined).

